
|
|||||
|
 | |
| |
| |
| |
| |
| |
|
Gene: PPT2 |
Gene summary for PPT2 |
| Gene information | Species | Human | Gene symbol | PPT2 | Gene ID | 9374 |
| Gene name | palmitoyl-protein thioesterase 2 | |
| Gene Alias | C6orf8 | |
| Cytomap | 6p21.32 | |
| Gene Type | protein-coding | GO ID | GO:0006139 | UniProtAcc | A0A1U9X8D2 |
Top |
Malignant transformation analysis |
| Identification of the aberrant gene expression in precancerous and cancerous lesions by comparing the gene expression of stem-like cells in diseased tissues with normal stem cells |
| Entrez ID | Symbol | Replicates | Species | Organ | Tissue | Adj P-value | Log2FC | Malignancy |
| 9374 | PPT2 | HCC1_Meng | Human | Liver | HCC | 2.48e-42 | 1.33e-01 | 0.0246 |
| 9374 | PPT2 | HCC1 | Human | Liver | HCC | 7.38e-03 | 2.54e+00 | 0.5336 |
| 9374 | PPT2 | Pt13.b | Human | Liver | HCC | 8.69e-06 | 7.54e-02 | 0.0251 |
| 9374 | PPT2 | S014 | Human | Liver | HCC | 3.27e-12 | 3.44e-01 | 0.2254 |
| 9374 | PPT2 | S015 | Human | Liver | HCC | 2.65e-20 | 6.53e-01 | 0.2375 |
| 9374 | PPT2 | S016 | Human | Liver | HCC | 1.06e-18 | 5.04e-01 | 0.2243 |
| 9374 | PPT2 | S028 | Human | Liver | HCC | 1.31e-03 | 1.16e-01 | 0.2503 |
| Page: 1 |
| Tissue | Expression Dynamics | Abbreviation |
| Liver | 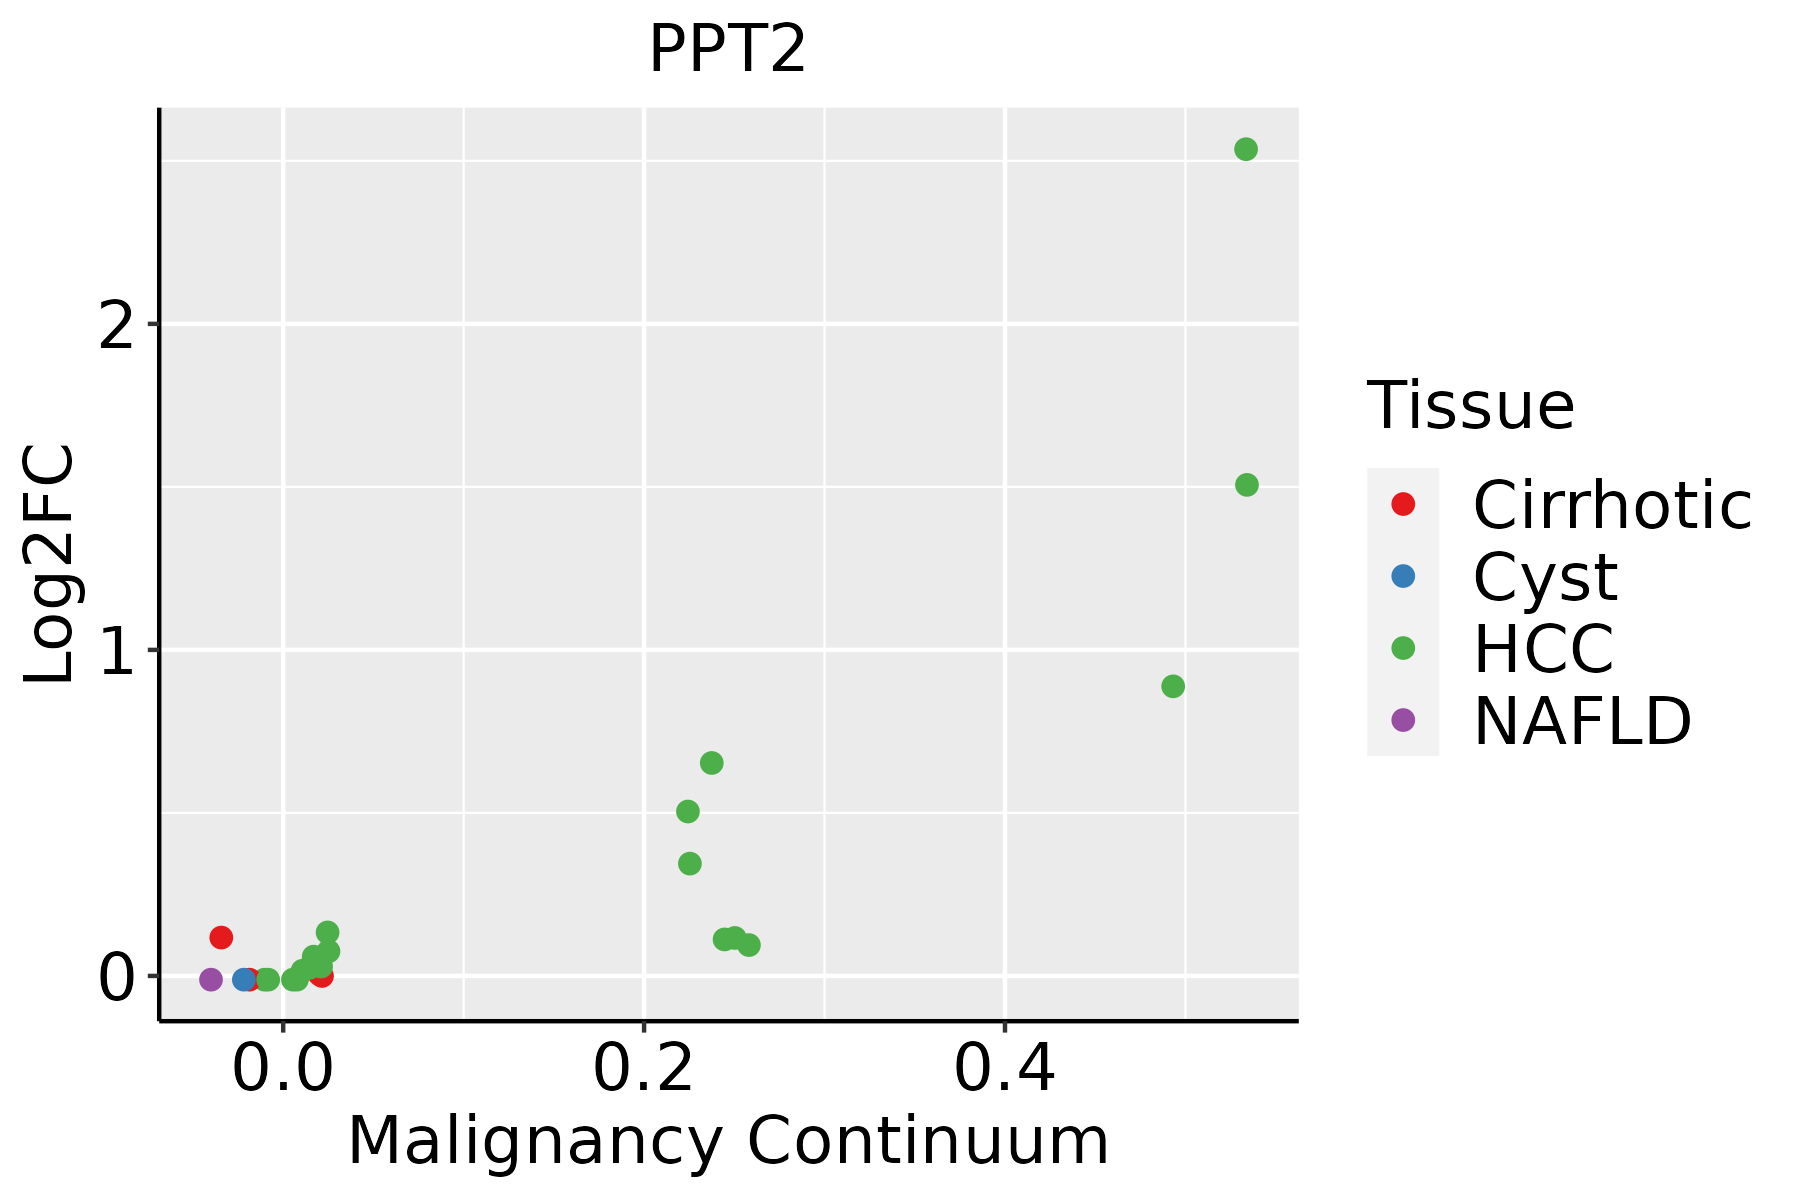 | HCC: Hepatocellular carcinoma |
| NAFLD: Non-alcoholic fatty liver disease |
| ∗log2FC in expression of this searched gene in stem-like cells from each diseased tissue sample relative to stem-like cells in normal samples in each tissue plotted against the malignancy continuum. Samples are colored based on if they are from different disease stage. |
Top |
Malignant transformation related pathway analysis |
| Find out the enriched GO biological processes and KEGG pathways involved in transition from healthy to precancer to cancer |
| Tissue | Disease Stage | Enriched GO biological Processes |
| Colorectum | AD |  |
| Colorectum | SER |  |
| Colorectum | MSS |  |
| Colorectum | MSI-H |  |
| Colorectum | FAP |  |
| ∗Top 15 enriched GO BP terms are showed in the bar plot of each disease state in each tissue. Each row represents a significant GO biological process which is colored according to the -log10(p.adjust). |
| Page: 1 2 3 4 5 6 7 8 9 |
| GO ID | Tissue | Disease Stage | Description | Gene Ratio | Bg Ratio | pvalue | p.adjust | Count |
| GO:000911722 | Liver | HCC | nucleotide metabolic process | 300/7958 | 489/18723 | 1.61e-17 | 1.71e-15 | 300 |
| GO:000675322 | Liver | HCC | nucleoside phosphate metabolic process | 304/7958 | 497/18723 | 1.78e-17 | 1.85e-15 | 304 |
| GO:001969322 | Liver | HCC | ribose phosphate metabolic process | 248/7958 | 396/18723 | 3.15e-16 | 2.70e-14 | 248 |
| GO:000925922 | Liver | HCC | ribonucleotide metabolic process | 240/7958 | 385/18723 | 2.07e-15 | 1.51e-13 | 240 |
| GO:000679021 | Liver | HCC | sulfur compound metabolic process | 212/7958 | 339/18723 | 5.60e-14 | 3.39e-12 | 212 |
| GO:000915022 | Liver | HCC | purine ribonucleotide metabolic process | 226/7958 | 368/18723 | 1.36e-13 | 7.69e-12 | 226 |
| GO:007252122 | Liver | HCC | purine-containing compound metabolic process | 250/7958 | 416/18723 | 2.26e-13 | 1.24e-11 | 250 |
| GO:000616322 | Liver | HCC | purine nucleotide metabolic process | 236/7958 | 396/18723 | 3.59e-12 | 1.62e-10 | 236 |
| GO:00338652 | Liver | HCC | nucleoside bisphosphate metabolic process | 88/7958 | 128/18723 | 1.63e-09 | 4.78e-08 | 88 |
| GO:00338752 | Liver | HCC | ribonucleoside bisphosphate metabolic process | 88/7958 | 128/18723 | 1.63e-09 | 4.78e-08 | 88 |
| GO:00340322 | Liver | HCC | purine nucleoside bisphosphate metabolic process | 88/7958 | 128/18723 | 1.63e-09 | 4.78e-08 | 88 |
| GO:00066372 | Liver | HCC | acyl-CoA metabolic process | 67/7958 | 96/18723 | 5.62e-08 | 1.19e-06 | 67 |
| GO:00353832 | Liver | HCC | thioester metabolic process | 67/7958 | 96/18723 | 5.62e-08 | 1.19e-06 | 67 |
| GO:000916512 | Liver | HCC | nucleotide biosynthetic process | 150/7958 | 254/18723 | 6.79e-08 | 1.40e-06 | 150 |
| GO:190129312 | Liver | HCC | nucleoside phosphate biosynthetic process | 151/7958 | 256/18723 | 6.84e-08 | 1.41e-06 | 151 |
| GO:00442722 | Liver | HCC | sulfur compound biosynthetic process | 95/7958 | 148/18723 | 7.89e-08 | 1.58e-06 | 95 |
| GO:004639012 | Liver | HCC | ribose phosphate biosynthetic process | 116/7958 | 190/18723 | 1.79e-07 | 3.29e-06 | 116 |
| GO:000926012 | Liver | HCC | ribonucleotide biosynthetic process | 111/7958 | 182/18723 | 3.53e-07 | 6.03e-06 | 111 |
| GO:000915212 | Liver | HCC | purine ribonucleotide biosynthetic process | 101/7958 | 169/18723 | 4.30e-06 | 5.50e-05 | 101 |
| GO:007252212 | Liver | HCC | purine-containing compound biosynthetic process | 114/7958 | 200/18723 | 2.36e-05 | 2.49e-04 | 114 |
| Page: 1 2 |
| Pathway ID | Tissue | Disease Stage | Description | Gene Ratio | Bg Ratio | pvalue | p.adjust | qvalue | Count |
| hsa041422 | Liver | HCC | Lysosome | 100/4020 | 132/8465 | 2.32e-11 | 4.31e-10 | 2.40e-10 | 100 |
| hsa012124 | Liver | HCC | Fatty acid metabolism | 45/4020 | 57/8465 | 1.05e-06 | 1.10e-05 | 6.09e-06 | 45 |
| hsa000622 | Liver | HCC | Fatty acid elongation | 20/4020 | 27/8465 | 4.58e-03 | 1.36e-02 | 7.55e-03 | 20 |
| hsa041423 | Liver | HCC | Lysosome | 100/4020 | 132/8465 | 2.32e-11 | 4.31e-10 | 2.40e-10 | 100 |
| hsa012125 | Liver | HCC | Fatty acid metabolism | 45/4020 | 57/8465 | 1.05e-06 | 1.10e-05 | 6.09e-06 | 45 |
| hsa0006211 | Liver | HCC | Fatty acid elongation | 20/4020 | 27/8465 | 4.58e-03 | 1.36e-02 | 7.55e-03 | 20 |
| Page: 1 |
Top |
Cell-cell communication analysis |
| Identification of potential cell-cell interactions between two cell types and their ligand-receptor pairs for different disease states |
| Ligand | Receptor | LRpair | Pathway | Tissue | Disease Stage |
| Page: 1 |
Top |
Single-cell gene regulatory network inference analysis |
| Find out the significant the regulons (TFs) and the target genes of each regulon across cell types for different disease states |
| TF | Cell Type | Tissue | Disease Stage | Target Gene | RSS | Regulon Activity |
| ∗The dot plots of a searched regulon are shown for all cell subpopulations in each disease state of each tissue based on the regulon specific score inferred using pySCENIC and by calculating the average expression. |
| Page: 1 |
Top |
Somatic mutation of malignant transformation related genes |
| Annotation of somatic variants for genes involved in malignant transformation |
| Hugo Symbol | Variant Class | Variant Classification | dbSNP RS | HGVSc | HGVSp | HGVSp Short | SWISSPROT | BIOTYPE | SIFT | PolyPhen | Tumor Sample Barcode | Tissue | Histology | Sex | Age | Stage | Therapy Types | Drugs | Outcome |
| PPT2 | SNV | Missense_Mutation | novel | c.410C>A | p.Ser137Tyr | p.S137Y | Q9UMR5 | protein_coding | deleterious(0) | possibly_damaging(0.89) | TCGA-AN-A046-01 | Breast | breast invasive carcinoma | Female | >=65 | I/II | Unknown | Unknown | SD |
| PPT2 | SNV | Missense_Mutation | c.732N>G | p.Phe244Leu | p.F244L | Q9UMR5 | protein_coding | tolerated(0.68) | benign(0) | TCGA-B6-A0RG-01 | Breast | breast invasive carcinoma | Female | <65 | I/II | Unknown | Unknown | SD | |
| PPT2 | SNV | Missense_Mutation | novel | c.370N>T | p.Arg124Trp | p.R124W | Q9UMR5 | protein_coding | deleterious(0) | probably_damaging(0.999) | TCGA-E2-A573-01 | Breast | breast invasive carcinoma | Female | <65 | I/II | Chemotherapy | taxotere | CR |
| PPT2 | SNV | Missense_Mutation | c.732C>G | p.Phe244Leu | p.F244L | Q9UMR5 | protein_coding | tolerated(0.68) | benign(0) | TCGA-GM-A3XL-01 | Breast | breast invasive carcinoma | Female | <65 | I/II | Chemotherapy | fluorouracil | CR | |
| PPT2 | SNV | Missense_Mutation | c.130C>T | p.Pro44Ser | p.P44S | Q9UMR5 | protein_coding | deleterious(0.01) | probably_damaging(1) | TCGA-IR-A3LA-01 | Cervix | cervical & endocervical cancer | Female | <65 | I/II | Chemotherapy | cisplatin | CR | |
| PPT2 | SNV | Missense_Mutation | c.707N>C | p.Val236Ala | p.V236A | Q9UMR5 | protein_coding | deleterious(0) | probably_damaging(0.999) | TCGA-AD-6964-01 | Colorectum | colon adenocarcinoma | Male | <65 | III/IV | Chemotherapy | folfox | PD | |
| PPT2 | SNV | Missense_Mutation | c.593G>A | p.Ser198Asn | p.S198N | Q9UMR5 | protein_coding | tolerated(0.23) | possibly_damaging(0.448) | TCGA-AZ-6601-01 | Colorectum | colon adenocarcinoma | Male | >=65 | I/II | Unknown | Unknown | PD | |
| PPT2 | SNV | Missense_Mutation | novel | c.362N>A | p.Leu121His | p.L121H | Q9UMR5 | protein_coding | deleterious(0) | probably_damaging(0.987) | TCGA-AG-3726-01 | Colorectum | rectum adenocarcinoma | Female | <65 | I/II | Unknown | Unknown | SD |
| PPT2 | SNV | Missense_Mutation | c.887N>A | p.Arg296His | p.R296H | Q9UMR5 | protein_coding | tolerated(0.54) | benign(0.318) | TCGA-AG-A002-01 | Colorectum | rectum adenocarcinoma | Male | <65 | I/II | Unknown | Unknown | SD | |
| PPT2 | SNV | Missense_Mutation | rs766967673 | c.490N>T | p.Arg164Trp | p.R164W | Q9UMR5 | protein_coding | deleterious(0.01) | probably_damaging(0.985) | TCGA-A5-A0G2-01 | Endometrium | uterine corpus endometrioid carcinoma | Female | <65 | III/IV | Unknown | Unknown | SD |
| Page: 1 2 3 4 |
Top |
Related drugs of malignant transformation related genes |
| Identification of chemicals and drugs interact with genes involved in malignant transfromation |
| (DGIdb 4.0) |
| Entrez ID | Symbol | Category | Interaction Types | Drug Claim Name | Drug Name | PMIDs |
| Page: 1 |

Copyright 2023-Present -The University of Texas Health Science Center at Houston |