
|
|||||
|
 | |
| |
| |
| |
| |
| |
|
Gene: PPT1 |
Gene summary for PPT1 |
| Gene information | Species | Human | Gene symbol | PPT1 | Gene ID | 5538 |
| Gene name | palmitoyl-protein thioesterase 1 | |
| Gene Alias | CLN1 | |
| Cytomap | 1p34.2 | |
| Gene Type | protein-coding | GO ID | GO:0001505 | UniProtAcc | P50897 |
Top |
Malignant transformation analysis |
| Identification of the aberrant gene expression in precancerous and cancerous lesions by comparing the gene expression of stem-like cells in diseased tissues with normal stem cells |
| Entrez ID | Symbol | Replicates | Species | Organ | Tissue | Adj P-value | Log2FC | Malignancy |
| 5538 | PPT1 | GSM4909281 | Human | Breast | IDC | 5.16e-08 | 3.33e-01 | 0.21 |
| 5538 | PPT1 | GSM4909282 | Human | Breast | IDC | 5.25e-04 | 3.14e-01 | -0.0288 |
| 5538 | PPT1 | GSM4909286 | Human | Breast | IDC | 2.30e-07 | 1.71e-01 | 0.1081 |
| 5538 | PPT1 | GSM4909293 | Human | Breast | IDC | 5.53e-04 | 2.16e-01 | 0.1581 |
| 5538 | PPT1 | GSM4909298 | Human | Breast | IDC | 1.17e-03 | 2.12e-01 | 0.1551 |
| 5538 | PPT1 | GSM4909304 | Human | Breast | IDC | 4.80e-31 | 6.40e-01 | 0.1636 |
| 5538 | PPT1 | GSM4909305 | Human | Breast | IDC | 2.71e-03 | 2.79e-01 | 0.0436 |
| 5538 | PPT1 | GSM4909306 | Human | Breast | IDC | 9.31e-03 | 2.43e-01 | 0.1564 |
| 5538 | PPT1 | GSM4909311 | Human | Breast | IDC | 2.56e-08 | -4.29e-02 | 0.1534 |
| 5538 | PPT1 | GSM4909317 | Human | Breast | IDC | 5.95e-06 | 3.16e-01 | 0.1355 |
| 5538 | PPT1 | GSM4909319 | Human | Breast | IDC | 1.04e-08 | -2.90e-03 | 0.1563 |
| 5538 | PPT1 | brca2 | Human | Breast | Precancer | 4.52e-07 | 2.43e-01 | -0.024 |
| 5538 | PPT1 | brca3 | Human | Breast | Precancer | 3.86e-03 | 1.13e-01 | -0.0263 |
| 5538 | PPT1 | NCCBC14 | Human | Breast | DCIS | 1.15e-02 | 1.28e-02 | 0.2021 |
| 5538 | PPT1 | NCCBC5 | Human | Breast | DCIS | 1.39e-05 | 7.32e-02 | 0.2046 |
| 5538 | PPT1 | P1 | Human | Breast | IDC | 6.75e-04 | -3.43e-02 | 0.1527 |
| 5538 | PPT1 | DCIS2 | Human | Breast | DCIS | 1.13e-27 | 4.40e-02 | 0.0085 |
| 5538 | PPT1 | LZE2D | Human | Esophagus | HGIN | 3.93e-02 | 3.17e-01 | 0.0642 |
| 5538 | PPT1 | LZE2T | Human | Esophagus | ESCC | 4.20e-07 | 1.51e+00 | 0.082 |
| 5538 | PPT1 | LZE4T | Human | Esophagus | ESCC | 6.51e-24 | 1.30e+00 | 0.0811 |
| Page: 1 2 3 4 5 6 7 8 |
| Tissue | Expression Dynamics | Abbreviation |
| Breast | 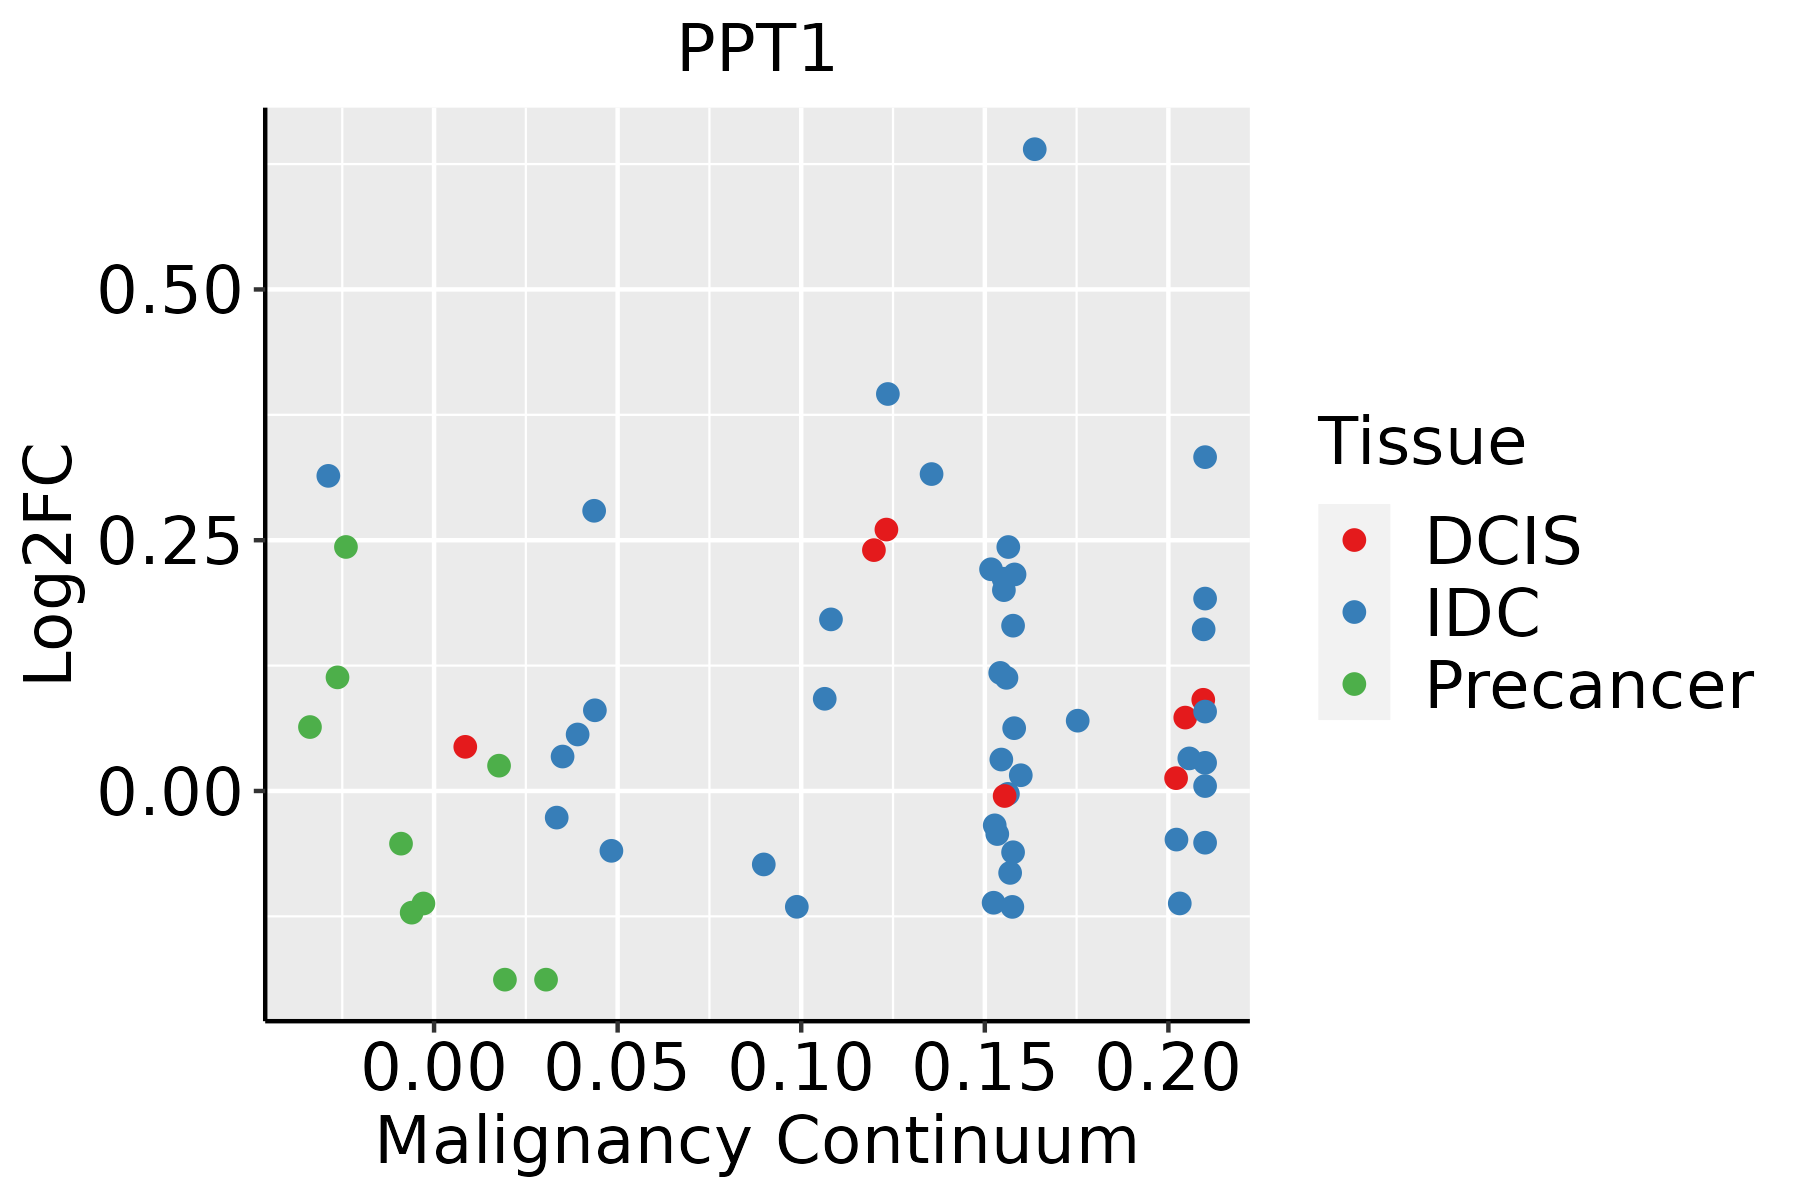 | IDC: Invasive ductal carcinoma |
| DCIS: Ductal carcinoma in situ | ||
| Precancer(BRCA1-mut): Precancerous lesion from BRCA1 mutation carriers | ||
| Esophagus | 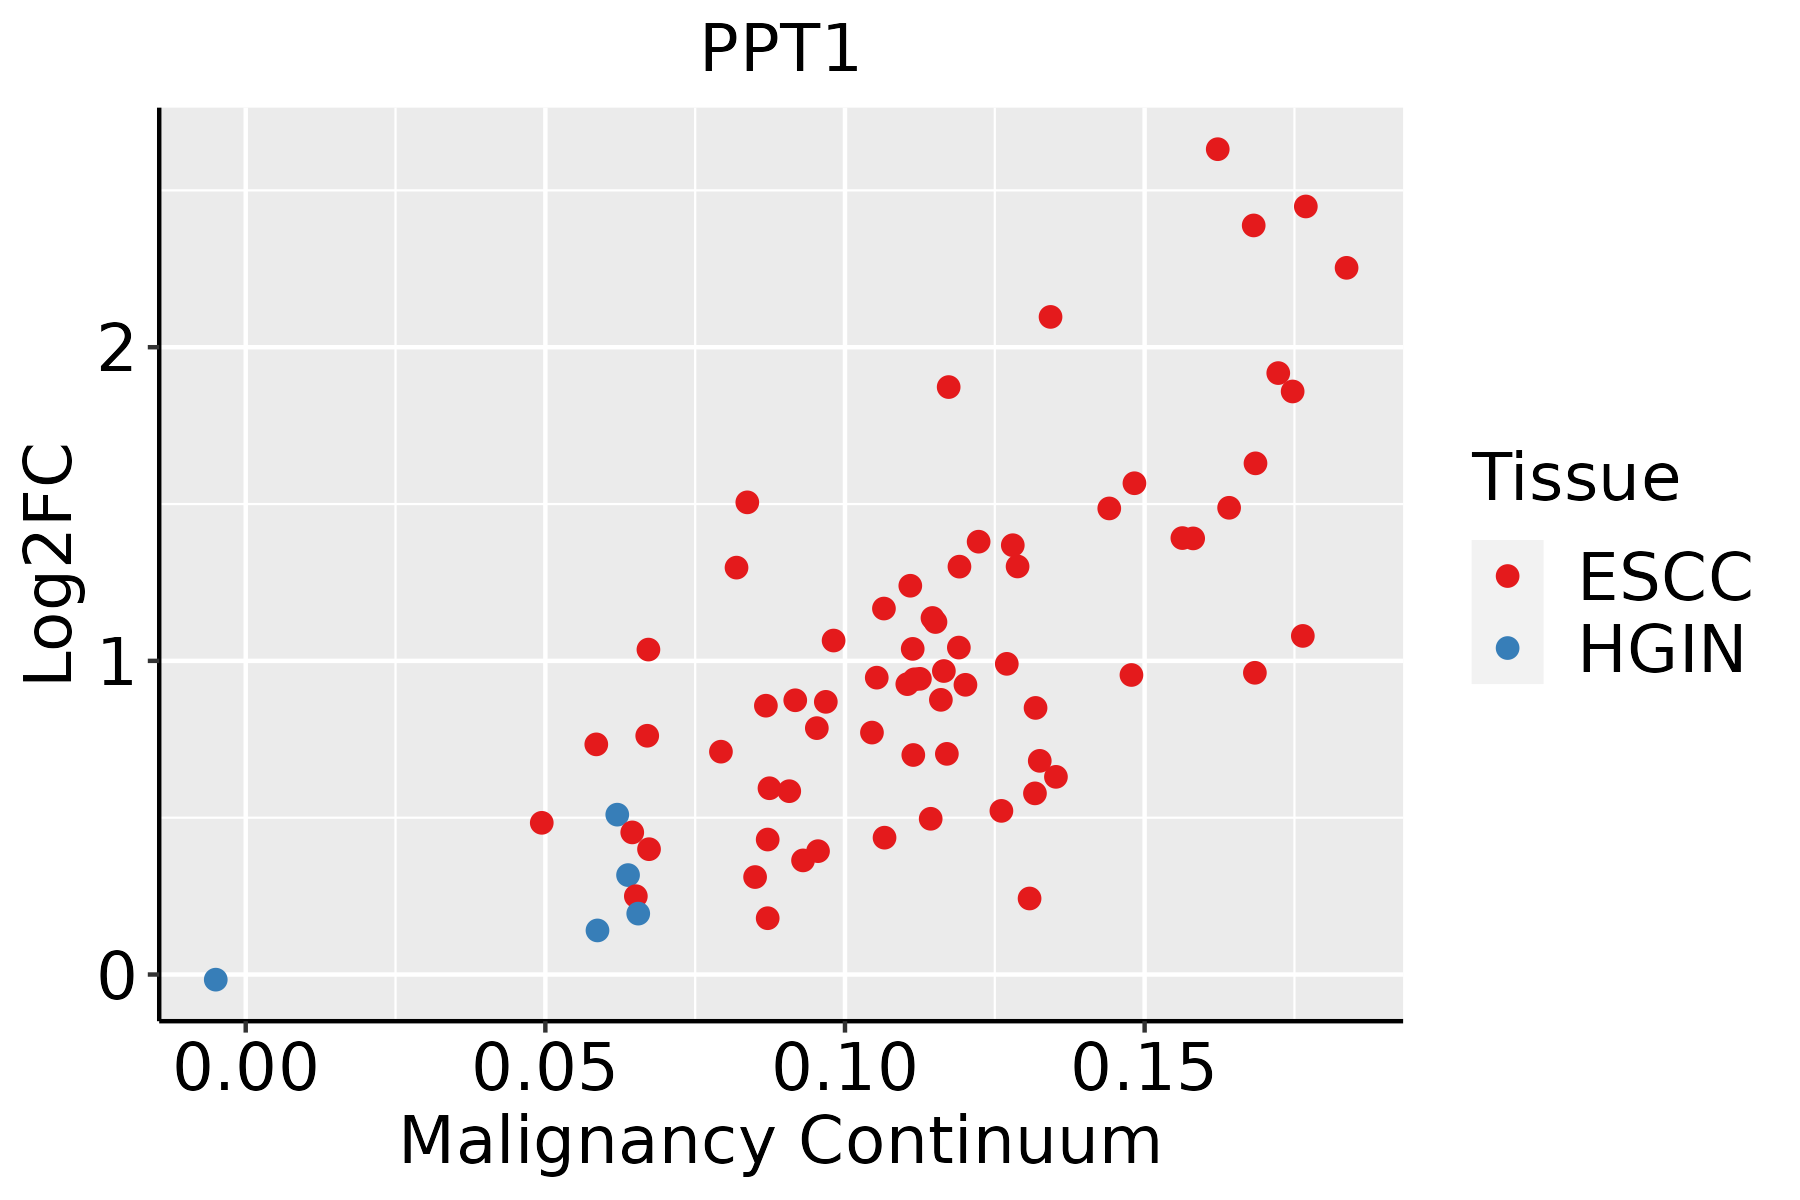 | ESCC: Esophageal squamous cell carcinoma |
| HGIN: High-grade intraepithelial neoplasias | ||
| LGIN: Low-grade intraepithelial neoplasias | ||
| Liver | 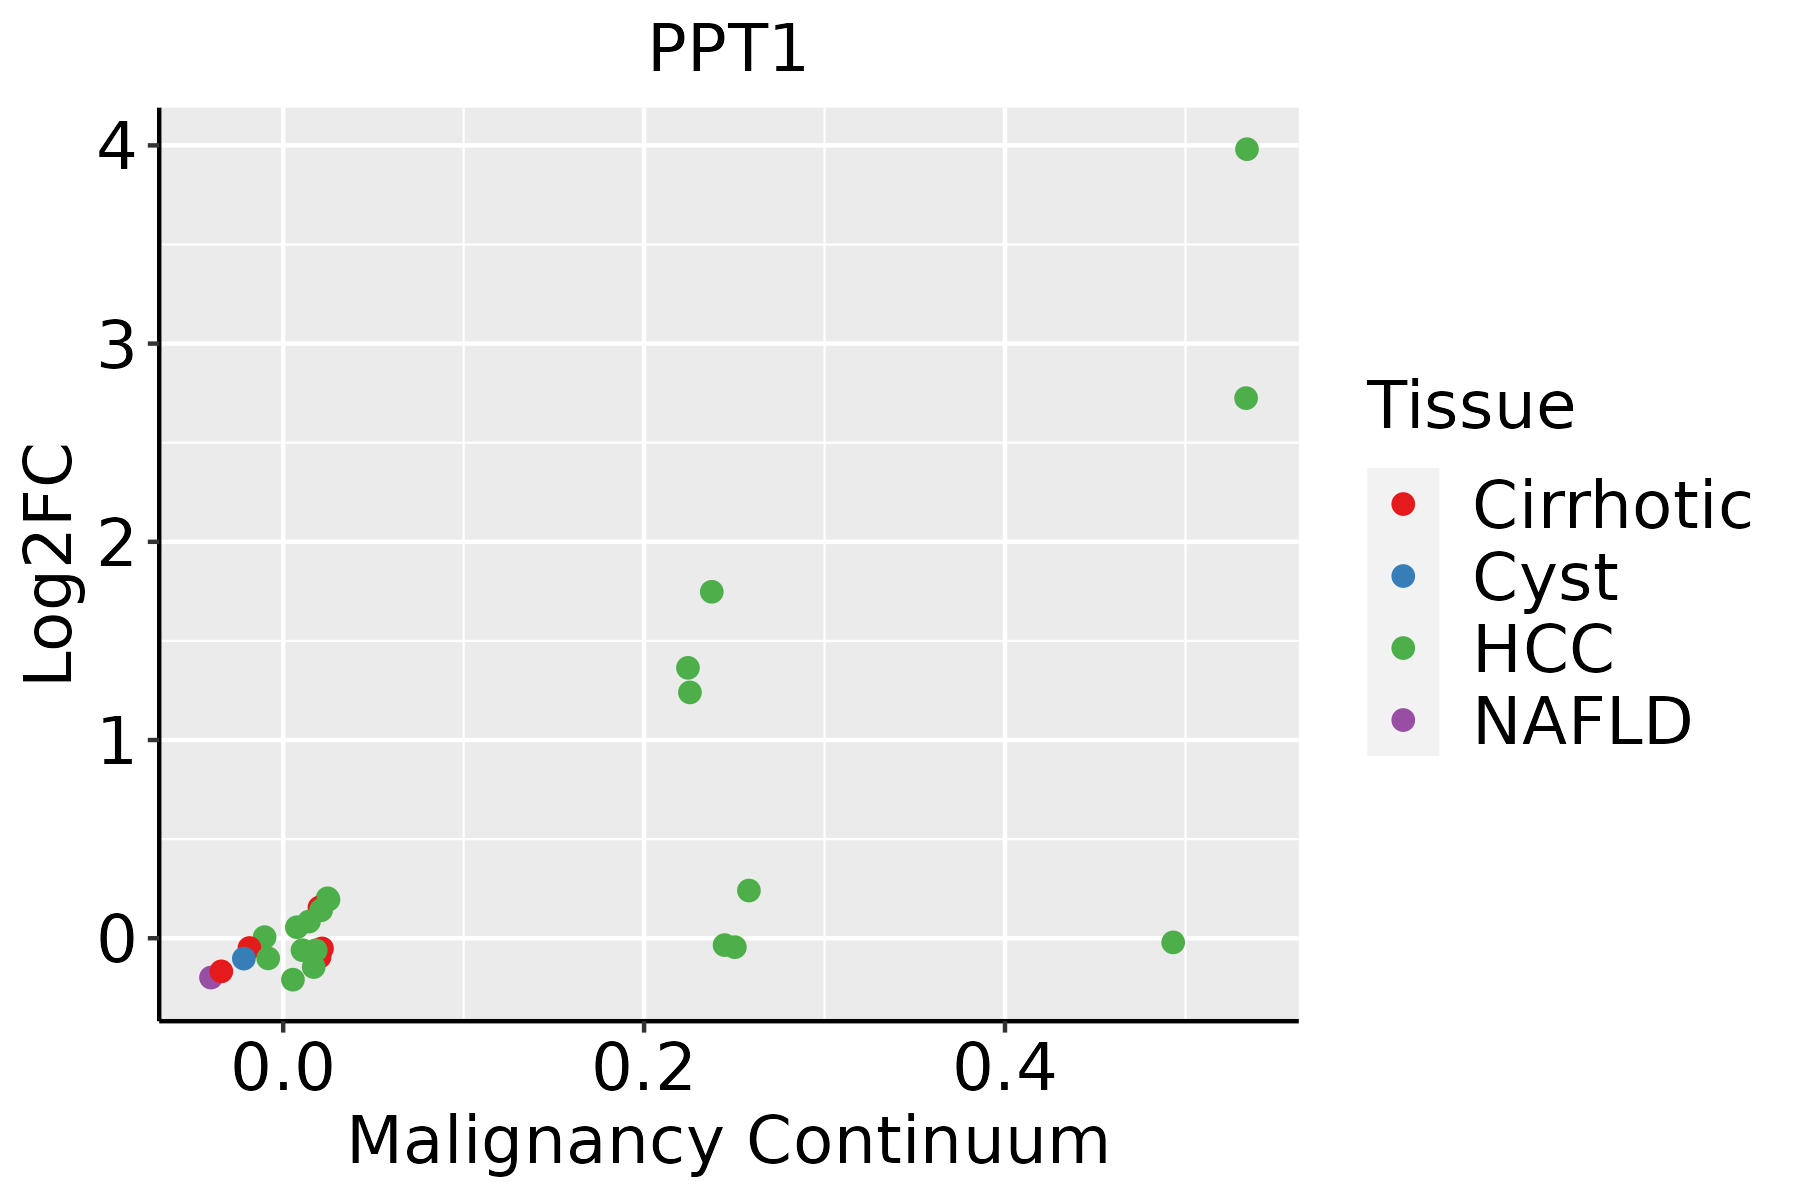 | HCC: Hepatocellular carcinoma |
| NAFLD: Non-alcoholic fatty liver disease | ||
| Oral Cavity | 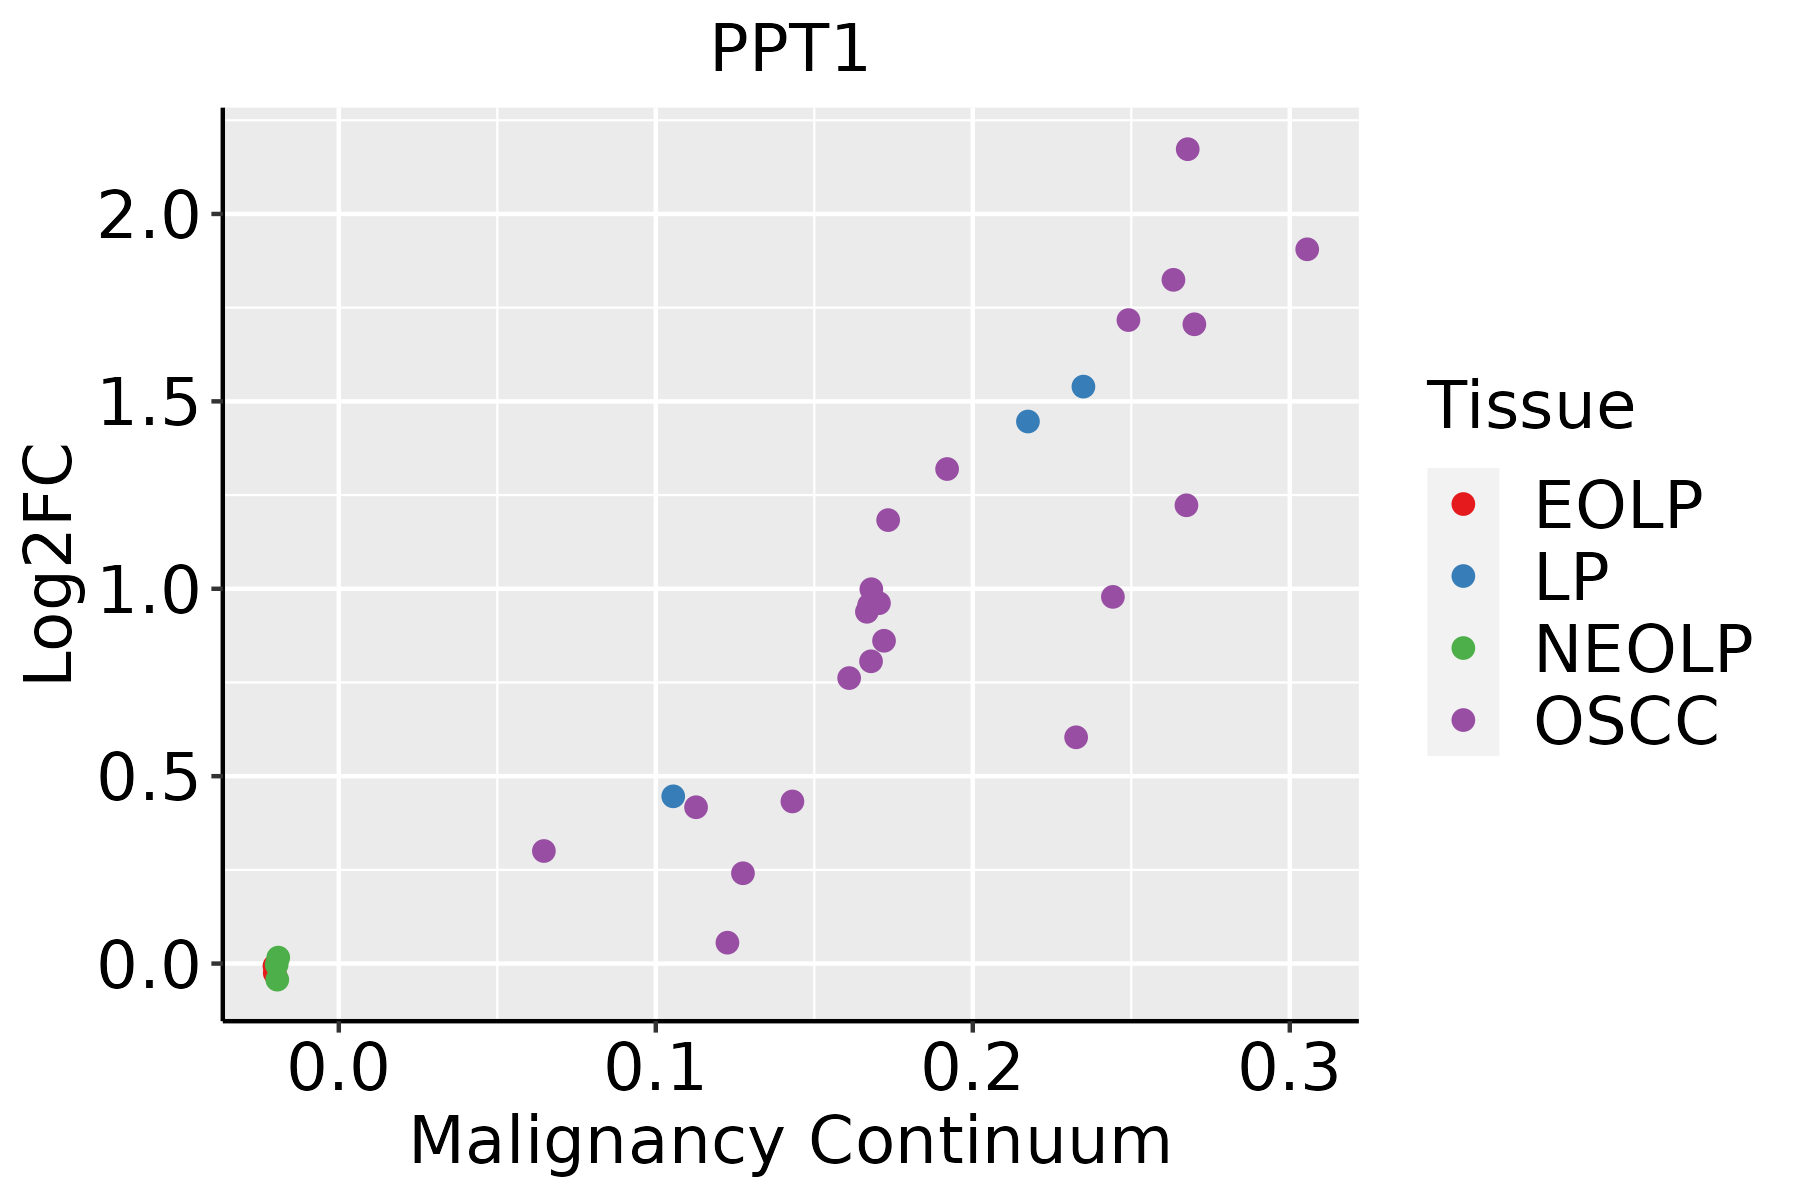 | EOLP: Erosive Oral lichen planus |
| LP: leukoplakia | ||
| NEOLP: Non-erosive oral lichen planus | ||
| OSCC: Oral squamous cell carcinoma | ||
| Prostate |  | BPH: Benign Prostatic Hyperplasia |
| Skin | 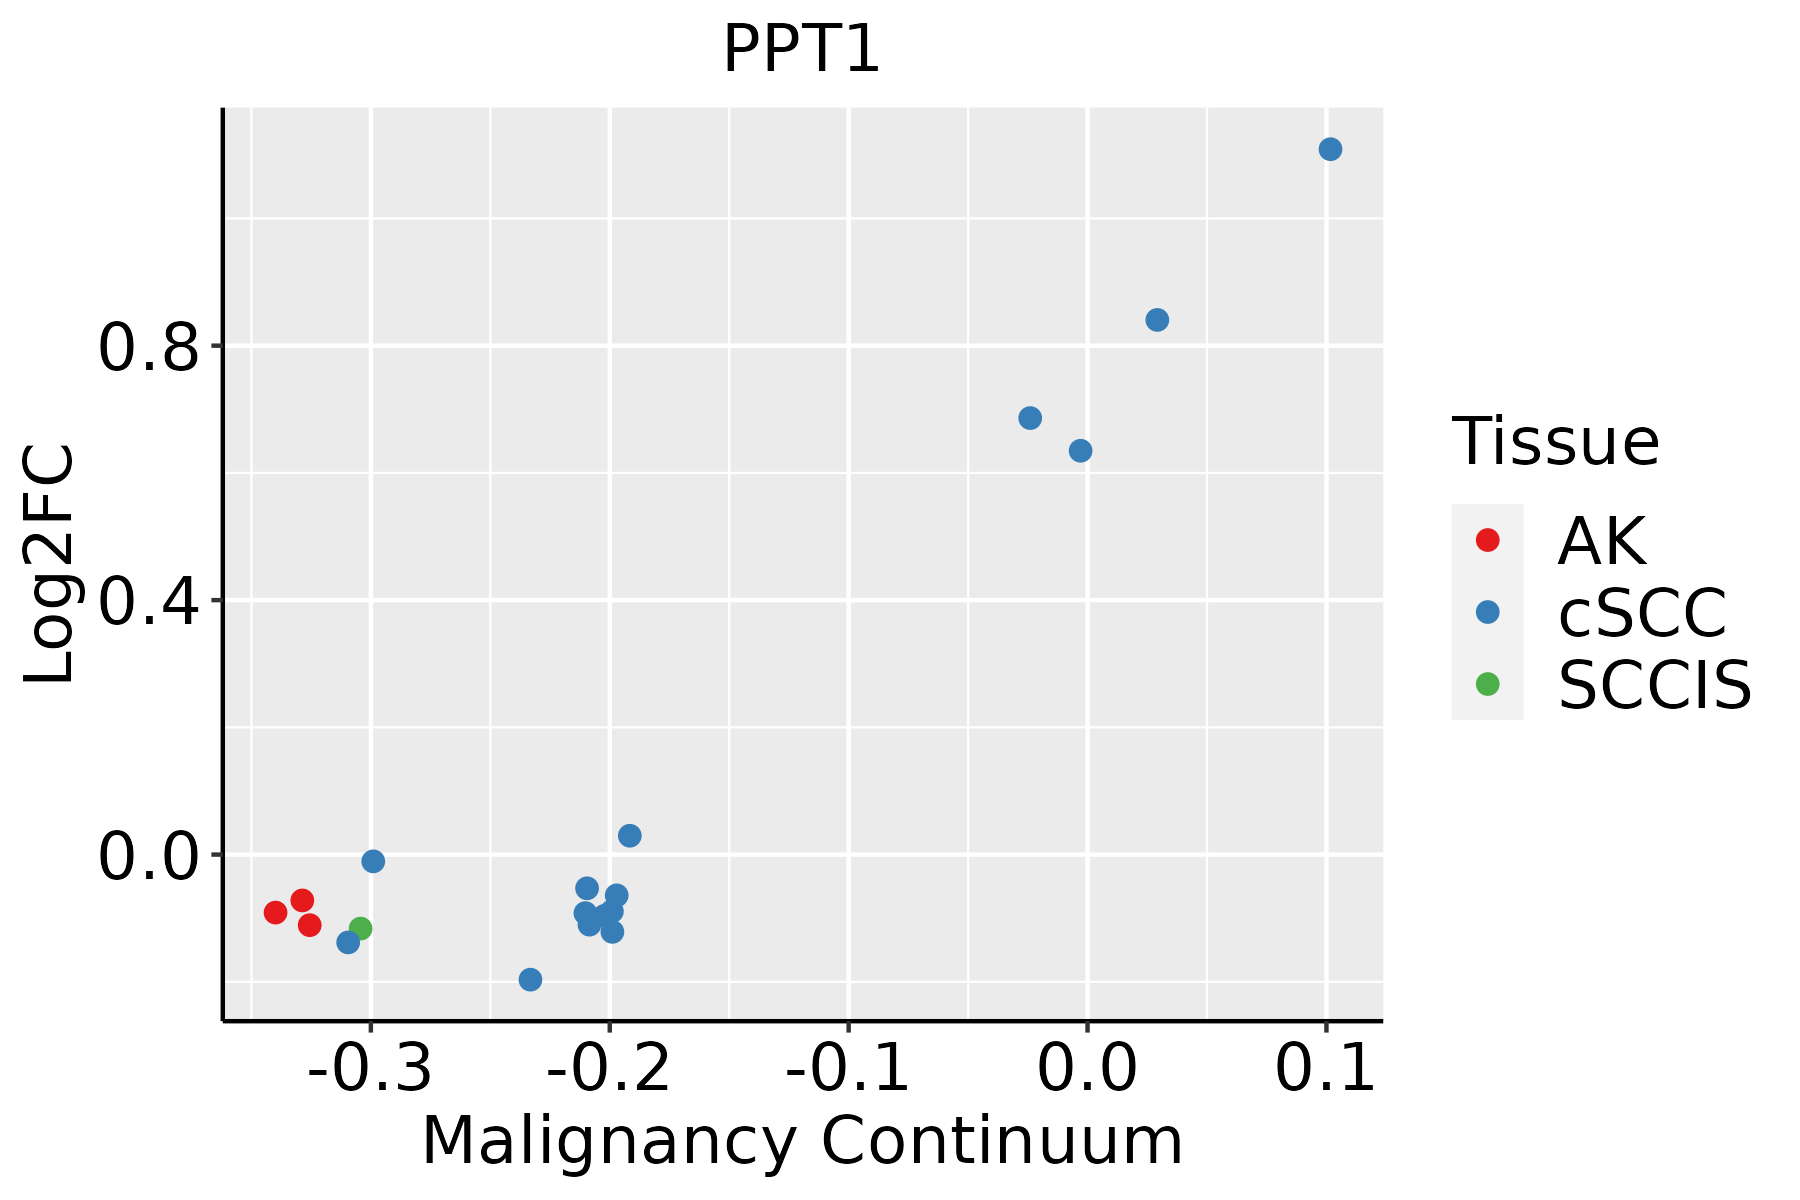 | AK: Actinic keratosis |
| cSCC: Cutaneous squamous cell carcinoma | ||
| SCCIS:squamous cell carcinoma in situ | ||
| Thyroid |  | ATC: Anaplastic thyroid cancer |
| HT: Hashimoto's thyroiditis | ||
| PTC: Papillary thyroid cancer |
| ∗log2FC in expression of this searched gene in stem-like cells from each diseased tissue sample relative to stem-like cells in normal samples in each tissue plotted against the malignancy continuum. Samples are colored based on if they are from different disease stage. |
Top |
Malignant transformation related pathway analysis |
| Find out the enriched GO biological processes and KEGG pathways involved in transition from healthy to precancer to cancer |
| Tissue | Disease Stage | Enriched GO biological Processes |
| Colorectum | AD |  |
| Colorectum | SER |  |
| Colorectum | MSS |  |
| Colorectum | MSI-H |  |
| Colorectum | FAP |  |
| ∗Top 15 enriched GO BP terms are showed in the bar plot of each disease state in each tissue. Each row represents a significant GO biological process which is colored according to the -log10(p.adjust). |
| Page: 1 2 3 4 5 6 7 8 9 |
| GO ID | Tissue | Disease Stage | Description | Gene Ratio | Bg Ratio | pvalue | p.adjust | Count |
| GO:00709979 | Breast | Precancer | neuron death | 50/1080 | 361/18723 | 7.75e-09 | 5.70e-07 | 50 |
| GO:00514029 | Breast | Precancer | neuron apoptotic process | 38/1080 | 246/18723 | 2.68e-08 | 1.75e-06 | 38 |
| GO:00196938 | Breast | Precancer | ribose phosphate metabolic process | 49/1080 | 396/18723 | 3.81e-07 | 1.78e-05 | 49 |
| GO:00091528 | Breast | Precancer | purine ribonucleotide biosynthetic process | 28/1080 | 169/18723 | 4.17e-07 | 1.89e-05 | 28 |
| GO:00463907 | Breast | Precancer | ribose phosphate biosynthetic process | 30/1080 | 190/18723 | 4.75e-07 | 2.11e-05 | 30 |
| GO:00092607 | Breast | Precancer | ribonucleotide biosynthetic process | 29/1080 | 182/18723 | 6.05e-07 | 2.55e-05 | 29 |
| GO:00091509 | Breast | Precancer | purine ribonucleotide metabolic process | 46/1080 | 368/18723 | 6.47e-07 | 2.71e-05 | 46 |
| GO:00091179 | Breast | Precancer | nucleotide metabolic process | 56/1080 | 489/18723 | 7.40e-07 | 3.00e-05 | 56 |
| GO:00092598 | Breast | Precancer | ribonucleotide metabolic process | 47/1080 | 385/18723 | 9.69e-07 | 3.84e-05 | 47 |
| GO:00067539 | Breast | Precancer | nucleoside phosphate metabolic process | 56/1080 | 497/18723 | 1.24e-06 | 4.70e-05 | 56 |
| GO:19012149 | Breast | Precancer | regulation of neuron death | 41/1080 | 319/18723 | 1.27e-06 | 4.80e-05 | 41 |
| GO:00435237 | Breast | Precancer | regulation of neuron apoptotic process | 31/1080 | 212/18723 | 1.69e-06 | 6.08e-05 | 31 |
| GO:00061639 | Breast | Precancer | purine nucleotide metabolic process | 47/1080 | 396/18723 | 2.14e-06 | 7.50e-05 | 47 |
| GO:00061647 | Breast | Precancer | purine nucleotide biosynthetic process | 28/1080 | 191/18723 | 5.04e-06 | 1.52e-04 | 28 |
| GO:00725219 | Breast | Precancer | purine-containing compound metabolic process | 47/1080 | 416/18723 | 8.19e-06 | 2.20e-04 | 47 |
| GO:00725227 | Breast | Precancer | purine-containing compound biosynthetic process | 28/1080 | 200/18723 | 1.23e-05 | 3.17e-04 | 28 |
| GO:00091655 | Breast | Precancer | nucleotide biosynthetic process | 32/1080 | 254/18723 | 2.72e-05 | 6.21e-04 | 32 |
| GO:19012935 | Breast | Precancer | nucleoside phosphate biosynthetic process | 32/1080 | 256/18723 | 3.18e-05 | 6.97e-04 | 32 |
| GO:00160497 | Breast | Precancer | cell growth | 46/1080 | 482/18723 | 5.63e-04 | 7.16e-03 | 46 |
| GO:00435243 | Breast | Precancer | negative regulation of neuron apoptotic process | 19/1080 | 145/18723 | 6.83e-04 | 8.34e-03 | 19 |
| Page: 1 2 3 4 5 6 7 8 9 10 11 12 13 14 15 16 17 18 19 20 21 22 23 24 25 26 27 28 29 |
| Pathway ID | Tissue | Disease Stage | Description | Gene Ratio | Bg Ratio | pvalue | p.adjust | qvalue | Count |
| hsa041426 | Esophagus | HGIN | Lysosome | 33/1383 | 132/8465 | 6.65e-03 | 4.37e-02 | 3.47e-02 | 33 |
| hsa0414213 | Esophagus | HGIN | Lysosome | 33/1383 | 132/8465 | 6.65e-03 | 4.37e-02 | 3.47e-02 | 33 |
| hsa0414222 | Esophagus | ESCC | Lysosome | 102/4205 | 132/8465 | 5.11e-11 | 7.13e-10 | 3.65e-10 | 102 |
| hsa012129 | Esophagus | ESCC | Fatty acid metabolism | 41/4205 | 57/8465 | 5.13e-04 | 1.75e-03 | 8.98e-04 | 41 |
| hsa0414232 | Esophagus | ESCC | Lysosome | 102/4205 | 132/8465 | 5.11e-11 | 7.13e-10 | 3.65e-10 | 102 |
| hsa0121214 | Esophagus | ESCC | Fatty acid metabolism | 41/4205 | 57/8465 | 5.13e-04 | 1.75e-03 | 8.98e-04 | 41 |
| hsa041424 | Liver | Cirrhotic | Lysosome | 68/2530 | 132/8465 | 1.34e-07 | 1.97e-06 | 1.21e-06 | 68 |
| hsa012122 | Liver | Cirrhotic | Fatty acid metabolism | 32/2530 | 57/8465 | 3.12e-05 | 2.47e-04 | 1.52e-04 | 32 |
| hsa0414211 | Liver | Cirrhotic | Lysosome | 68/2530 | 132/8465 | 1.34e-07 | 1.97e-06 | 1.21e-06 | 68 |
| hsa012123 | Liver | Cirrhotic | Fatty acid metabolism | 32/2530 | 57/8465 | 3.12e-05 | 2.47e-04 | 1.52e-04 | 32 |
| hsa041422 | Liver | HCC | Lysosome | 100/4020 | 132/8465 | 2.32e-11 | 4.31e-10 | 2.40e-10 | 100 |
| hsa012124 | Liver | HCC | Fatty acid metabolism | 45/4020 | 57/8465 | 1.05e-06 | 1.10e-05 | 6.09e-06 | 45 |
| hsa000622 | Liver | HCC | Fatty acid elongation | 20/4020 | 27/8465 | 4.58e-03 | 1.36e-02 | 7.55e-03 | 20 |
| hsa041423 | Liver | HCC | Lysosome | 100/4020 | 132/8465 | 2.32e-11 | 4.31e-10 | 2.40e-10 | 100 |
| hsa012125 | Liver | HCC | Fatty acid metabolism | 45/4020 | 57/8465 | 1.05e-06 | 1.10e-05 | 6.09e-06 | 45 |
| hsa0006211 | Liver | HCC | Fatty acid elongation | 20/4020 | 27/8465 | 4.58e-03 | 1.36e-02 | 7.55e-03 | 20 |
| hsa041425 | Oral cavity | OSCC | Lysosome | 87/3704 | 132/8465 | 1.97e-07 | 1.35e-06 | 6.86e-07 | 87 |
| hsa012128 | Oral cavity | OSCC | Fatty acid metabolism | 35/3704 | 57/8465 | 5.37e-03 | 1.29e-02 | 6.55e-03 | 35 |
| hsa0414212 | Oral cavity | OSCC | Lysosome | 87/3704 | 132/8465 | 1.97e-07 | 1.35e-06 | 6.86e-07 | 87 |
| hsa0121213 | Oral cavity | OSCC | Fatty acid metabolism | 35/3704 | 57/8465 | 5.37e-03 | 1.29e-02 | 6.55e-03 | 35 |
| Page: 1 2 |
Top |
Cell-cell communication analysis |
| Identification of potential cell-cell interactions between two cell types and their ligand-receptor pairs for different disease states |
| Ligand | Receptor | LRpair | Pathway | Tissue | Disease Stage |
| Page: 1 |
Top |
Single-cell gene regulatory network inference analysis |
| Find out the significant the regulons (TFs) and the target genes of each regulon across cell types for different disease states |
| TF | Cell Type | Tissue | Disease Stage | Target Gene | RSS | Regulon Activity |
| ∗The dot plots of a searched regulon are shown for all cell subpopulations in each disease state of each tissue based on the regulon specific score inferred using pySCENIC and by calculating the average expression. |
| Page: 1 |
Top |
Somatic mutation of malignant transformation related genes |
| Annotation of somatic variants for genes involved in malignant transformation |
| Hugo Symbol | Variant Class | Variant Classification | dbSNP RS | HGVSc | HGVSp | HGVSp Short | SWISSPROT | BIOTYPE | SIFT | PolyPhen | Tumor Sample Barcode | Tissue | Histology | Sex | Age | Stage | Therapy Types | Drugs | Outcome |
| PPT1 | insertion | Frame_Shift_Ins | novel | c.641_642insTTCTTTTGATAAAAAGGTTTTAAAACTAGCT | p.Tyr215SerfsTer29 | p.Y215Sfs*29 | P50897 | protein_coding | TCGA-AO-A0JB-01 | Breast | breast invasive carcinoma | Female | <65 | III/IV | Chemotherapy | cyclophosphamide | SD | ||
| PPT1 | SNV | Missense_Mutation | c.304N>T | p.Asp102Tyr | p.D102Y | P50897 | protein_coding | deleterious(0) | probably_damaging(0.997) | TCGA-EK-A3GK-01 | Cervix | cervical & endocervical cancer | Female | <65 | I/II | Unknown | Unknown | SD | |
| PPT1 | deletion | Frame_Shift_Del | c.422delN | p.Gly141AspfsTer27 | p.G141Dfs*27 | P50897 | protein_coding | TCGA-CK-5916-01 | Colorectum | colon adenocarcinoma | Female | >=65 | I/II | Unknown | Unknown | PD | |||
| PPT1 | SNV | Missense_Mutation | novel | c.92N>T | p.Ala31Val | p.A31V | P50897 | protein_coding | tolerated(0.13) | benign(0.134) | TCGA-A5-A0G1-01 | Endometrium | uterine corpus endometrioid carcinoma | Female | >=65 | I/II | Unknown | Unknown | SD |
| PPT1 | SNV | Missense_Mutation | novel | c.374C>A | p.Ala125Asp | p.A125D | P50897 | protein_coding | deleterious(0) | probably_damaging(0.91) | TCGA-A5-A1OF-01 | Endometrium | uterine corpus endometrioid carcinoma | Female | <65 | I/II | Unknown | Unknown | SD |
| PPT1 | SNV | Missense_Mutation | rs200813294 | c.802C>T | p.Arg268Cys | p.R268C | P50897 | protein_coding | deleterious(0.03) | probably_damaging(0.988) | TCGA-AJ-A3EK-01 | Endometrium | uterine corpus endometrioid carcinoma | Female | <65 | I/II | Chemotherapy | carboplatin | CR |
| PPT1 | SNV | Missense_Mutation | c.506C>T | p.Ala169Val | p.A169V | P50897 | protein_coding | tolerated(0.5) | benign(0) | TCGA-AP-A0LP-01 | Endometrium | uterine corpus endometrioid carcinoma | Female | >=65 | I/II | Hormone Therapy | megace | SD | |
| PPT1 | SNV | Missense_Mutation | c.829N>A | p.Ala277Thr | p.A277T | P50897 | protein_coding | tolerated(0.24) | benign(0.075) | TCGA-AX-A05S-01 | Endometrium | uterine corpus endometrioid carcinoma | Female | >=65 | III/IV | Unspecific | Carboplatin & Paclitaxel | PD | |
| PPT1 | SNV | Missense_Mutation | novel | c.243N>T | p.Glu81Asp | p.E81D | P50897 | protein_coding | deleterious(0.01) | benign(0.403) | TCGA-B5-A1MR-01 | Endometrium | uterine corpus endometrioid carcinoma | Female | >=65 | III/IV | Unknown | Unknown | SD |
| PPT1 | SNV | Missense_Mutation | c.308C>A | p.Pro103His | p.P103H | P50897 | protein_coding | deleterious(0) | probably_damaging(0.969) | TCGA-BG-A0M4-01 | Endometrium | uterine corpus endometrioid carcinoma | Female | <65 | I/II | Chemotherapy | carboplatin | SD |
| Page: 1 2 3 4 |
Top |
Related drugs of malignant transformation related genes |
| Identification of chemicals and drugs interact with genes involved in malignant transfromation |
| (DGIdb 4.0) |
| Entrez ID | Symbol | Category | Interaction Types | Drug Claim Name | Drug Name | PMIDs |
| 5538 | PPT1 | ENZYME, DRUGGABLE GENOME | LAMOTRIGINE | LAMOTRIGINE | 9151331 | |
| 5538 | PPT1 | ENZYME, DRUGGABLE GENOME | Plitidepsin | PLITIDEPSIN | 25867045 |
| Page: 1 |

Copyright 2023-Present -The University of Texas Health Science Center at Houston |