
|
|||||
|
 | |
| |
| |
| |
| |
| |
|
Gene: PPRC1 |
Gene summary for PPRC1 |
| Gene information | Species | Human | Gene symbol | PPRC1 | Gene ID | 23082 |
| Gene name | PPARG related coactivator 1 | |
| Gene Alias | PRC | |
| Cytomap | 10q24.32 | |
| Gene Type | protein-coding | GO ID | GO:0006139 | UniProtAcc | E7EVG6 |
Top |
Malignant transformation analysis |
| Identification of the aberrant gene expression in precancerous and cancerous lesions by comparing the gene expression of stem-like cells in diseased tissues with normal stem cells |
| Entrez ID | Symbol | Replicates | Species | Organ | Tissue | Adj P-value | Log2FC | Malignancy |
| 23082 | PPRC1 | LZE4T | Human | Esophagus | ESCC | 1.65e-07 | -6.78e-02 | 0.0811 |
| 23082 | PPRC1 | LZE8T | Human | Esophagus | ESCC | 3.17e-04 | 8.68e-02 | 0.067 |
| 23082 | PPRC1 | LZE20T | Human | Esophagus | ESCC | 5.45e-03 | -1.34e-01 | 0.0662 |
| 23082 | PPRC1 | LZE22T | Human | Esophagus | ESCC | 3.51e-02 | -3.74e-02 | 0.068 |
| 23082 | PPRC1 | LZE24T | Human | Esophagus | ESCC | 2.75e-10 | 4.04e-01 | 0.0596 |
| 23082 | PPRC1 | P1T-E | Human | Esophagus | ESCC | 1.23e-10 | 8.31e-02 | 0.0875 |
| 23082 | PPRC1 | P2T-E | Human | Esophagus | ESCC | 1.34e-07 | 1.72e-01 | 0.1177 |
| 23082 | PPRC1 | P4T-E | Human | Esophagus | ESCC | 7.59e-07 | 7.98e-02 | 0.1323 |
| 23082 | PPRC1 | P5T-E | Human | Esophagus | ESCC | 1.20e-09 | 2.00e-01 | 0.1327 |
| 23082 | PPRC1 | P8T-E | Human | Esophagus | ESCC | 1.16e-10 | 6.72e-02 | 0.0889 |
| 23082 | PPRC1 | P9T-E | Human | Esophagus | ESCC | 1.05e-08 | 4.00e-03 | 0.1131 |
| 23082 | PPRC1 | P10T-E | Human | Esophagus | ESCC | 1.16e-09 | -1.05e-01 | 0.116 |
| 23082 | PPRC1 | P11T-E | Human | Esophagus | ESCC | 5.69e-06 | 2.23e-01 | 0.1426 |
| 23082 | PPRC1 | P12T-E | Human | Esophagus | ESCC | 1.36e-17 | 8.03e-02 | 0.1122 |
| 23082 | PPRC1 | P15T-E | Human | Esophagus | ESCC | 4.30e-09 | 1.56e-01 | 0.1149 |
| 23082 | PPRC1 | P16T-E | Human | Esophagus | ESCC | 2.06e-18 | 7.94e-02 | 0.1153 |
| 23082 | PPRC1 | P17T-E | Human | Esophagus | ESCC | 1.10e-05 | 1.28e-01 | 0.1278 |
| 23082 | PPRC1 | P20T-E | Human | Esophagus | ESCC | 1.65e-09 | 1.49e-01 | 0.1124 |
| 23082 | PPRC1 | P21T-E | Human | Esophagus | ESCC | 1.35e-16 | 1.11e-01 | 0.1617 |
| 23082 | PPRC1 | P22T-E | Human | Esophagus | ESCC | 4.72e-11 | -1.02e-01 | 0.1236 |
| Page: 1 2 3 4 |
| Tissue | Expression Dynamics | Abbreviation |
| Esophagus | 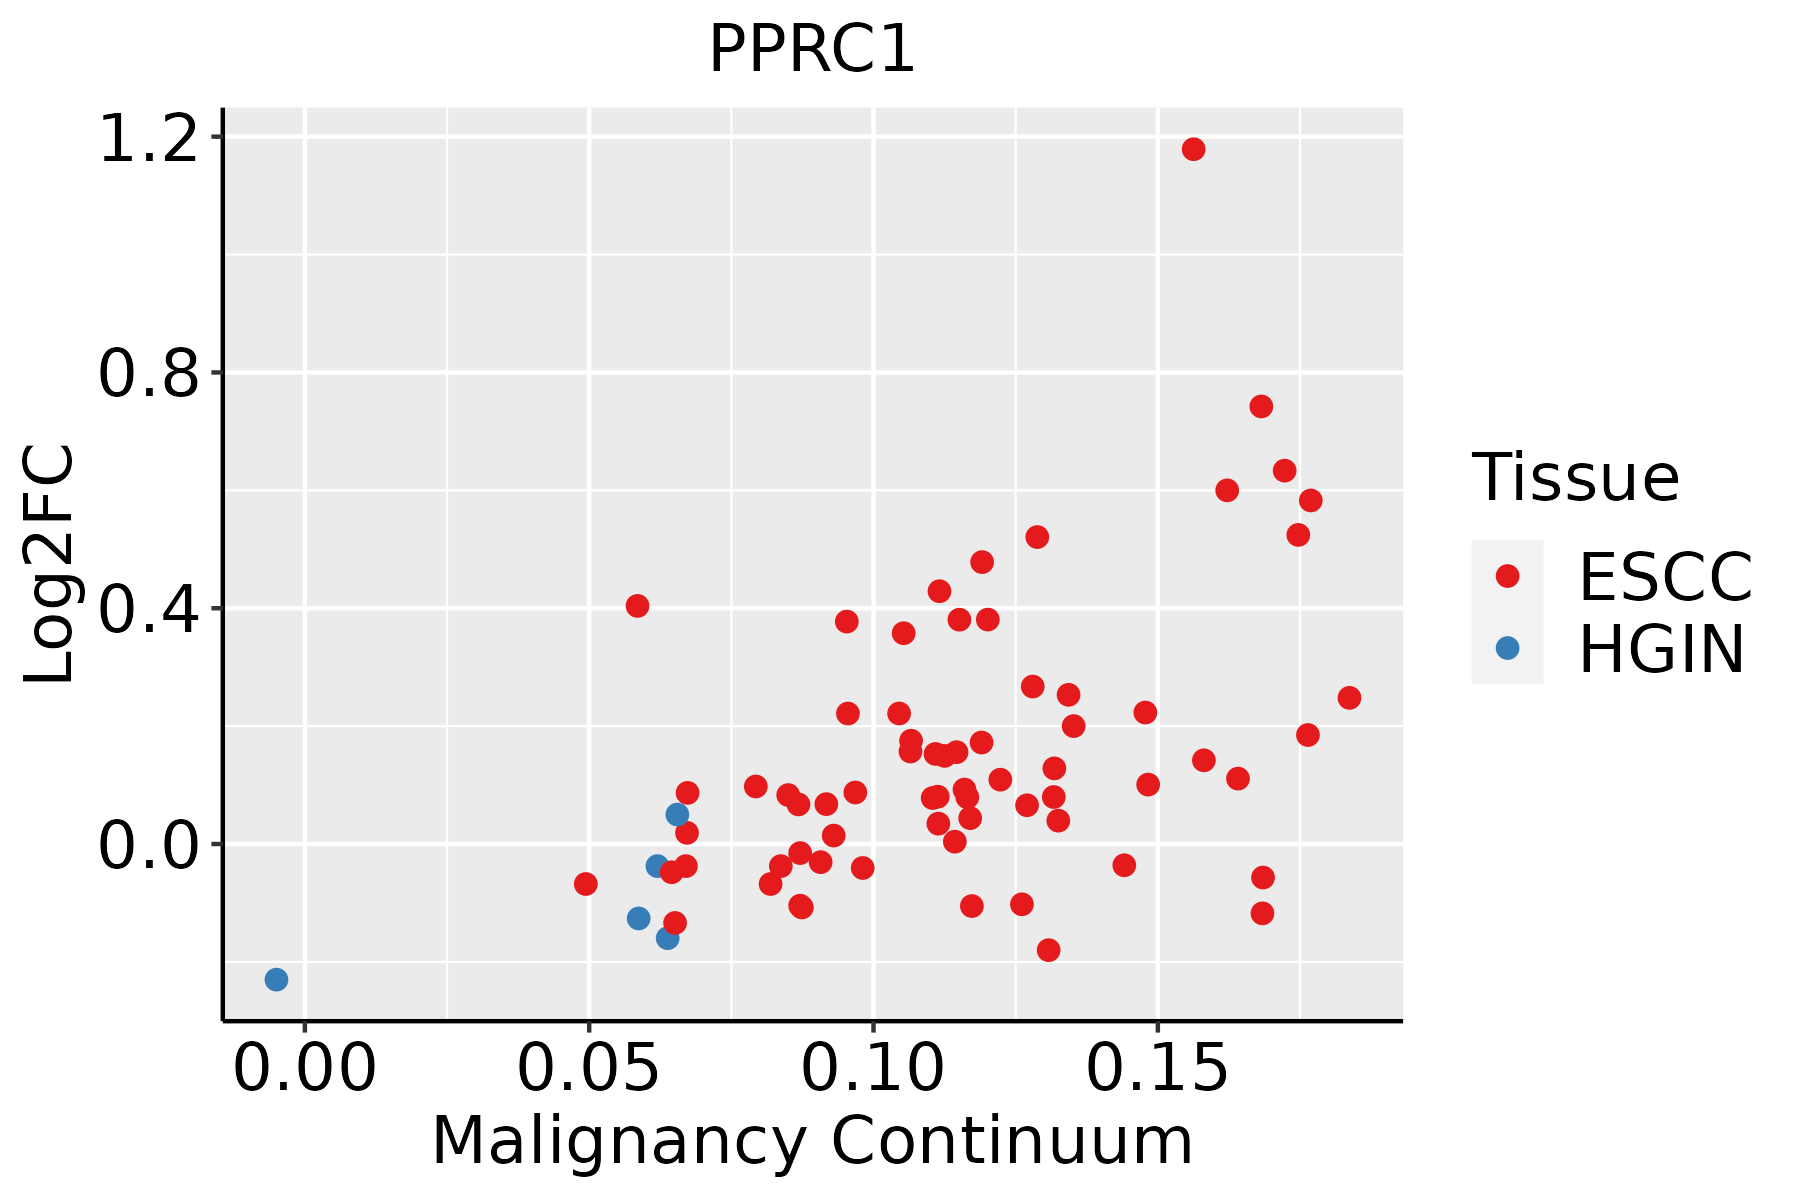 | ESCC: Esophageal squamous cell carcinoma |
| HGIN: High-grade intraepithelial neoplasias | ||
| LGIN: Low-grade intraepithelial neoplasias | ||
| Liver | 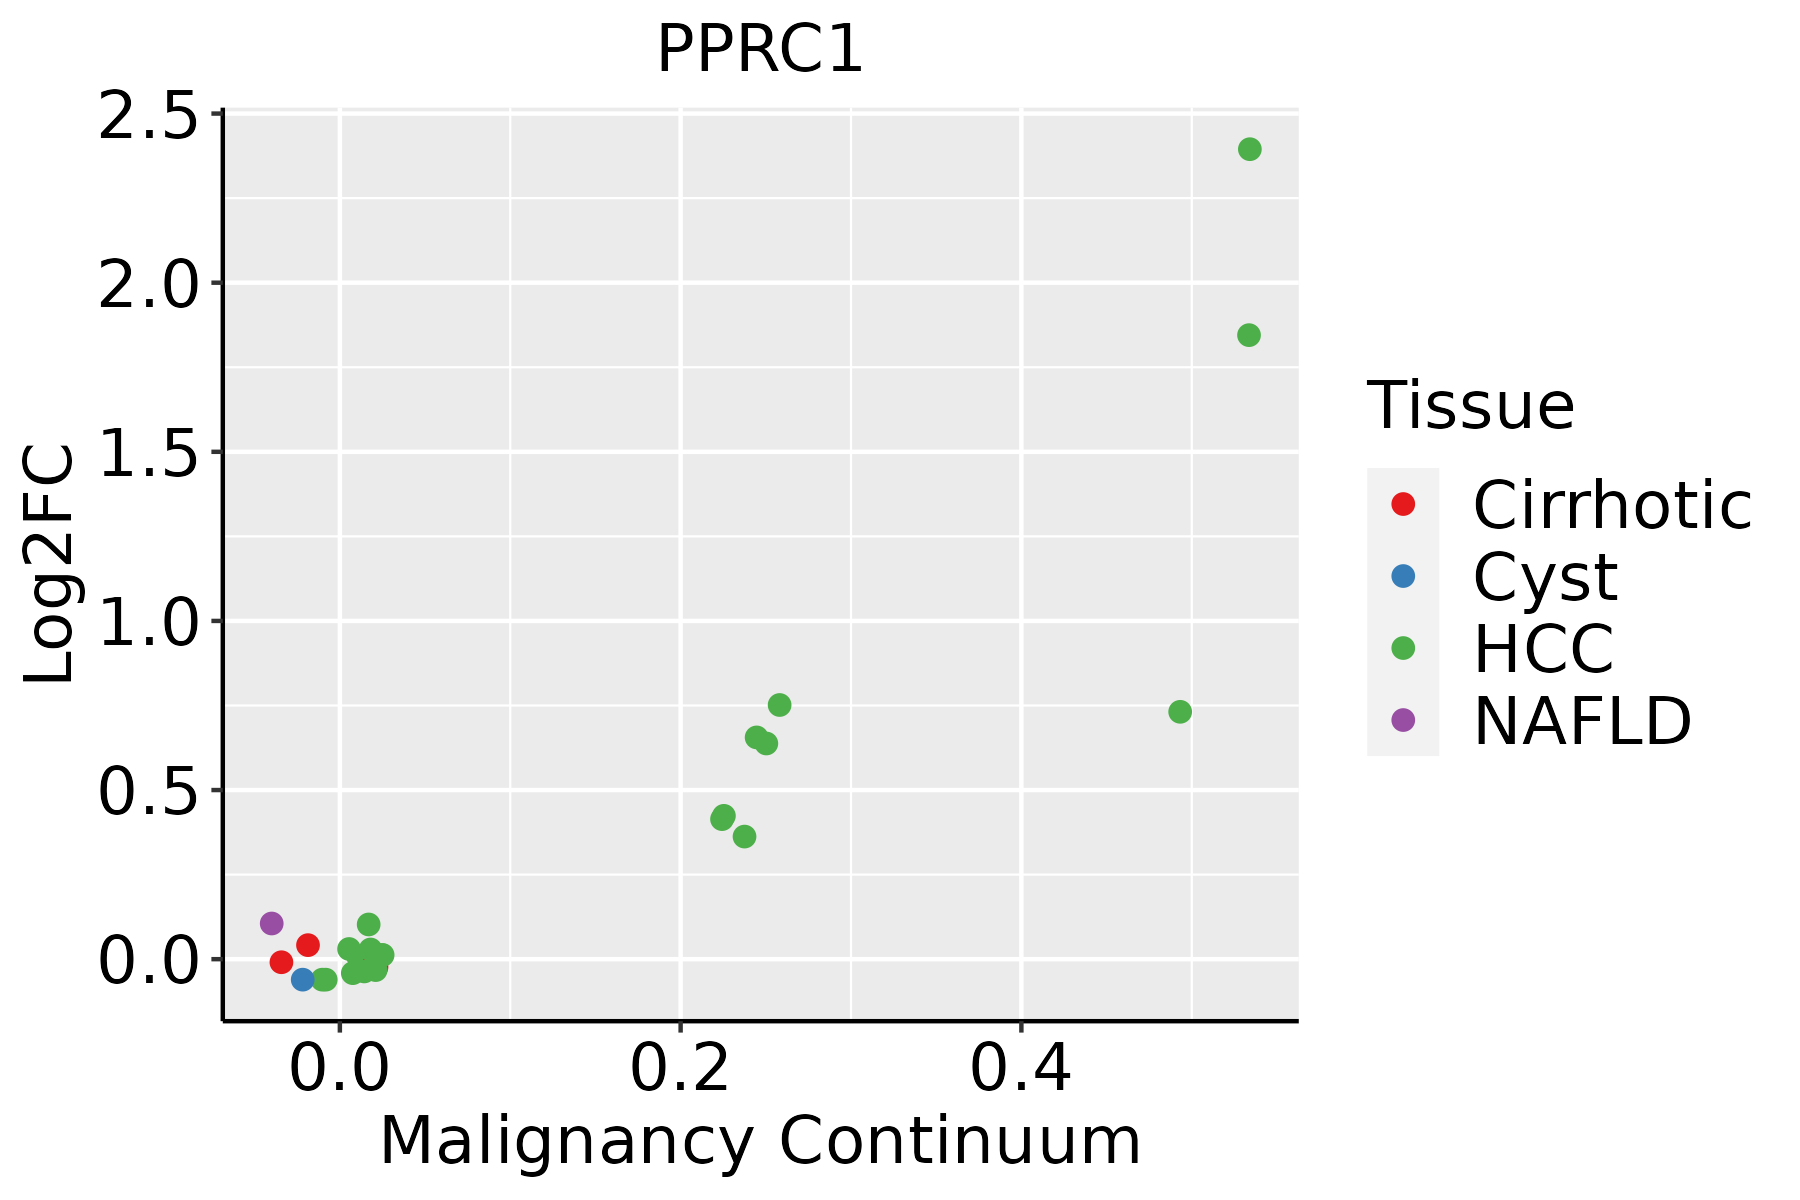 | HCC: Hepatocellular carcinoma |
| NAFLD: Non-alcoholic fatty liver disease |
| ∗log2FC in expression of this searched gene in stem-like cells from each diseased tissue sample relative to stem-like cells in normal samples in each tissue plotted against the malignancy continuum. Samples are colored based on if they are from different disease stage. |
Top |
Malignant transformation related pathway analysis |
| Find out the enriched GO biological processes and KEGG pathways involved in transition from healthy to precancer to cancer |
| Tissue | Disease Stage | Enriched GO biological Processes |
| Colorectum | AD |  |
| Colorectum | SER |  |
| Colorectum | MSS |  |
| Colorectum | MSI-H |  |
| Colorectum | FAP |  |
| ∗Top 15 enriched GO BP terms are showed in the bar plot of each disease state in each tissue. Each row represents a significant GO biological process which is colored according to the -log10(p.adjust). |
| Page: 1 2 3 4 5 6 7 8 9 |
| GO ID | Tissue | Disease Stage | Description | Gene Ratio | Bg Ratio | pvalue | p.adjust | Count |
| GO:00510908 | Esophagus | ESCC | regulation of DNA-binding transcription factor activity | 252/8552 | 440/18723 | 5.22e-07 | 6.97e-06 | 252 |
| GO:00510918 | Esophagus | ESCC | positive regulation of DNA-binding transcription factor activity | 155/8552 | 260/18723 | 3.83e-06 | 4.14e-05 | 155 |
| GO:00510902 | Liver | HCC | regulation of DNA-binding transcription factor activity | 220/7958 | 440/18723 | 8.04e-04 | 4.82e-03 | 220 |
| GO:00510913 | Liver | HCC | positive regulation of DNA-binding transcription factor activity | 131/7958 | 260/18723 | 5.98e-03 | 2.45e-02 | 131 |
| Page: 1 |
| Pathway ID | Tissue | Disease Stage | Description | Gene Ratio | Bg Ratio | pvalue | p.adjust | qvalue | Count |
| Page: 1 |
Top |
Cell-cell communication analysis |
| Identification of potential cell-cell interactions between two cell types and their ligand-receptor pairs for different disease states |
| Ligand | Receptor | LRpair | Pathway | Tissue | Disease Stage |
| Page: 1 |
Top |
Single-cell gene regulatory network inference analysis |
| Find out the significant the regulons (TFs) and the target genes of each regulon across cell types for different disease states |
| TF | Cell Type | Tissue | Disease Stage | Target Gene | RSS | Regulon Activity |
| ∗The dot plots of a searched regulon are shown for all cell subpopulations in each disease state of each tissue based on the regulon specific score inferred using pySCENIC and by calculating the average expression. |
| Page: 1 |
Top |
Somatic mutation of malignant transformation related genes |
| Annotation of somatic variants for genes involved in malignant transformation |
| Hugo Symbol | Variant Class | Variant Classification | dbSNP RS | HGVSc | HGVSp | HGVSp Short | SWISSPROT | BIOTYPE | SIFT | PolyPhen | Tumor Sample Barcode | Tissue | Histology | Sex | Age | Stage | Therapy Types | Drugs | Outcome |
| PPRC1 | SNV | Missense_Mutation | rs780258251 | c.4384C>T | p.His1462Tyr | p.H1462Y | Q5VV67 | protein_coding | deleterious_low_confidence(0.05) | benign(0.25) | TCGA-A2-A04P-01 | Breast | breast invasive carcinoma | Female | <65 | III/IV | Chemotherapy | taxol | PD |
| PPRC1 | SNV | Missense_Mutation | novel | c.4616T>C | p.Ile1539Thr | p.I1539T | Q5VV67 | protein_coding | deleterious(0) | possibly_damaging(0.645) | TCGA-AO-A0J9-01 | Breast | breast invasive carcinoma | Female | <65 | III/IV | Chemotherapy | cyclophosphamide | PD |
| PPRC1 | SNV | Missense_Mutation | c.830N>C | p.His277Pro | p.H277P | Q5VV67 | protein_coding | deleterious_low_confidence(0.01) | possibly_damaging(0.454) | TCGA-AQ-A0Y5-01 | Breast | breast invasive carcinoma | Female | >=65 | III/IV | Chemotherapy | cytoxan | SD | |
| PPRC1 | SNV | Missense_Mutation | c.4924G>A | p.Val1642Ile | p.V1642I | Q5VV67 | protein_coding | deleterious(0.03) | benign(0.365) | TCGA-AR-A256-01 | Breast | breast invasive carcinoma | Female | <65 | I/II | Chemotherapy | doxorubicin | PD | |
| PPRC1 | SNV | Missense_Mutation | c.218N>A | p.Leu73Gln | p.L73Q | Q5VV67 | protein_coding | deleterious_low_confidence(0) | possibly_damaging(0.879) | TCGA-D8-A1XF-01 | Breast | breast invasive carcinoma | Female | <65 | I/II | Chemotherapy | adriamycin+cyclophosphamide | SD | |
| PPRC1 | SNV | Missense_Mutation | novel | c.4393T>C | p.Trp1465Arg | p.W1465R | Q5VV67 | protein_coding | tolerated_low_confidence(0.12) | benign(0.402) | TCGA-D8-A1XK-01 | Breast | breast invasive carcinoma | Female | <65 | I/II | Chemotherapy | doxorubicine+cyclophosphamide | SD |
| PPRC1 | SNV | Missense_Mutation | rs757322330 | c.3613N>A | p.Val1205Ile | p.V1205I | Q5VV67 | protein_coding | tolerated_low_confidence(0.22) | benign(0.003) | TCGA-D8-A1XQ-01 | Breast | breast invasive carcinoma | Female | >=65 | I/II | Unknown | Unknown | SD |
| PPRC1 | SNV | Missense_Mutation | c.4568N>T | p.Ser1523Leu | p.S1523L | Q5VV67 | protein_coding | deleterious(0) | possibly_damaging(0.454) | TCGA-D8-A27L-01 | Breast | breast invasive carcinoma | Female | <65 | III/IV | Chemotherapy | adriamycin+cuclophosphamide | SD | |
| PPRC1 | SNV | Missense_Mutation | c.3869N>G | p.His1290Arg | p.H1290R | Q5VV67 | protein_coding | deleterious_low_confidence(0) | probably_damaging(0.963) | TCGA-E2-A10C-01 | Breast | breast invasive carcinoma | Female | <65 | I/II | Chemotherapy | cytoxan | SD | |
| PPRC1 | SNV | Missense_Mutation | c.46A>T | p.Ser16Cys | p.S16C | Q5VV67 | protein_coding | deleterious_low_confidence(0.01) | benign(0.43) | TCGA-E2-A152-01 | Breast | breast invasive carcinoma | Female | <65 | I/II | Targeted Molecular therapy | trastuzumab | PD |
| Page: 1 2 3 4 5 6 7 8 9 10 11 12 13 14 15 16 |
Top |
Related drugs of malignant transformation related genes |
| Identification of chemicals and drugs interact with genes involved in malignant transfromation |
| (DGIdb 4.0) |
| Entrez ID | Symbol | Category | Interaction Types | Drug Claim Name | Drug Name | PMIDs |
| Page: 1 |

Copyright 2023-Present -The University of Texas Health Science Center at Houston |