| Tissue | Expression Dynamics | Abbreviation |
| Cervix | 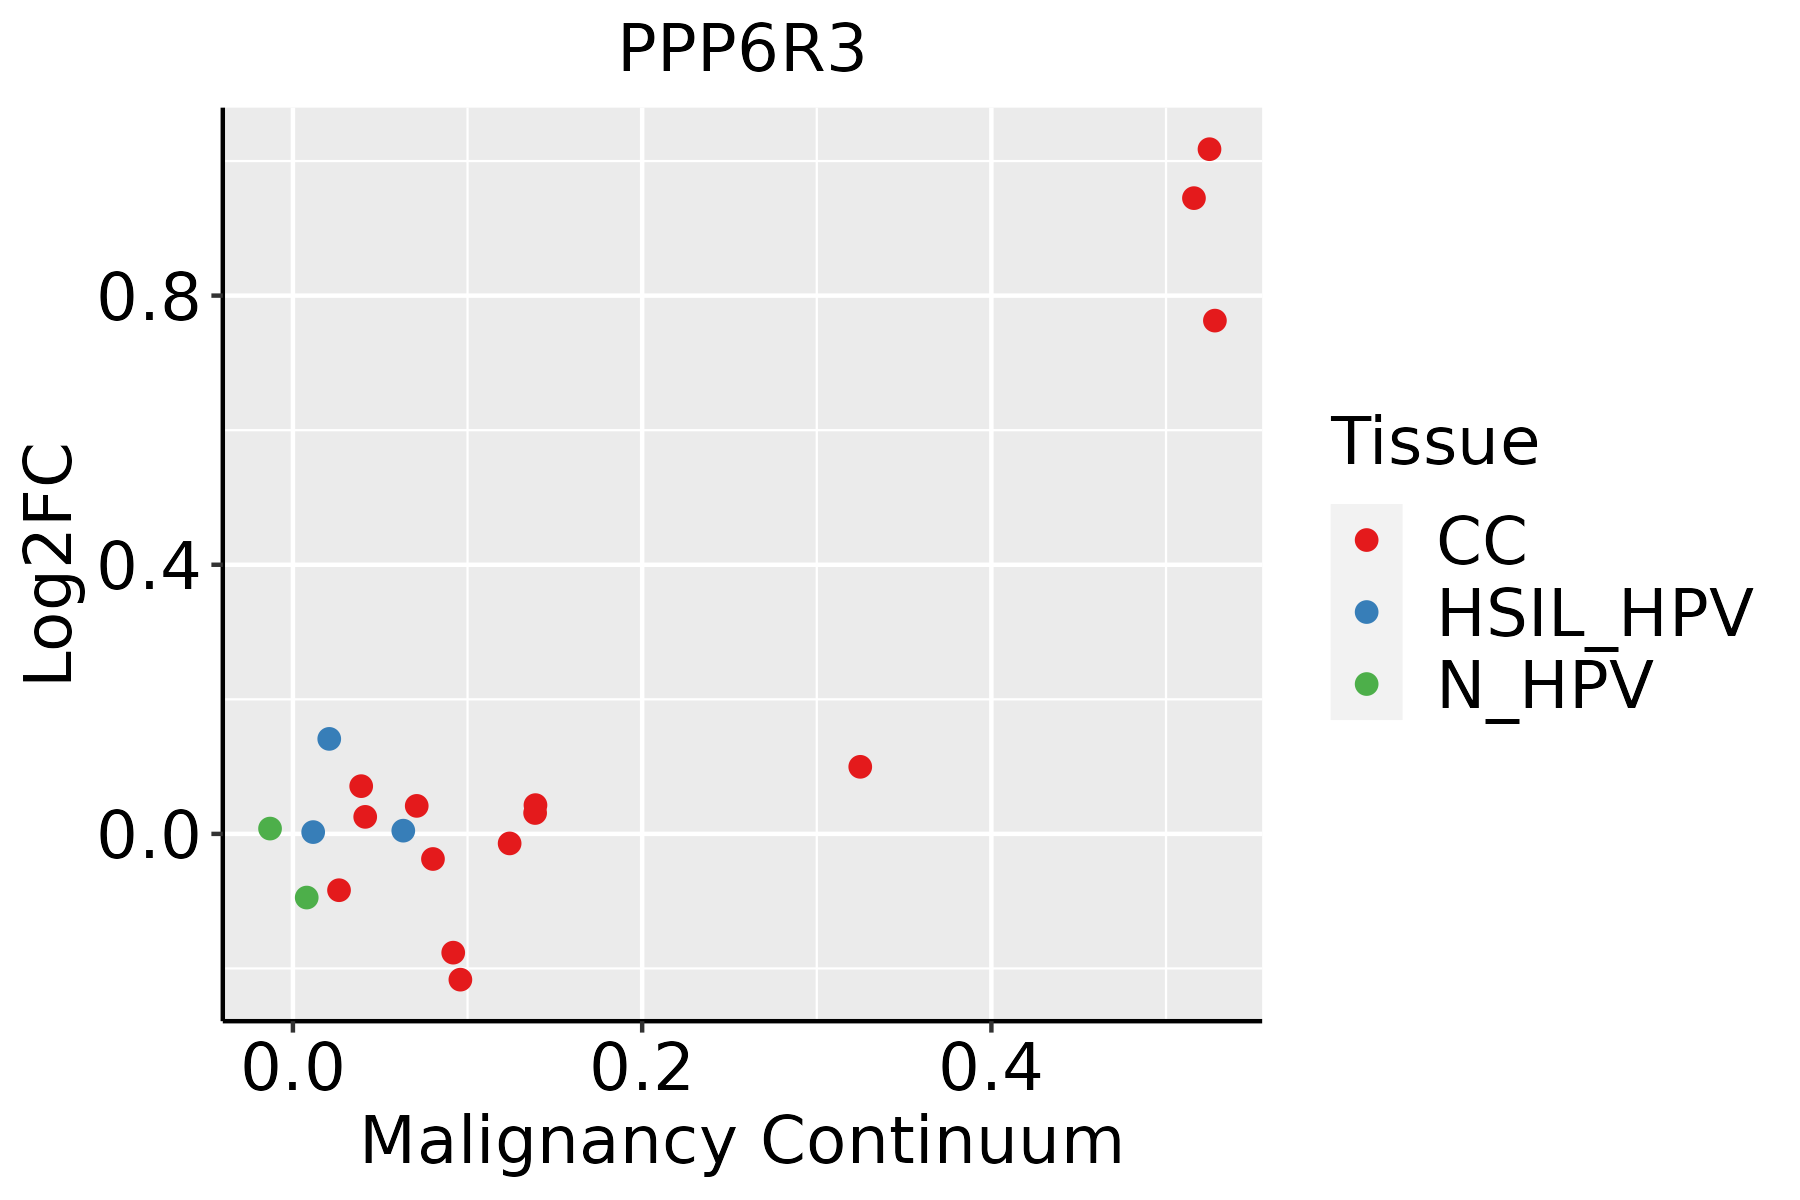 | CC: Cervix cancer |
| HSIL_HPV: HPV-infected high-grade squamous intraepithelial lesions |
| N_HPV: HPV-infected normal cervix |
| Colorectum (GSE201348) | 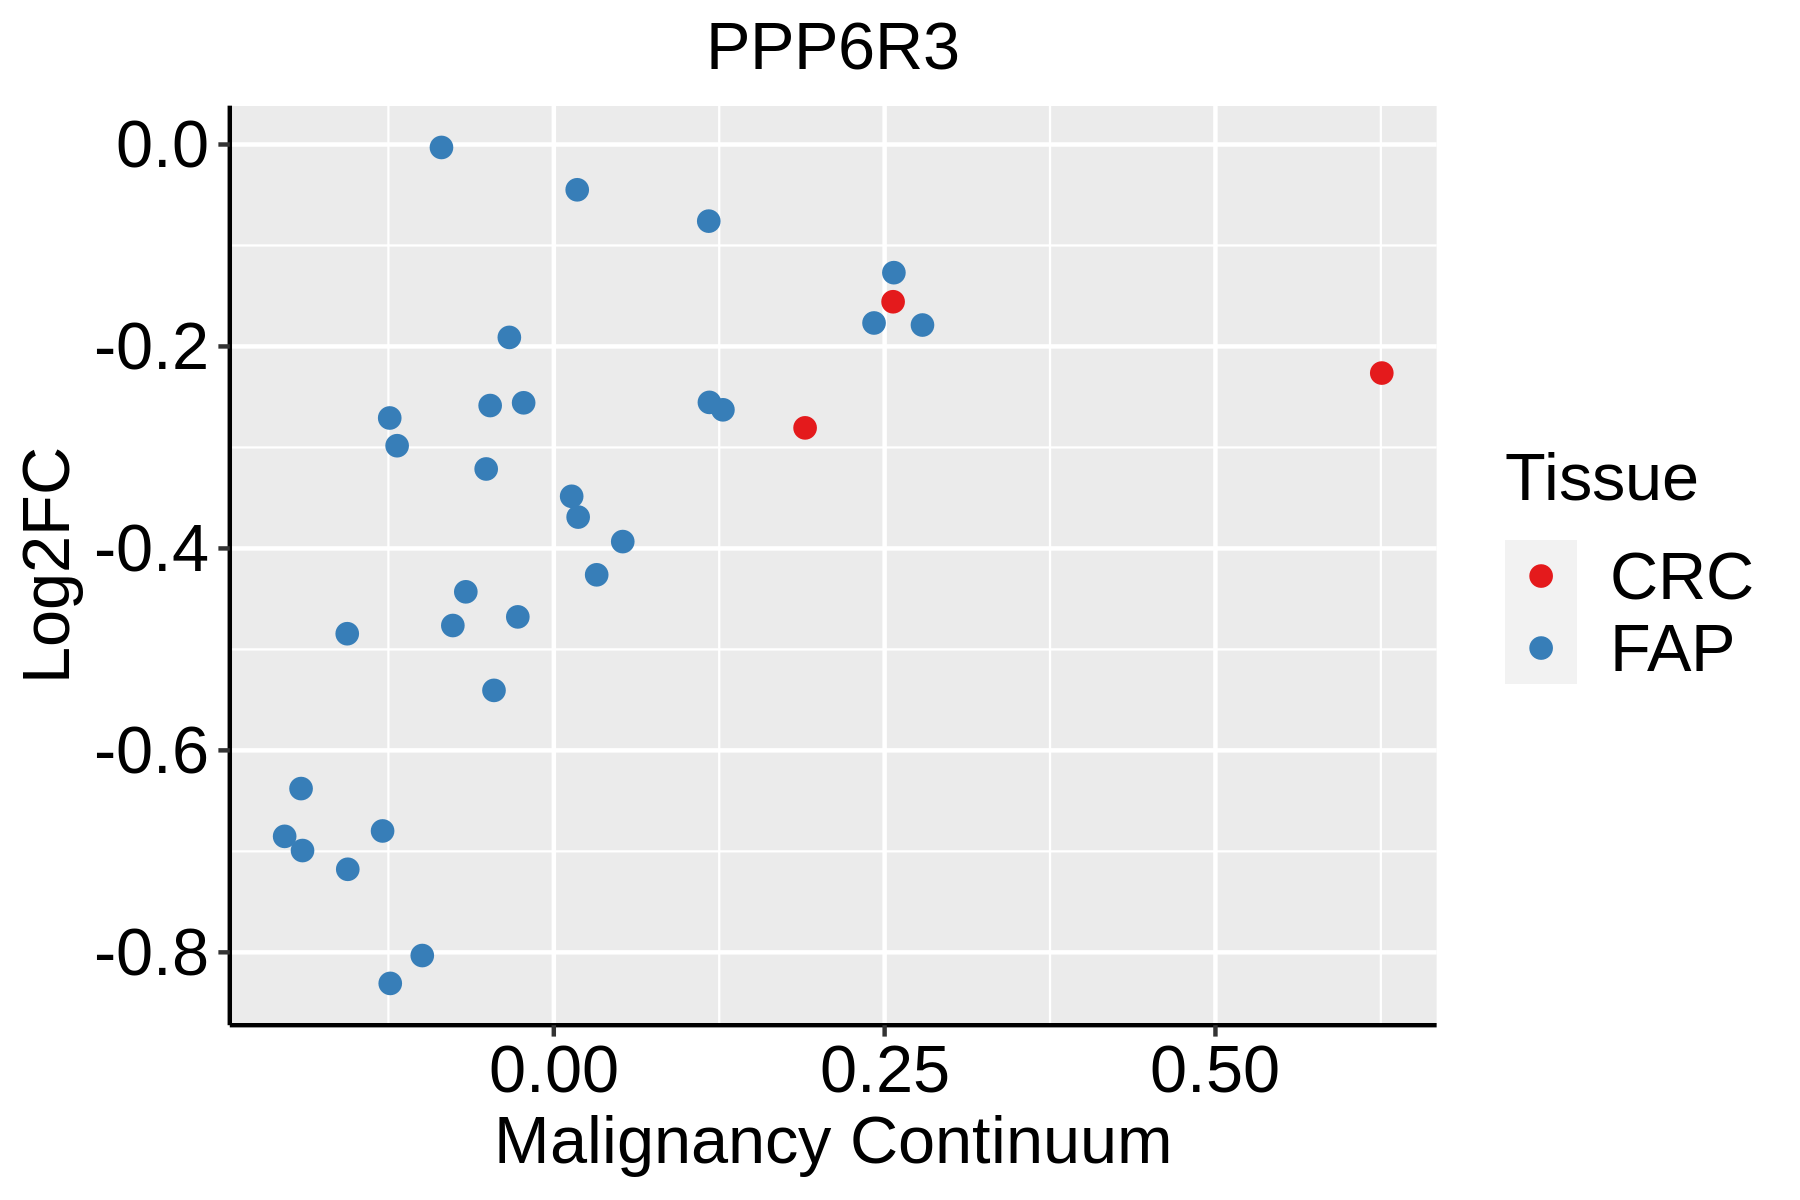 | FAP: Familial adenomatous polyposis |
| CRC: Colorectal cancer |
| Colorectum (HTA11) |  | AD: Adenomas |
| SER: Sessile serrated lesions |
| MSI-H: Microsatellite-high colorectal cancer |
| MSS: Microsatellite stable colorectal cancer |
| Endometrium | 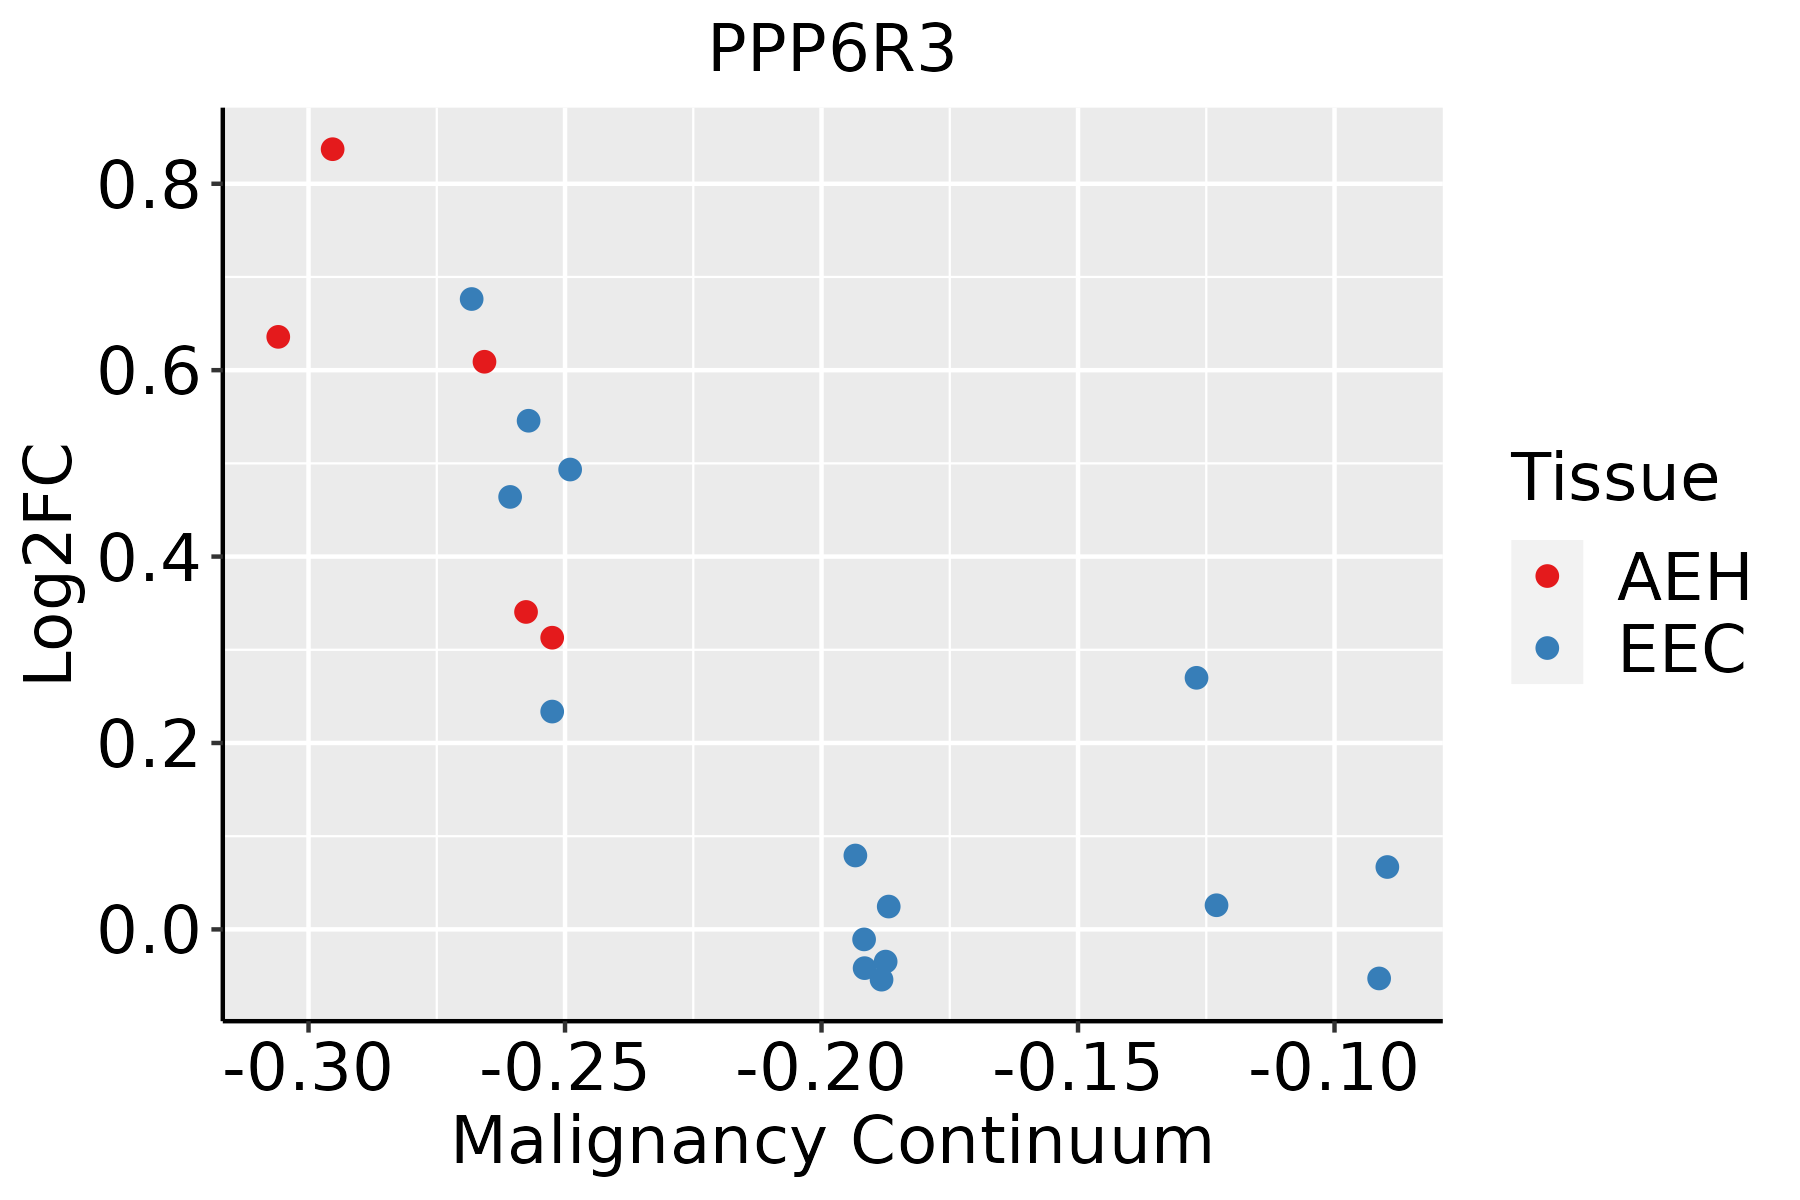 | AEH: Atypical endometrial hyperplasia |
| EEC: Endometrioid Cancer |
| Esophagus |  | ESCC: Esophageal squamous cell carcinoma |
| HGIN: High-grade intraepithelial neoplasias |
| LGIN: Low-grade intraepithelial neoplasias |
| GC |  | CAG: Chronic atrophic gastritis |
| CAG with IM: Chronic atrophic gastritis with intestinal metaplasia |
| CSG: Chronic superficial gastritis |
| GC: Gastric cancer |
| SIM: Severe intestinal metaplasia |
| WIM: Wild intestinal metaplasia |
| Liver | 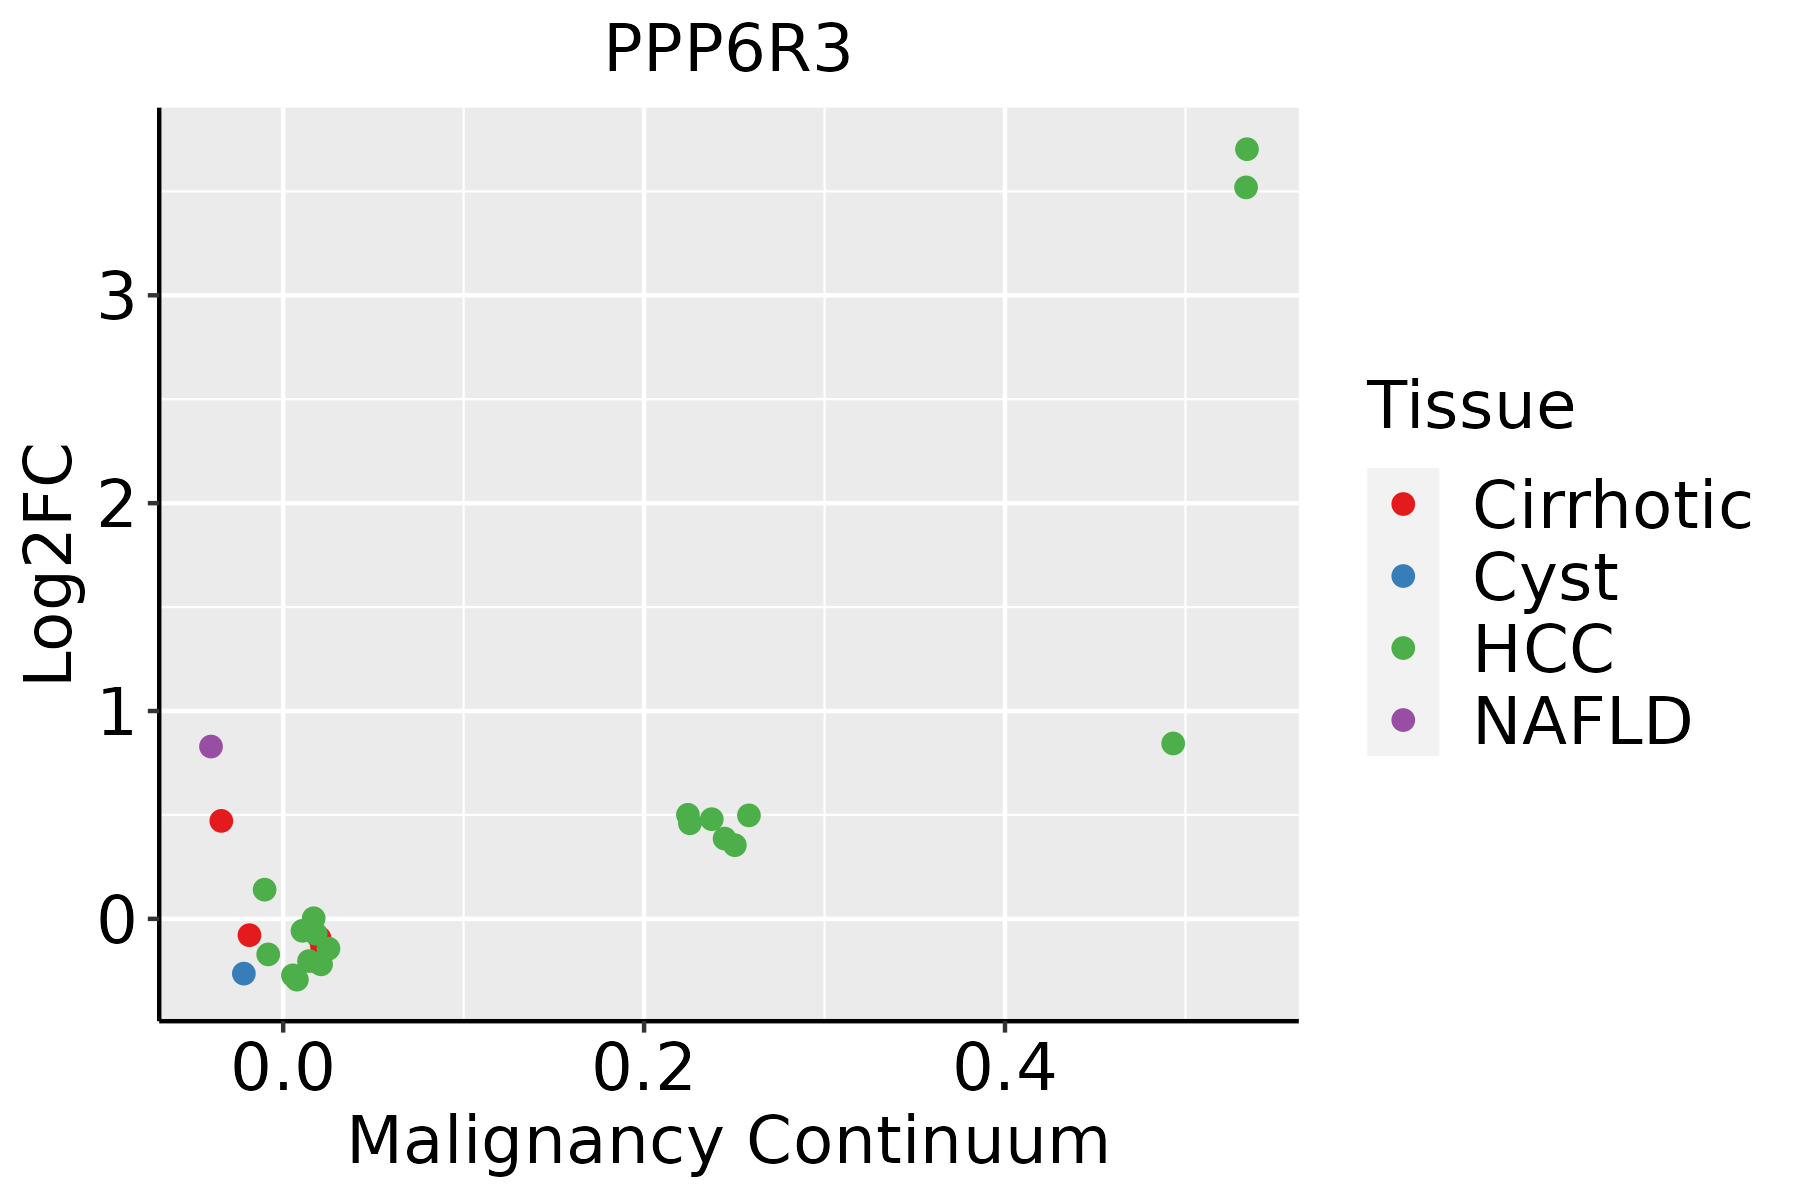 | HCC: Hepatocellular carcinoma |
| NAFLD: Non-alcoholic fatty liver disease |
| Lung |  | AAH: Atypical adenomatous hyperplasia |
| AIS: Adenocarcinoma in situ |
| IAC: Invasive lung adenocarcinoma |
| MIA: Minimally invasive adenocarcinoma |
| Oral Cavity | 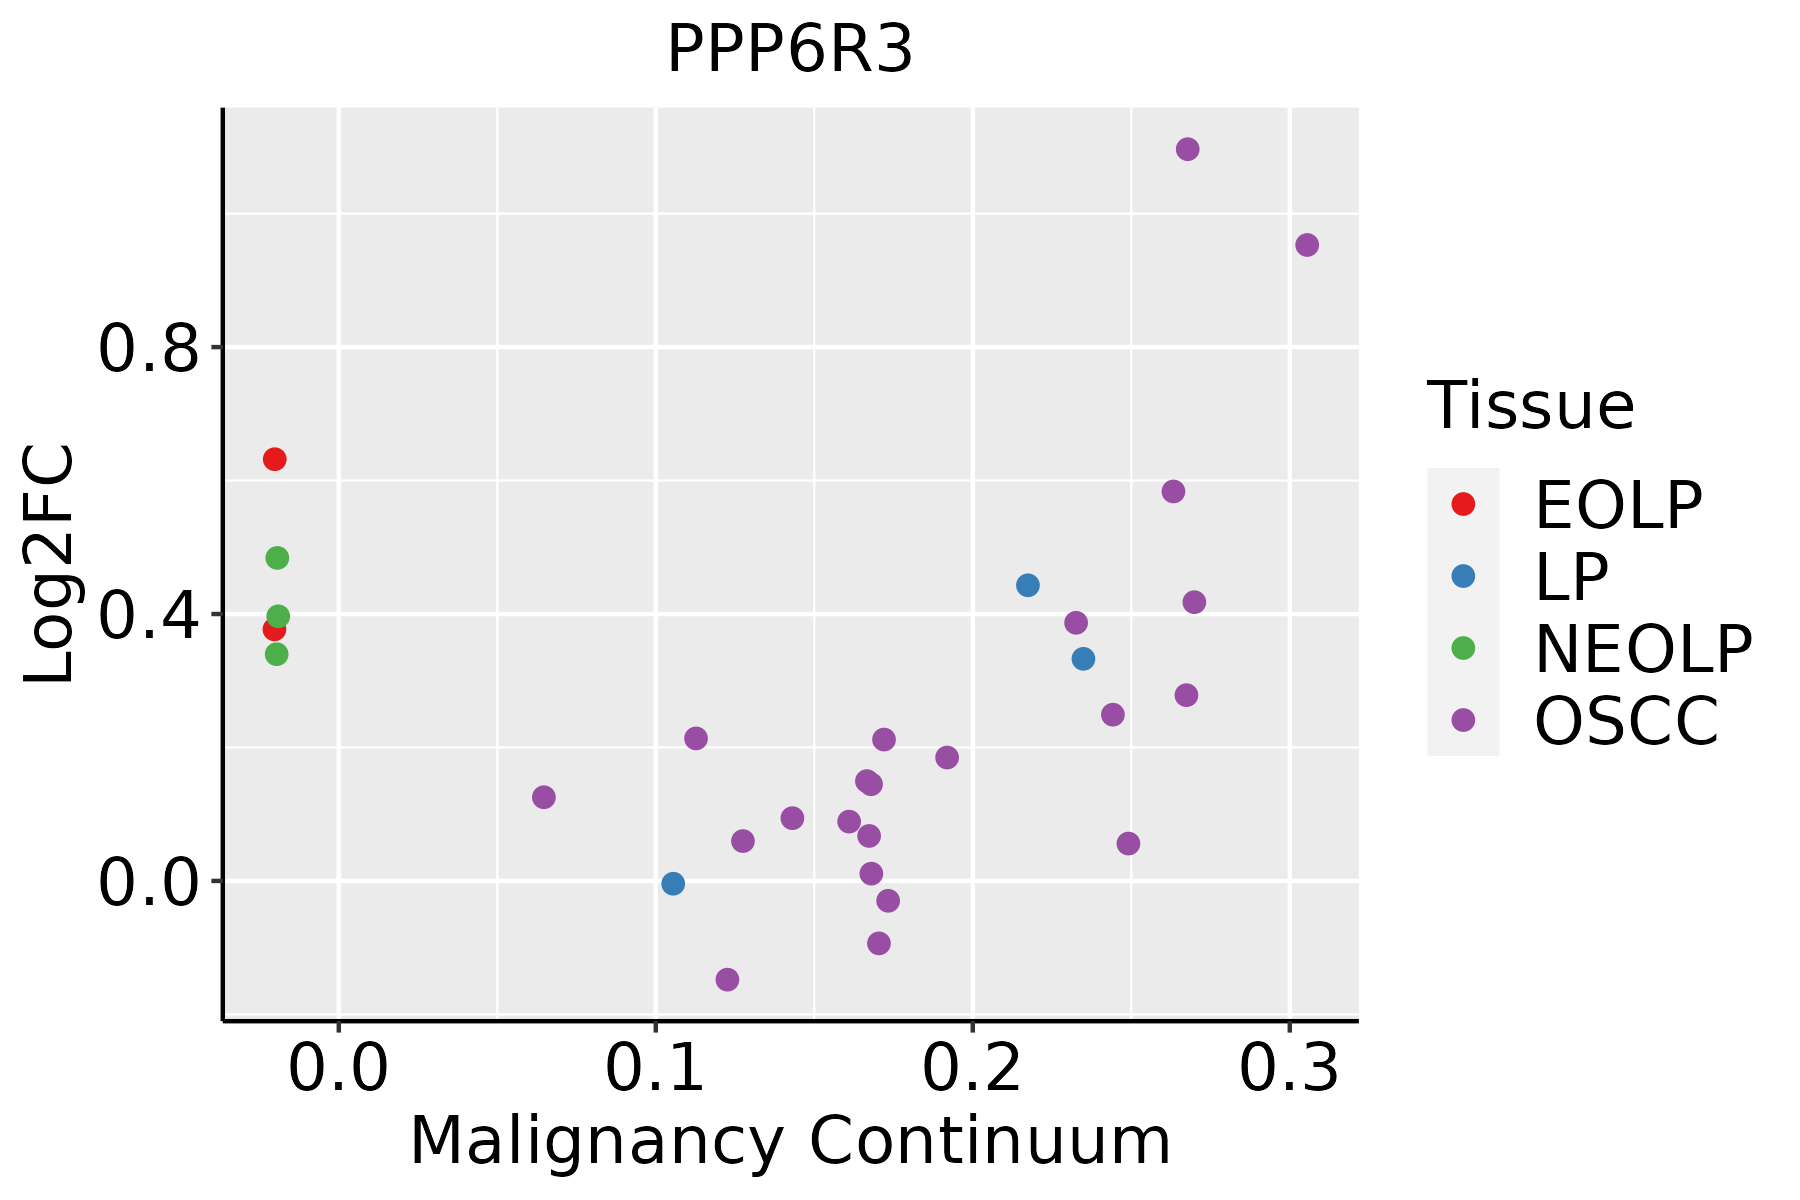 | EOLP: Erosive Oral lichen planus |
| LP: leukoplakia |
| NEOLP: Non-erosive oral lichen planus |
| OSCC: Oral squamous cell carcinoma |
| Prostate | 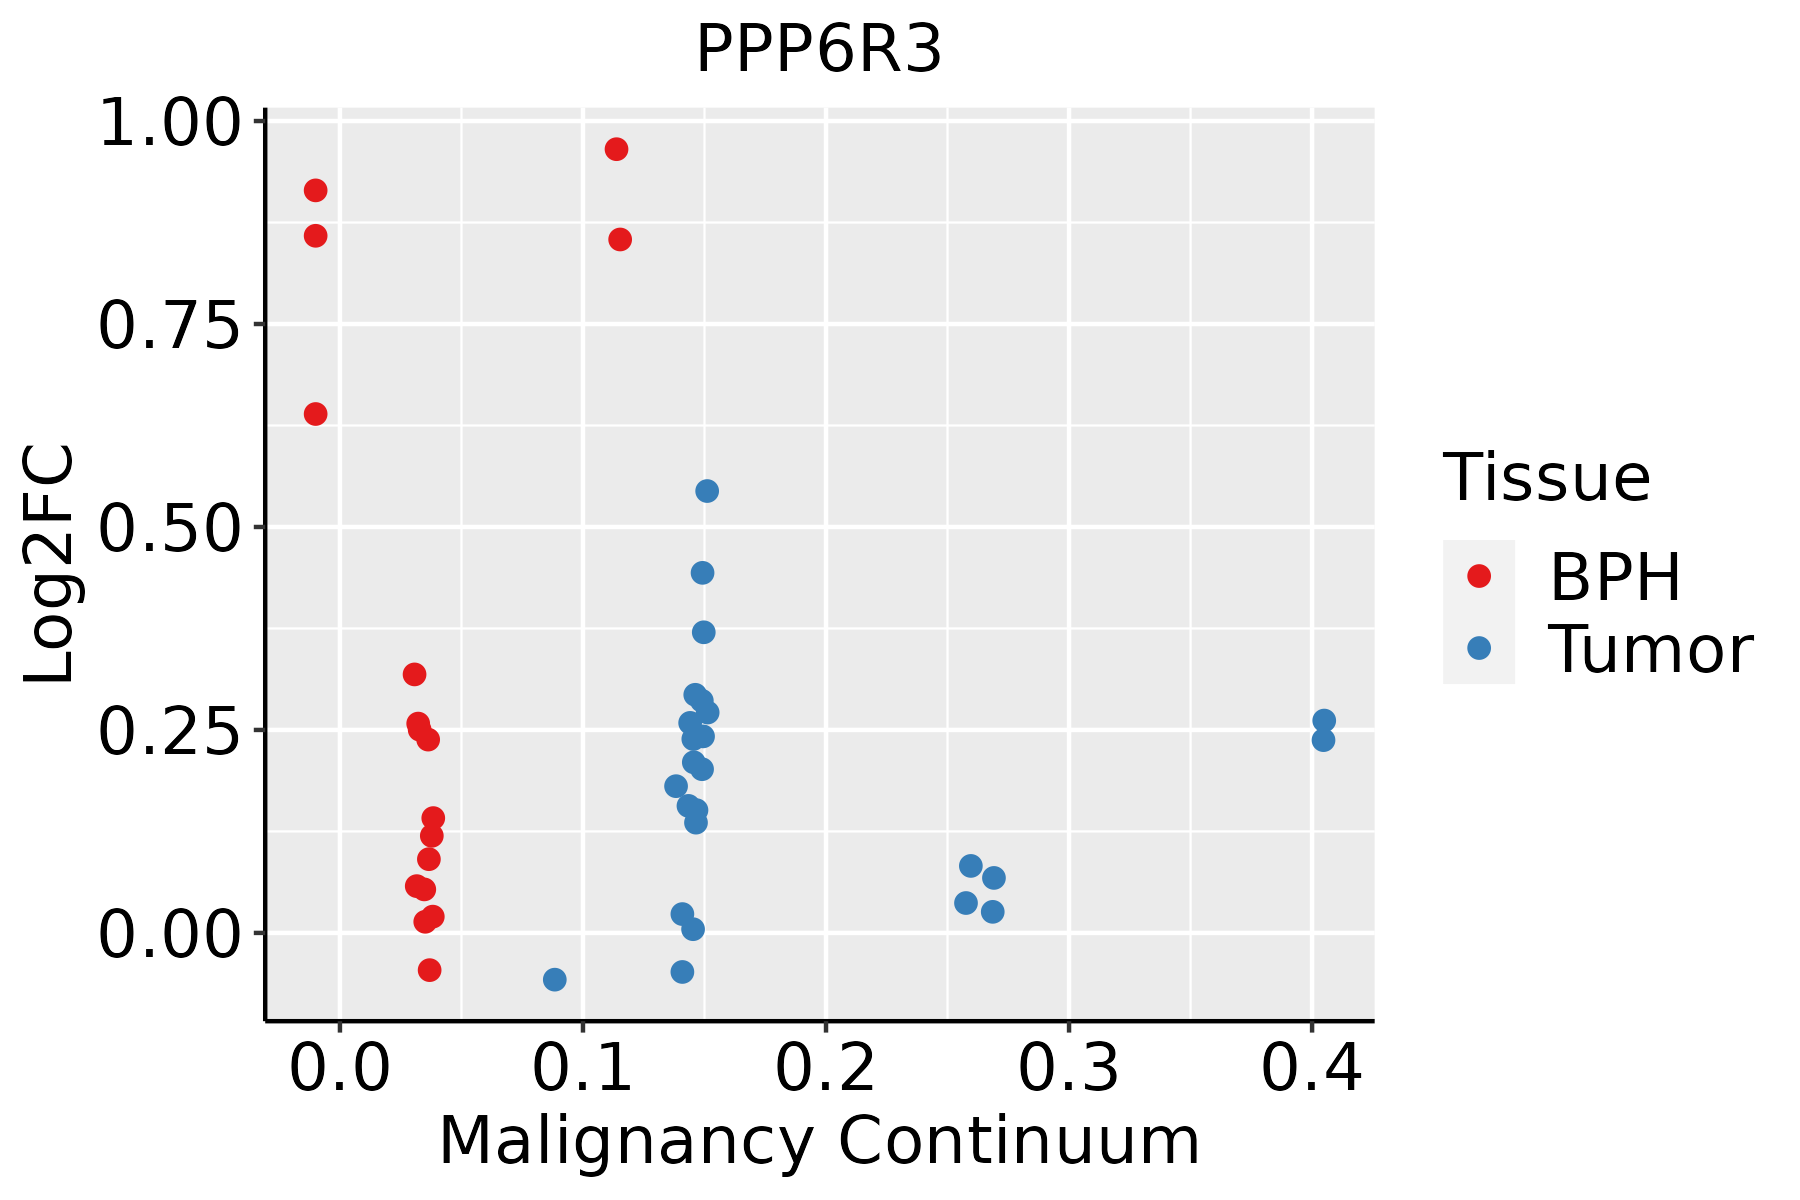 | BPH: Benign Prostatic Hyperplasia |
| Skin | 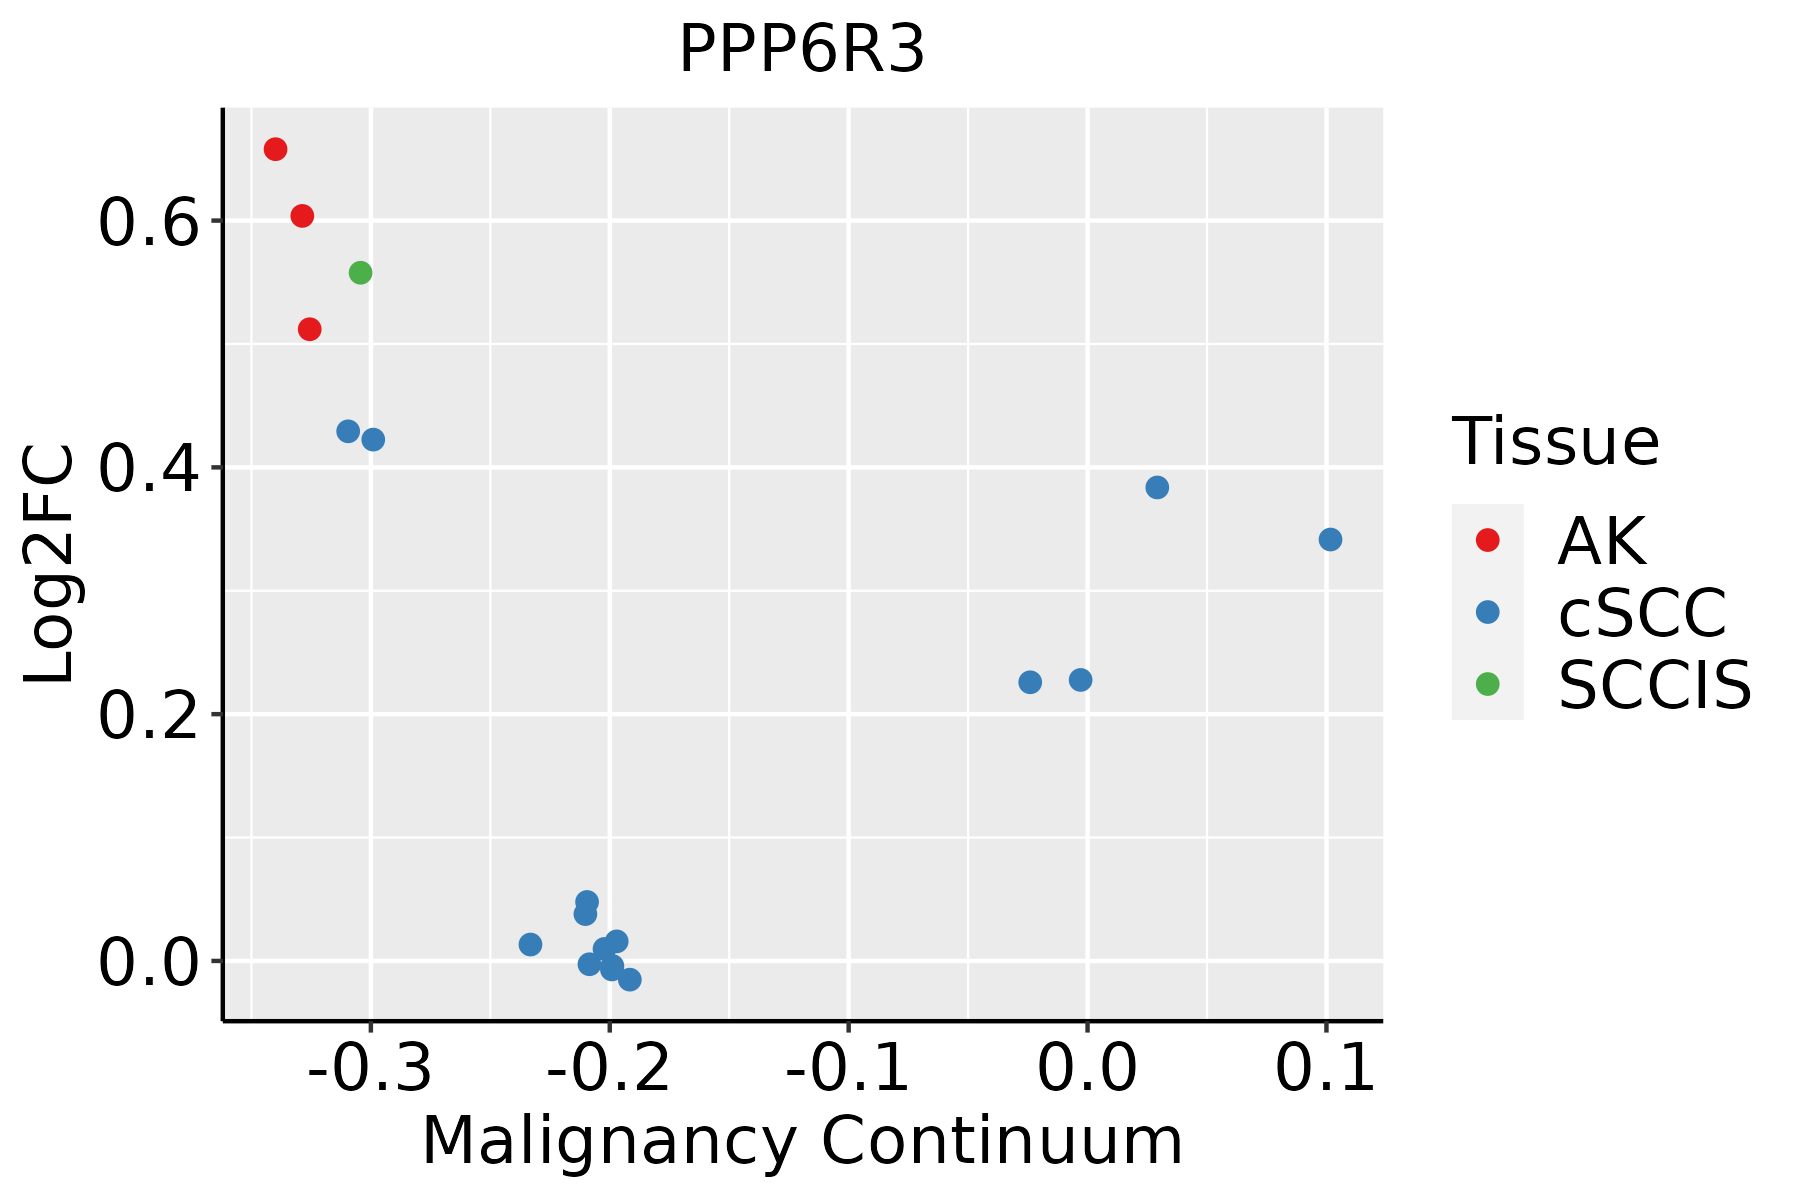 | AK: Actinic keratosis |
| cSCC: Cutaneous squamous cell carcinoma |
| SCCIS:squamous cell carcinoma in situ |
| Thyroid | 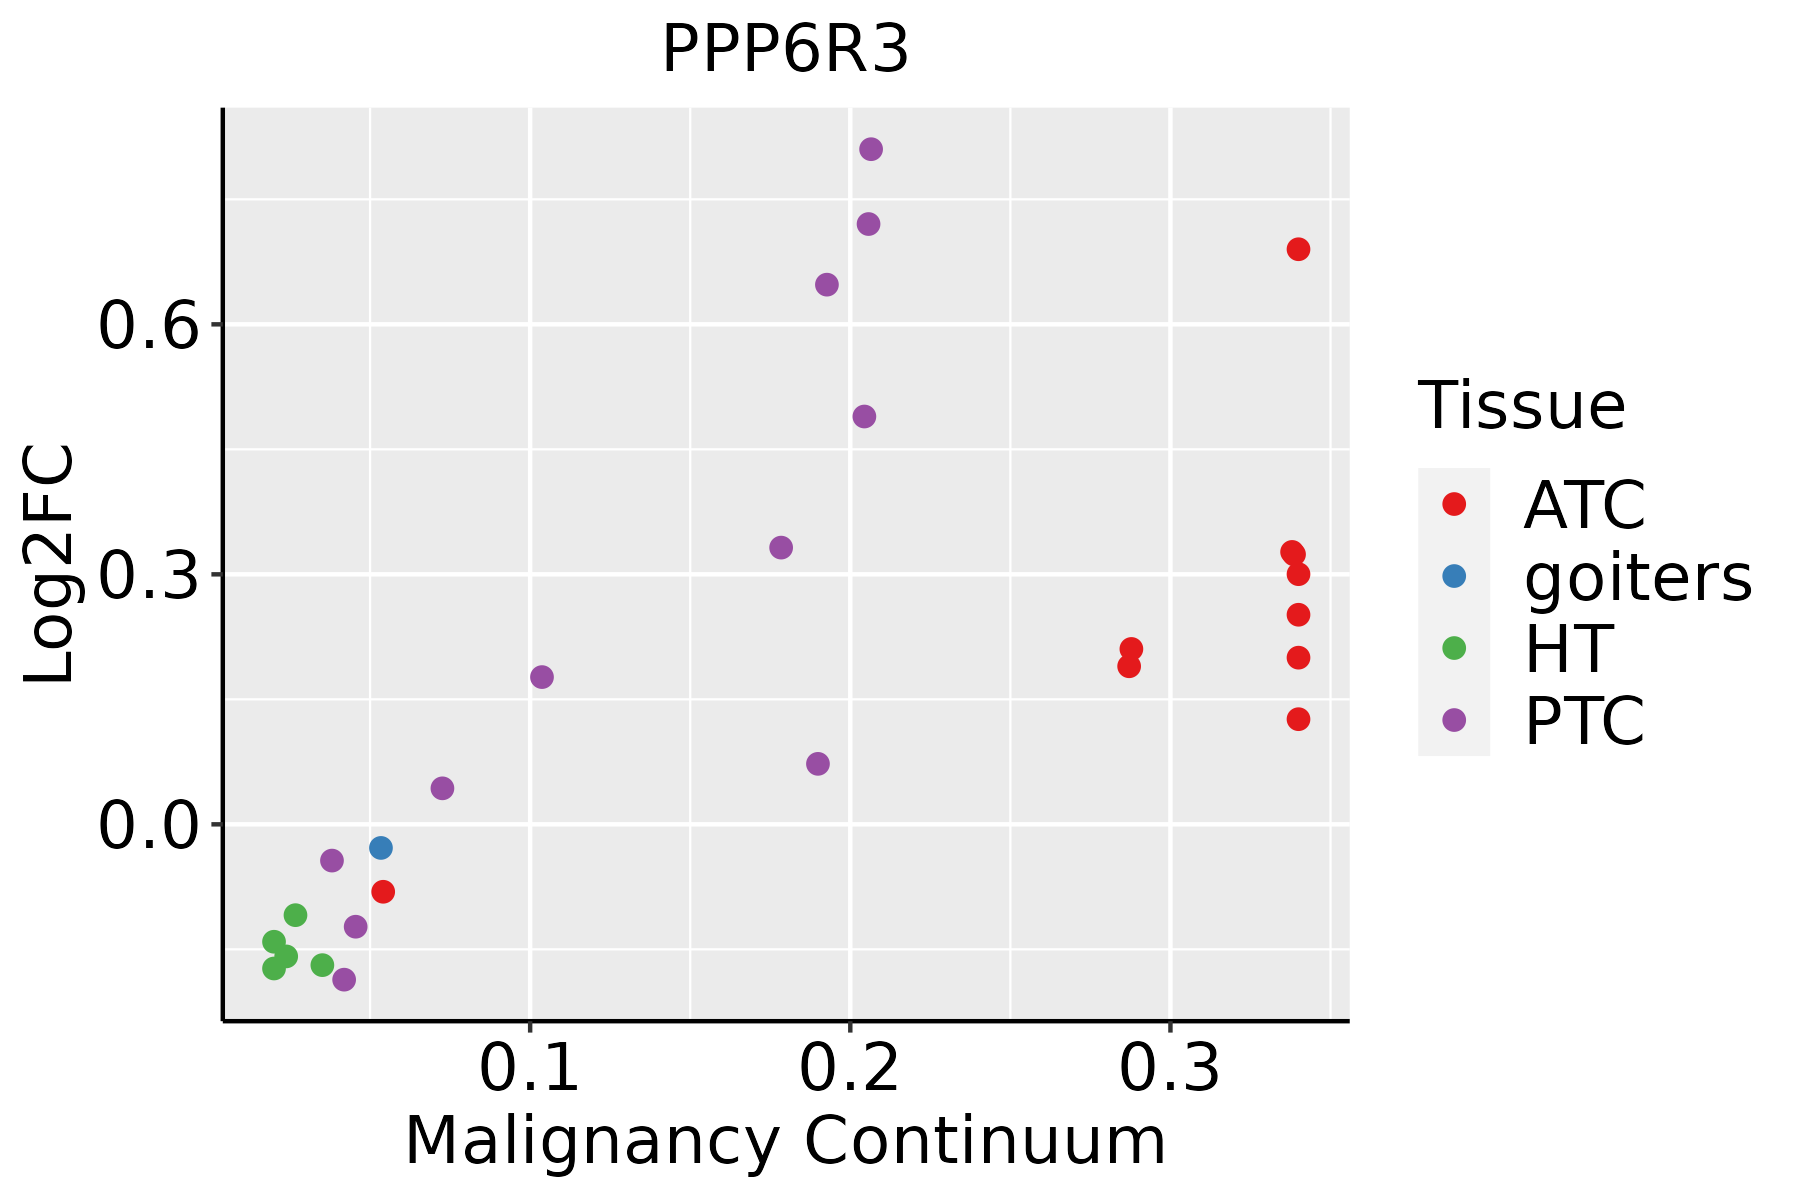 | ATC: Anaplastic thyroid cancer |
| HT: Hashimoto's thyroiditis |
| PTC: Papillary thyroid cancer |
| GO ID | Tissue | Disease Stage | Description | Gene Ratio | Bg Ratio | pvalue | p.adjust | Count |
| GO:00064708 | Cervix | CC | protein dephosphorylation | 60/2311 | 281/18723 | 1.33e-05 | 2.68e-04 | 60 |
| GO:00436668 | Cervix | CC | regulation of phosphoprotein phosphatase activity | 18/2311 | 58/18723 | 1.40e-04 | 1.70e-03 | 18 |
| GO:003530310 | Cervix | CC | regulation of dephosphorylation | 31/2311 | 128/18723 | 1.52e-04 | 1.83e-03 | 31 |
| GO:003530410 | Cervix | CC | regulation of protein dephosphorylation | 24/2311 | 90/18723 | 1.73e-04 | 2.04e-03 | 24 |
| GO:00109218 | Cervix | CC | regulation of phosphatase activity | 22/2311 | 84/18723 | 4.18e-04 | 4.23e-03 | 22 |
| GO:00163117 | Cervix | CC | dephosphorylation | 73/2311 | 417/18723 | 1.23e-03 | 9.87e-03 | 73 |
| GO:0016311 | Colorectum | AD | dephosphorylation | 123/3918 | 417/18723 | 1.84e-05 | 3.82e-04 | 123 |
| GO:0006470 | Colorectum | AD | protein dephosphorylation | 88/3918 | 281/18723 | 2.56e-05 | 4.89e-04 | 88 |
| GO:0035303 | Colorectum | AD | regulation of dephosphorylation | 46/3918 | 128/18723 | 6.20e-05 | 1.04e-03 | 46 |
| GO:0035304 | Colorectum | AD | regulation of protein dephosphorylation | 33/3918 | 90/18723 | 4.23e-04 | 4.77e-03 | 33 |
| GO:0010921 | Colorectum | AD | regulation of phosphatase activity | 30/3918 | 84/18723 | 1.24e-03 | 1.09e-02 | 30 |
| GO:0043666 | Colorectum | AD | regulation of phosphoprotein phosphatase activity | 21/3918 | 58/18723 | 5.25e-03 | 3.47e-02 | 21 |
| GO:00064701 | Colorectum | SER | protein dephosphorylation | 65/2897 | 281/18723 | 4.44e-04 | 6.51e-03 | 65 |
| GO:00109211 | Colorectum | SER | regulation of phosphatase activity | 24/2897 | 84/18723 | 1.61e-03 | 1.71e-02 | 24 |
| GO:00353031 | Colorectum | SER | regulation of dephosphorylation | 33/2897 | 128/18723 | 1.71e-03 | 1.78e-02 | 33 |
| GO:00353041 | Colorectum | SER | regulation of protein dephosphorylation | 25/2897 | 90/18723 | 2.00e-03 | 1.98e-02 | 25 |
| GO:00436661 | Colorectum | SER | regulation of phosphoprotein phosphatase activity | 18/2897 | 58/18723 | 2.18e-03 | 2.11e-02 | 18 |
| GO:00163111 | Colorectum | SER | dephosphorylation | 86/2897 | 417/18723 | 2.73e-03 | 2.46e-02 | 86 |
| GO:00353032 | Colorectum | MSS | regulation of dephosphorylation | 41/3467 | 128/18723 | 1.64e-04 | 2.33e-03 | 41 |
| GO:00353042 | Colorectum | MSS | regulation of protein dephosphorylation | 30/3467 | 90/18723 | 5.58e-04 | 6.19e-03 | 30 |
| Hugo Symbol | Variant Class | Variant Classification | dbSNP RS | HGVSc | HGVSp | HGVSp Short | SWISSPROT | BIOTYPE | SIFT | PolyPhen | Tumor Sample Barcode | Tissue | Histology | Sex | Age | Stage | Therapy Types | Drugs | Outcome |
| PPP6R3 | SNV | Missense_Mutation | novel | c.1552N>C | p.Thr518Pro | p.T518P | Q5H9R7 | protein_coding | deleterious(0.02) | benign(0.022) | TCGA-A2-A0CS-01 | Breast | breast invasive carcinoma | Female | >=65 | III/IV | Hormone Therapy | anastrozole | SD |
| PPP6R3 | SNV | Missense_Mutation | novel | c.1552A>C | p.Thr518Pro | p.T518P | Q5H9R7 | protein_coding | deleterious(0.02) | benign(0.022) | TCGA-A2-A1FW-01 | Breast | breast invasive carcinoma | Female | <65 | III/IV | Chemotherapy | cytoxan | SD |
| PPP6R3 | SNV | Missense_Mutation | novel | c.142C>G | p.Leu48Val | p.L48V | Q5H9R7 | protein_coding | deleterious(0.02) | probably_damaging(0.998) | TCGA-AC-A3BB-01 | Breast | breast invasive carcinoma | Female | <65 | III/IV | Chemotherapy | cytoxan | CR |
| PPP6R3 | SNV | Missense_Mutation | novel | c.260C>T | p.Ser87Phe | p.S87F | Q5H9R7 | protein_coding | deleterious(0) | benign(0.295) | TCGA-AC-A3OD-01 | Breast | breast invasive carcinoma | Female | >=65 | I/II | Unknown | Unknown | SD |
| PPP6R3 | SNV | Missense_Mutation | novel | c.1552A>C | p.Thr518Pro | p.T518P | Q5H9R7 | protein_coding | deleterious(0.02) | benign(0.022) | TCGA-BH-A0W3-01 | Breast | breast invasive carcinoma | Female | <65 | I/II | Unknown | Unknown | SD |
| PPP6R3 | SNV | Missense_Mutation | | c.49C>G | p.Leu17Val | p.L17V | Q5H9R7 | protein_coding | deleterious(0) | probably_damaging(0.998) | TCGA-C8-A12Q-01 | Breast | breast invasive carcinoma | Female | >=65 | III/IV | Unknown | Unknown | PD |
| PPP6R3 | SNV | Missense_Mutation | | c.1831C>A | p.Gln611Lys | p.Q611K | Q5H9R7 | protein_coding | deleterious(0.05) | probably_damaging(0.99) | TCGA-D8-A1JP-01 | Breast | breast invasive carcinoma | Female | >=65 | I/II | Hormone Therapy | tamoxiphen | SD |
| PPP6R3 | SNV | Missense_Mutation | novel | c.1552N>C | p.Thr518Pro | p.T518P | Q5H9R7 | protein_coding | deleterious(0.02) | benign(0.022) | TCGA-E9-A1N5-01 | Breast | breast invasive carcinoma | Female | <65 | I/II | Chemotherapy | doxorubicin | SD |
| PPP6R3 | SNV | Missense_Mutation | novel | c.1552N>C | p.Thr518Pro | p.T518P | Q5H9R7 | protein_coding | deleterious(0.02) | benign(0.022) | TCGA-E9-A22A-01 | Breast | breast invasive carcinoma | Female | >=65 | I/II | Hormone Therapy | tamoxiphen | SD |
| PPP6R3 | insertion | In_Frame_Ins | novel | c.2499_2500insAATCCACACTCT | p.Asp833_Ala834insAsnProHisSer | p.D833_A834insNPHS | Q5H9R7 | protein_coding | | | TCGA-A8-A0A4-01 | Breast | breast invasive carcinoma | Female | >=65 | I/II | Hormone Therapy | tamoxiphen | CR |


