
|
|||||
|
 | |
| |
| |
| |
| |
| |
|
Gene: PPP4R4 |
Gene summary for PPP4R4 |
| Gene information | Species | Human | Gene symbol | PPP4R4 | Gene ID | 57718 |
| Gene name | protein phosphatase 4 regulatory subunit 4 | |
| Gene Alias | CFAP14 | |
| Cytomap | 14q32.12-q32.13 | |
| Gene Type | protein-coding | GO ID | GO:0001701 | UniProtAcc | Q6NUP7 |
Top |
Malignant transformation analysis |
| Identification of the aberrant gene expression in precancerous and cancerous lesions by comparing the gene expression of stem-like cells in diseased tissues with normal stem cells |
| Entrez ID | Symbol | Replicates | Species | Organ | Tissue | Adj P-value | Log2FC | Malignancy |
| 57718 | PPP4R4 | P2T-E | Human | Esophagus | ESCC | 1.46e-28 | 5.28e-01 | 0.1177 |
| 57718 | PPP4R4 | P11T-E | Human | Esophagus | ESCC | 1.23e-16 | 5.50e-01 | 0.1426 |
| 57718 | PPP4R4 | P21T-E | Human | Esophagus | ESCC | 8.40e-04 | 1.26e-01 | 0.1617 |
| 57718 | PPP4R4 | P26T-E | Human | Esophagus | ESCC | 1.59e-30 | 4.49e-01 | 0.1276 |
| 57718 | PPP4R4 | P32T-E | Human | Esophagus | ESCC | 1.62e-13 | 2.93e-01 | 0.1666 |
| 57718 | PPP4R4 | P37T-E | Human | Esophagus | ESCC | 5.61e-25 | 5.45e-01 | 0.1371 |
| 57718 | PPP4R4 | P42T-E | Human | Esophagus | ESCC | 2.62e-05 | 1.86e-01 | 0.1175 |
| 57718 | PPP4R4 | P52T-E | Human | Esophagus | ESCC | 3.60e-13 | 2.18e-01 | 0.1555 |
| 57718 | PPP4R4 | P54T-E | Human | Esophagus | ESCC | 8.22e-14 | 3.35e-01 | 0.0975 |
| 57718 | PPP4R4 | P61T-E | Human | Esophagus | ESCC | 3.11e-12 | 3.12e-01 | 0.099 |
| 57718 | PPP4R4 | P62T-E | Human | Esophagus | ESCC | 1.34e-13 | 2.59e-01 | 0.1302 |
| 57718 | PPP4R4 | P74T-E | Human | Esophagus | ESCC | 3.81e-05 | 1.60e-01 | 0.1479 |
| 57718 | PPP4R4 | P75T-E | Human | Esophagus | ESCC | 1.88e-04 | 1.34e-01 | 0.1125 |
| 57718 | PPP4R4 | P76T-E | Human | Esophagus | ESCC | 9.20e-06 | 2.12e-01 | 0.1207 |
| 57718 | PPP4R4 | P83T-E | Human | Esophagus | ESCC | 5.76e-35 | 9.44e-01 | 0.1738 |
| 57718 | PPP4R4 | P89T-E | Human | Esophagus | ESCC | 6.02e-08 | 4.15e-01 | 0.1752 |
| 57718 | PPP4R4 | P91T-E | Human | Esophagus | ESCC | 1.03e-13 | 1.24e+00 | 0.1828 |
| 57718 | PPP4R4 | P107T-E | Human | Esophagus | ESCC | 6.49e-21 | 4.59e-01 | 0.171 |
| 57718 | PPP4R4 | P126T-E | Human | Esophagus | ESCC | 7.86e-04 | 3.07e-01 | 0.1125 |
| 57718 | PPP4R4 | RNA-P10T2-P10T2-2 | Human | Lung | AAH | 1.57e-02 | 6.73e-01 | -0.1406 |
| Page: 1 2 |
| Tissue | Expression Dynamics | Abbreviation |
| Esophagus | 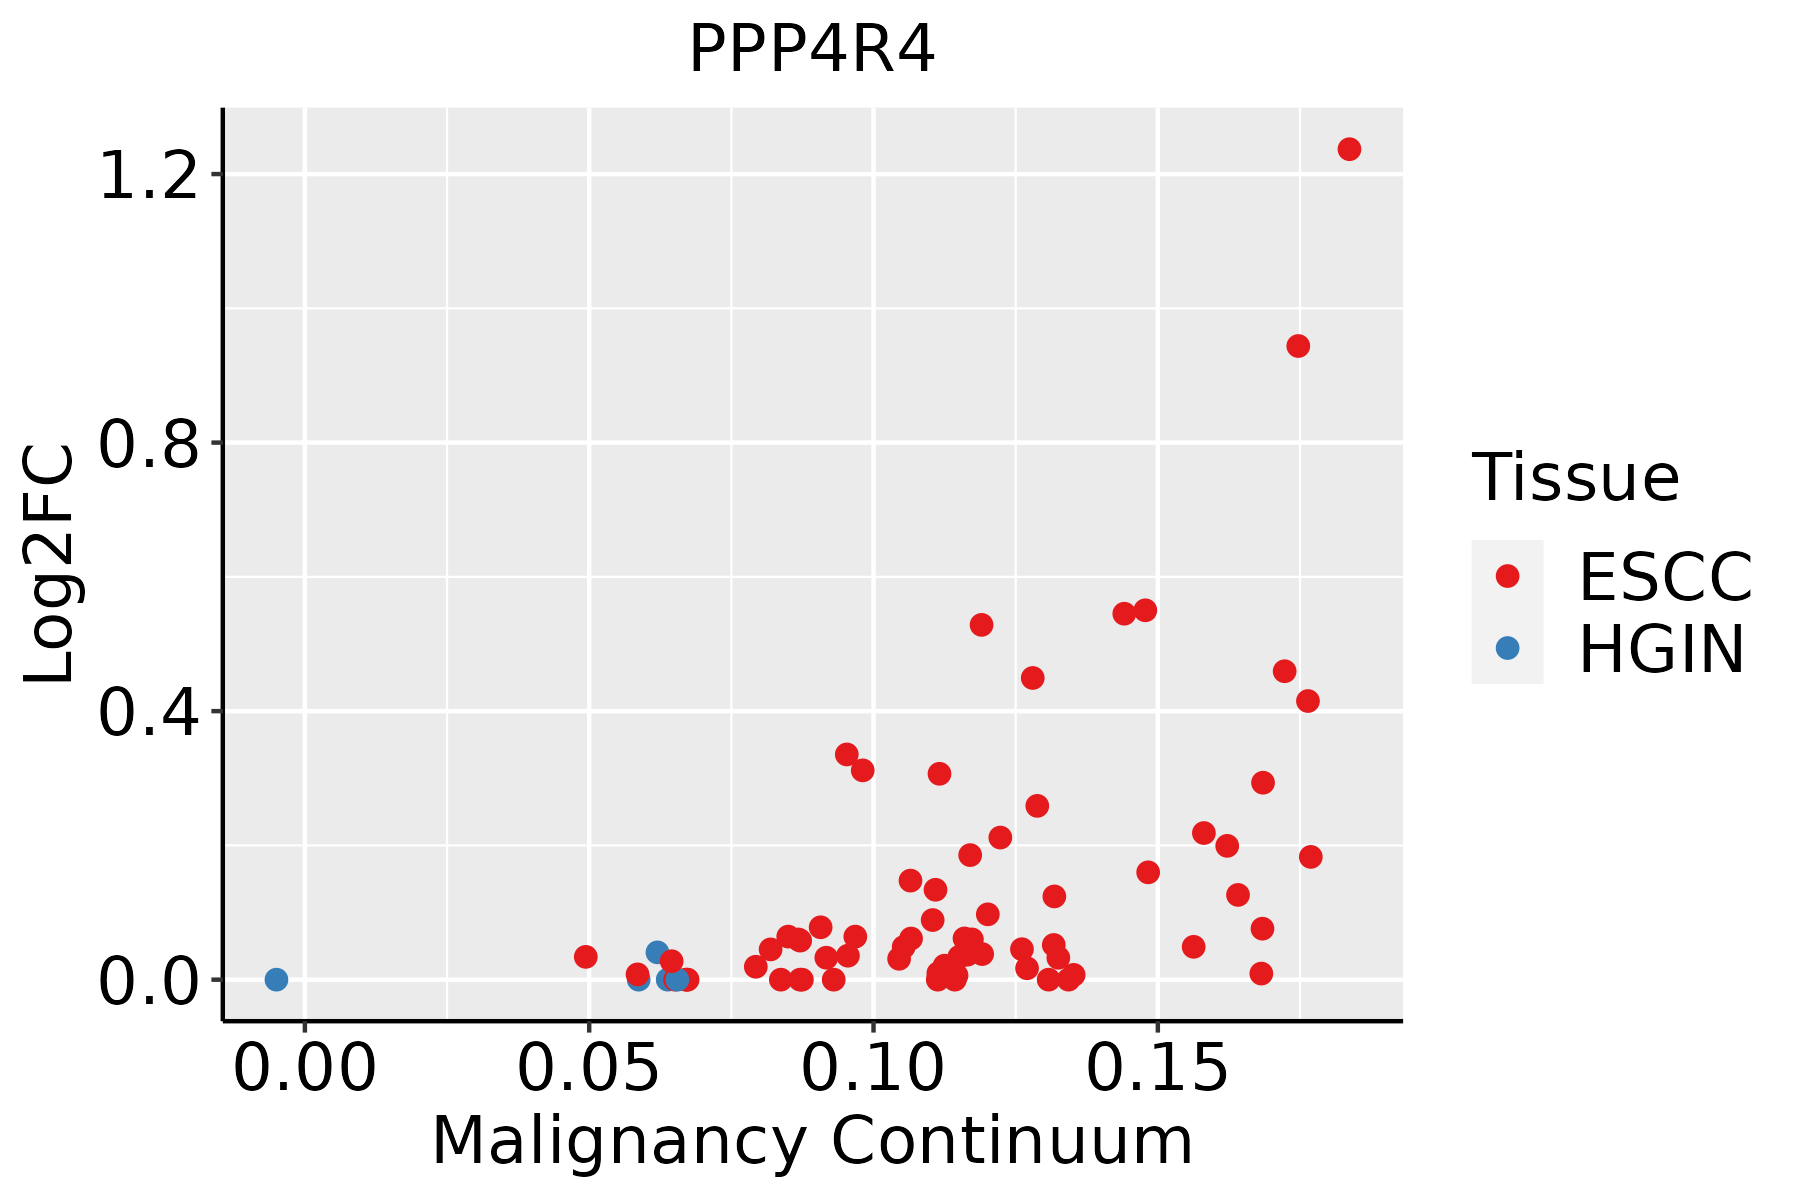 | ESCC: Esophageal squamous cell carcinoma |
| HGIN: High-grade intraepithelial neoplasias | ||
| LGIN: Low-grade intraepithelial neoplasias | ||
| Lung | 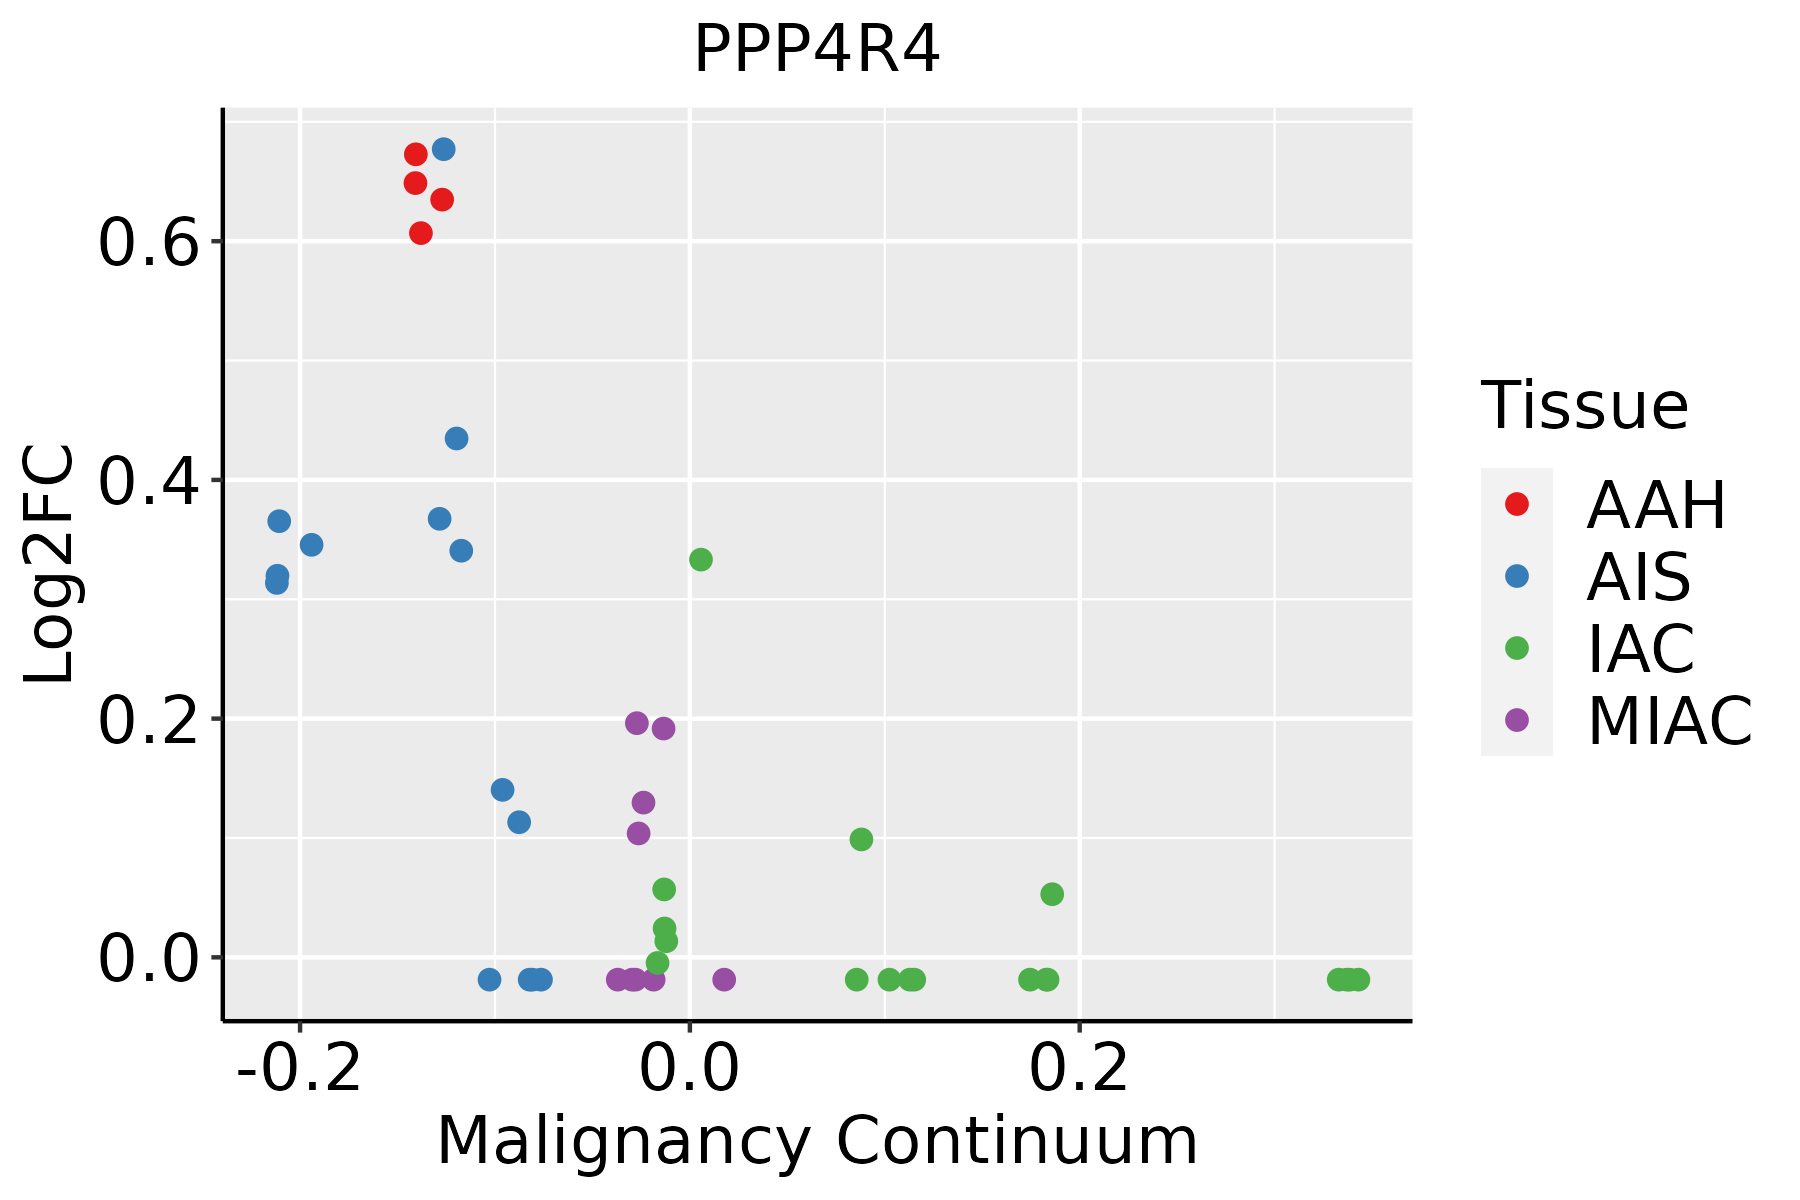 | AAH: Atypical adenomatous hyperplasia |
| AIS: Adenocarcinoma in situ | ||
| IAC: Invasive lung adenocarcinoma | ||
| MIA: Minimally invasive adenocarcinoma | ||
| Prostate |  | BPH: Benign Prostatic Hyperplasia |
| ∗log2FC in expression of this searched gene in stem-like cells from each diseased tissue sample relative to stem-like cells in normal samples in each tissue plotted against the malignancy continuum. Samples are colored based on if they are from different disease stage. |
Top |
Malignant transformation related pathway analysis |
| Find out the enriched GO biological processes and KEGG pathways involved in transition from healthy to precancer to cancer |
| Tissue | Disease Stage | Enriched GO biological Processes |
| Colorectum | AD |  |
| Colorectum | SER |  |
| Colorectum | MSS |  |
| Colorectum | MSI-H |  |
| Colorectum | FAP |  |
| ∗Top 15 enriched GO BP terms are showed in the bar plot of each disease state in each tissue. Each row represents a significant GO biological process which is colored according to the -log10(p.adjust). |
| Page: 1 2 3 4 5 6 7 8 9 |
| GO ID | Tissue | Disease Stage | Description | Gene Ratio | Bg Ratio | pvalue | p.adjust | Count |
| GO:000170119 | Esophagus | ESCC | in utero embryonic development | 243/8552 | 367/18723 | 1.00e-15 | 6.86e-14 | 243 |
| GO:0010563111 | Esophagus | ESCC | negative regulation of phosphorus metabolic process | 274/8552 | 442/18723 | 2.32e-12 | 9.41e-11 | 274 |
| GO:0045936111 | Esophagus | ESCC | negative regulation of phosphate metabolic process | 273/8552 | 441/18723 | 3.18e-12 | 1.25e-10 | 273 |
| GO:001631110 | Esophagus | ESCC | dephosphorylation | 251/8552 | 417/18723 | 1.26e-09 | 2.99e-08 | 251 |
| GO:000647018 | Esophagus | ESCC | protein dephosphorylation | 177/8552 | 281/18723 | 3.13e-09 | 6.72e-08 | 177 |
| GO:0035304111 | Esophagus | ESCC | regulation of protein dephosphorylation | 66/8552 | 90/18723 | 8.82e-08 | 1.48e-06 | 66 |
| GO:0035303111 | Esophagus | ESCC | regulation of dephosphorylation | 88/8552 | 128/18723 | 1.04e-07 | 1.71e-06 | 88 |
| GO:000182412 | Esophagus | ESCC | blastocyst development | 73/8552 | 106/18723 | 1.13e-06 | 1.40e-05 | 73 |
| GO:0051346110 | Esophagus | ESCC | negative regulation of hydrolase activity | 208/8552 | 379/18723 | 1.76e-04 | 1.14e-03 | 208 |
| GO:003530816 | Esophagus | ESCC | negative regulation of protein dephosphorylation | 26/8552 | 34/18723 | 2.53e-04 | 1.55e-03 | 26 |
| GO:0043666110 | Esophagus | ESCC | regulation of phosphoprotein phosphatase activity | 40/8552 | 58/18723 | 2.83e-04 | 1.71e-03 | 40 |
| GO:00353056 | Esophagus | ESCC | negative regulation of dephosphorylation | 31/8552 | 45/18723 | 1.40e-03 | 6.62e-03 | 31 |
| GO:001092115 | Esophagus | ESCC | regulation of phosphatase activity | 52/8552 | 84/18723 | 1.98e-03 | 8.90e-03 | 52 |
| GO:00325155 | Esophagus | ESCC | negative regulation of phosphoprotein phosphatase activity | 19/8552 | 26/18723 | 4.31e-03 | 1.71e-02 | 19 |
| GO:000647012 | Lung | AIS | protein dephosphorylation | 56/1849 | 281/18723 | 2.47e-07 | 2.24e-05 | 56 |
| GO:004593613 | Lung | AIS | negative regulation of phosphate metabolic process | 75/1849 | 441/18723 | 1.93e-06 | 1.12e-04 | 75 |
| GO:001056313 | Lung | AIS | negative regulation of phosphorus metabolic process | 75/1849 | 442/18723 | 2.11e-06 | 1.20e-04 | 75 |
| GO:001631112 | Lung | AIS | dephosphorylation | 69/1849 | 417/18723 | 1.27e-05 | 4.78e-04 | 69 |
| GO:000170112 | Lung | AIS | in utero embryonic development | 59/1849 | 367/18723 | 1.20e-04 | 2.75e-03 | 59 |
| GO:003530313 | Lung | AIS | regulation of dephosphorylation | 25/1849 | 128/18723 | 6.76e-04 | 1.01e-02 | 25 |
| Page: 1 2 3 |
| Pathway ID | Tissue | Disease Stage | Description | Gene Ratio | Bg Ratio | pvalue | p.adjust | qvalue | Count |
| Page: 1 |
Top |
Cell-cell communication analysis |
| Identification of potential cell-cell interactions between two cell types and their ligand-receptor pairs for different disease states |
| Ligand | Receptor | LRpair | Pathway | Tissue | Disease Stage |
| Page: 1 |
Top |
Single-cell gene regulatory network inference analysis |
| Find out the significant the regulons (TFs) and the target genes of each regulon across cell types for different disease states |
| TF | Cell Type | Tissue | Disease Stage | Target Gene | RSS | Regulon Activity |
| ∗The dot plots of a searched regulon are shown for all cell subpopulations in each disease state of each tissue based on the regulon specific score inferred using pySCENIC and by calculating the average expression. |
| Page: 1 |
Top |
Somatic mutation of malignant transformation related genes |
| Annotation of somatic variants for genes involved in malignant transformation |
| Hugo Symbol | Variant Class | Variant Classification | dbSNP RS | HGVSc | HGVSp | HGVSp Short | SWISSPROT | BIOTYPE | SIFT | PolyPhen | Tumor Sample Barcode | Tissue | Histology | Sex | Age | Stage | Therapy Types | Drugs | Outcome |
| PPP4R4 | SNV | Missense_Mutation | c.1002G>C | p.Leu334Phe | p.L334F | Q6NUP7 | protein_coding | tolerated(0.1) | benign(0.042) | TCGA-5L-AAT1-01 | Breast | breast invasive carcinoma | Female | <65 | III/IV | Hormone Therapy | letrozol | SD | |
| PPP4R4 | SNV | Missense_Mutation | novel | c.1471G>A | p.Glu491Lys | p.E491K | Q6NUP7 | protein_coding | deleterious(0) | probably_damaging(0.992) | TCGA-5L-AAT1-01 | Breast | breast invasive carcinoma | Female | <65 | III/IV | Hormone Therapy | letrozol | SD |
| PPP4R4 | SNV | Missense_Mutation | novel | c.2452G>A | p.Asp818Asn | p.D818N | Q6NUP7 | protein_coding | deleterious_low_confidence(0.03) | benign(0.011) | TCGA-5L-AAT1-01 | Breast | breast invasive carcinoma | Female | <65 | III/IV | Hormone Therapy | letrozol | SD |
| PPP4R4 | SNV | Missense_Mutation | c.2513N>C | p.Leu838Ser | p.L838S | Q6NUP7 | protein_coding | tolerated_low_confidence(0.28) | benign(0.241) | TCGA-A2-A0SW-01 | Breast | breast invasive carcinoma | Female | >=65 | III/IV | Hormone Therapy | arimidex | PD | |
| PPP4R4 | SNV | Missense_Mutation | c.1351N>T | p.Asp451Tyr | p.D451Y | Q6NUP7 | protein_coding | deleterious(0) | possibly_damaging(0.846) | TCGA-AN-A046-01 | Breast | breast invasive carcinoma | Female | >=65 | I/II | Unknown | Unknown | SD | |
| PPP4R4 | SNV | Missense_Mutation | novel | c.2427N>T | p.Lys809Asn | p.K809N | Q6NUP7 | protein_coding | deleterious_low_confidence(0) | possibly_damaging(0.526) | TCGA-AN-A046-01 | Breast | breast invasive carcinoma | Female | >=65 | I/II | Unknown | Unknown | SD |
| PPP4R4 | SNV | Missense_Mutation | novel | c.1384G>A | p.Glu462Lys | p.E462K | Q6NUP7 | protein_coding | tolerated(0.07) | possibly_damaging(0.595) | TCGA-BH-A18P-01 | Breast | breast invasive carcinoma | Female | <65 | I/II | Unknown | Unknown | PD |
| PPP4R4 | SNV | Missense_Mutation | rs759244525 | c.1754N>A | p.Arg585Gln | p.R585Q | Q6NUP7 | protein_coding | tolerated(0.2) | possibly_damaging(0.78) | TCGA-BH-A1FC-01 | Breast | breast invasive carcinoma | Female | >=65 | I/II | Unknown | Unknown | SD |
| PPP4R4 | SNV | Missense_Mutation | c.2506A>G | p.Thr836Ala | p.T836A | Q6NUP7 | protein_coding | tolerated_low_confidence(0.24) | benign(0) | TCGA-BH-A1FU-01 | Breast | breast invasive carcinoma | Female | <65 | I/II | Unknown | Unknown | PD | |
| PPP4R4 | SNV | Missense_Mutation | c.1822N>G | p.Leu608Val | p.L608V | Q6NUP7 | protein_coding | tolerated(1) | benign(0.111) | TCGA-E2-A1IN-01 | Breast | breast invasive carcinoma | Female | <65 | I/II | Hormone Therapy | arimidex | SD |
| Page: 1 2 3 4 5 6 7 8 9 10 11 |
Top |
Related drugs of malignant transformation related genes |
| Identification of chemicals and drugs interact with genes involved in malignant transfromation |
| (DGIdb 4.0) |
| Entrez ID | Symbol | Category | Interaction Types | Drug Claim Name | Drug Name | PMIDs |
| Page: 1 |

Copyright 2023-Present -The University of Texas Health Science Center at Houston |