
|
|||||
|
 | |
| |
| |
| |
| |
| |
|
Gene: PPP4R3A |
Gene summary for PPP4R3A |
| Gene information | Species | Human | Gene symbol | PPP4R3A | Gene ID | 55671 |
| Gene name | protein phosphatase 4 regulatory subunit 3A | |
| Gene Alias | FLFL1 | |
| Cytomap | 14q32.12 | |
| Gene Type | protein-coding | GO ID | GO:0005575 | UniProtAcc | A0A024R6M2 |
Top |
Malignant transformation analysis |
| Identification of the aberrant gene expression in precancerous and cancerous lesions by comparing the gene expression of stem-like cells in diseased tissues with normal stem cells |
| Entrez ID | Symbol | Replicates | Species | Organ | Tissue | Adj P-value | Log2FC | Malignancy |
| 55671 | PPP4R3A | LZE4T | Human | Esophagus | ESCC | 1.06e-09 | 2.82e-01 | 0.0811 |
| 55671 | PPP4R3A | LZE5T | Human | Esophagus | ESCC | 2.96e-05 | 5.08e-01 | 0.0514 |
| 55671 | PPP4R3A | LZE7T | Human | Esophagus | ESCC | 2.15e-07 | 1.75e-01 | 0.0667 |
| 55671 | PPP4R3A | LZE8T | Human | Esophagus | ESCC | 2.04e-09 | 1.68e-01 | 0.067 |
| 55671 | PPP4R3A | LZE20T | Human | Esophagus | ESCC | 6.67e-18 | 4.26e-01 | 0.0662 |
| 55671 | PPP4R3A | LZE22T | Human | Esophagus | ESCC | 3.90e-03 | 9.98e-02 | 0.068 |
| 55671 | PPP4R3A | LZE24T | Human | Esophagus | ESCC | 5.10e-09 | 4.36e-01 | 0.0596 |
| 55671 | PPP4R3A | LZE21T | Human | Esophagus | ESCC | 2.01e-04 | 9.12e-02 | 0.0655 |
| 55671 | PPP4R3A | LZE6T | Human | Esophagus | ESCC | 2.96e-02 | 1.15e-02 | 0.0845 |
| 55671 | PPP4R3A | P1T-E | Human | Esophagus | ESCC | 1.56e-03 | 1.05e-01 | 0.0875 |
| 55671 | PPP4R3A | P2T-E | Human | Esophagus | ESCC | 3.16e-20 | 3.91e-01 | 0.1177 |
| 55671 | PPP4R3A | P4T-E | Human | Esophagus | ESCC | 5.78e-18 | 4.73e-01 | 0.1323 |
| 55671 | PPP4R3A | P5T-E | Human | Esophagus | ESCC | 8.95e-21 | 2.19e-01 | 0.1327 |
| 55671 | PPP4R3A | P8T-E | Human | Esophagus | ESCC | 2.67e-26 | 4.91e-01 | 0.0889 |
| 55671 | PPP4R3A | P9T-E | Human | Esophagus | ESCC | 5.01e-18 | 1.88e-01 | 0.1131 |
| 55671 | PPP4R3A | P10T-E | Human | Esophagus | ESCC | 8.86e-33 | 7.76e-01 | 0.116 |
| 55671 | PPP4R3A | P11T-E | Human | Esophagus | ESCC | 8.49e-12 | 3.18e-01 | 0.1426 |
| 55671 | PPP4R3A | P12T-E | Human | Esophagus | ESCC | 4.78e-34 | 6.68e-01 | 0.1122 |
| 55671 | PPP4R3A | P15T-E | Human | Esophagus | ESCC | 3.36e-34 | 8.85e-01 | 0.1149 |
| 55671 | PPP4R3A | P16T-E | Human | Esophagus | ESCC | 1.34e-20 | 1.92e-01 | 0.1153 |
| Page: 1 2 3 4 5 6 |
| Tissue | Expression Dynamics | Abbreviation |
| Esophagus | 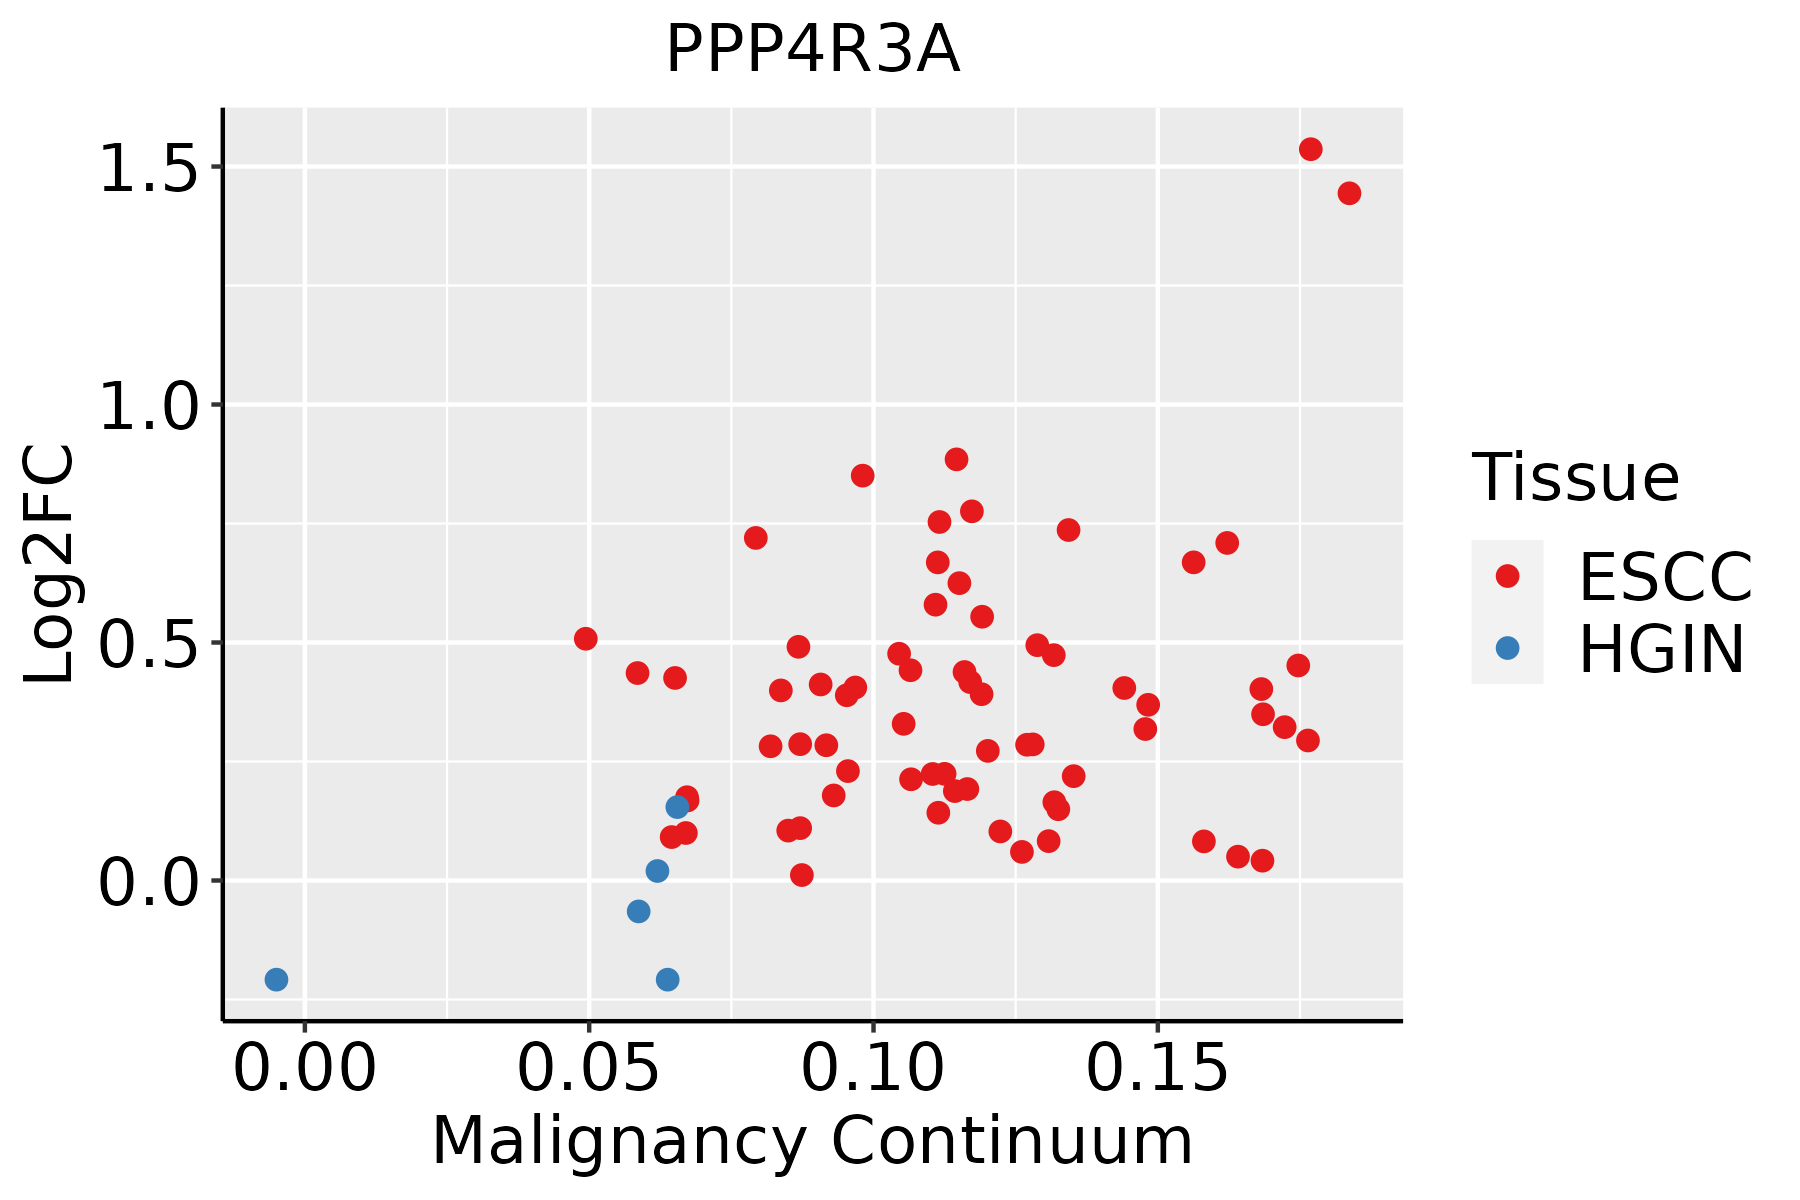 | ESCC: Esophageal squamous cell carcinoma |
| HGIN: High-grade intraepithelial neoplasias | ||
| LGIN: Low-grade intraepithelial neoplasias | ||
| Liver | 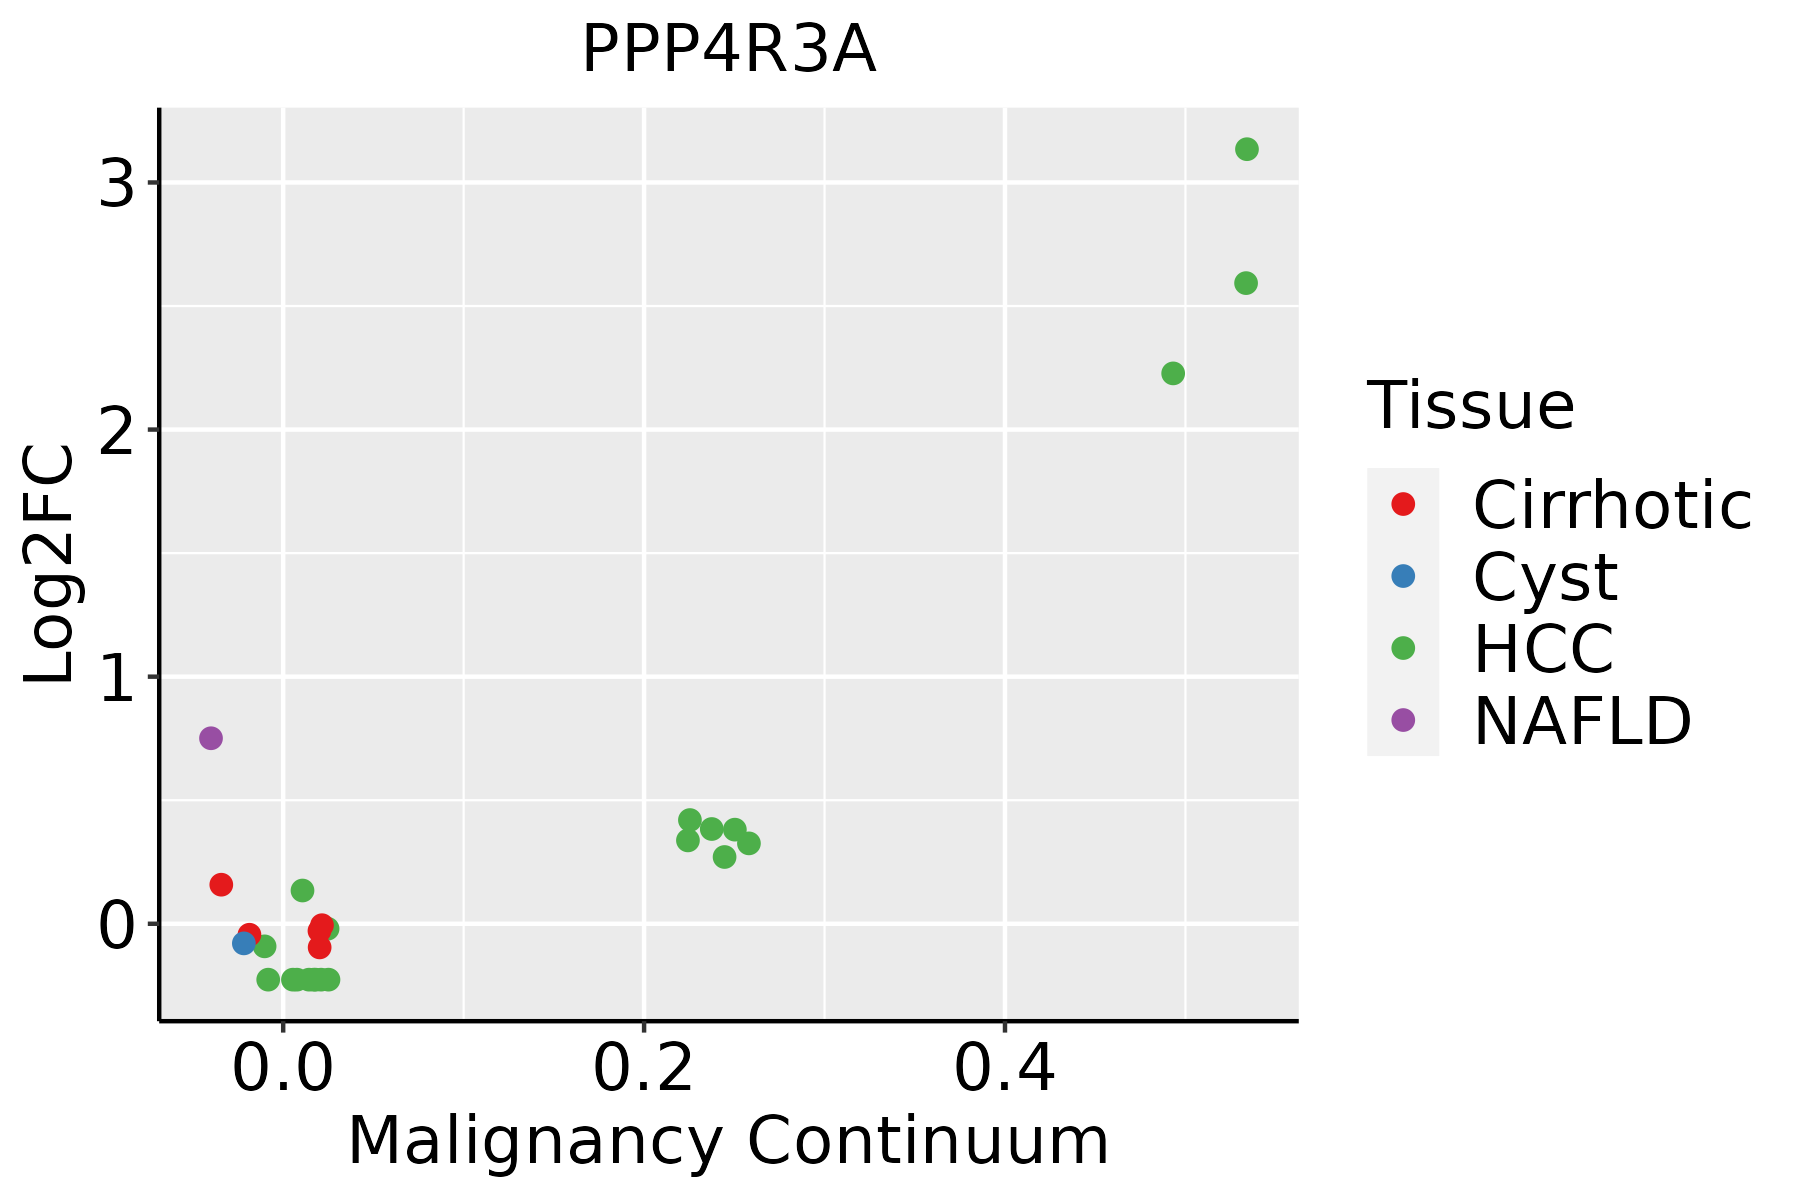 | HCC: Hepatocellular carcinoma |
| NAFLD: Non-alcoholic fatty liver disease | ||
| Oral Cavity |  | EOLP: Erosive Oral lichen planus |
| LP: leukoplakia | ||
| NEOLP: Non-erosive oral lichen planus | ||
| OSCC: Oral squamous cell carcinoma | ||
| Thyroid | 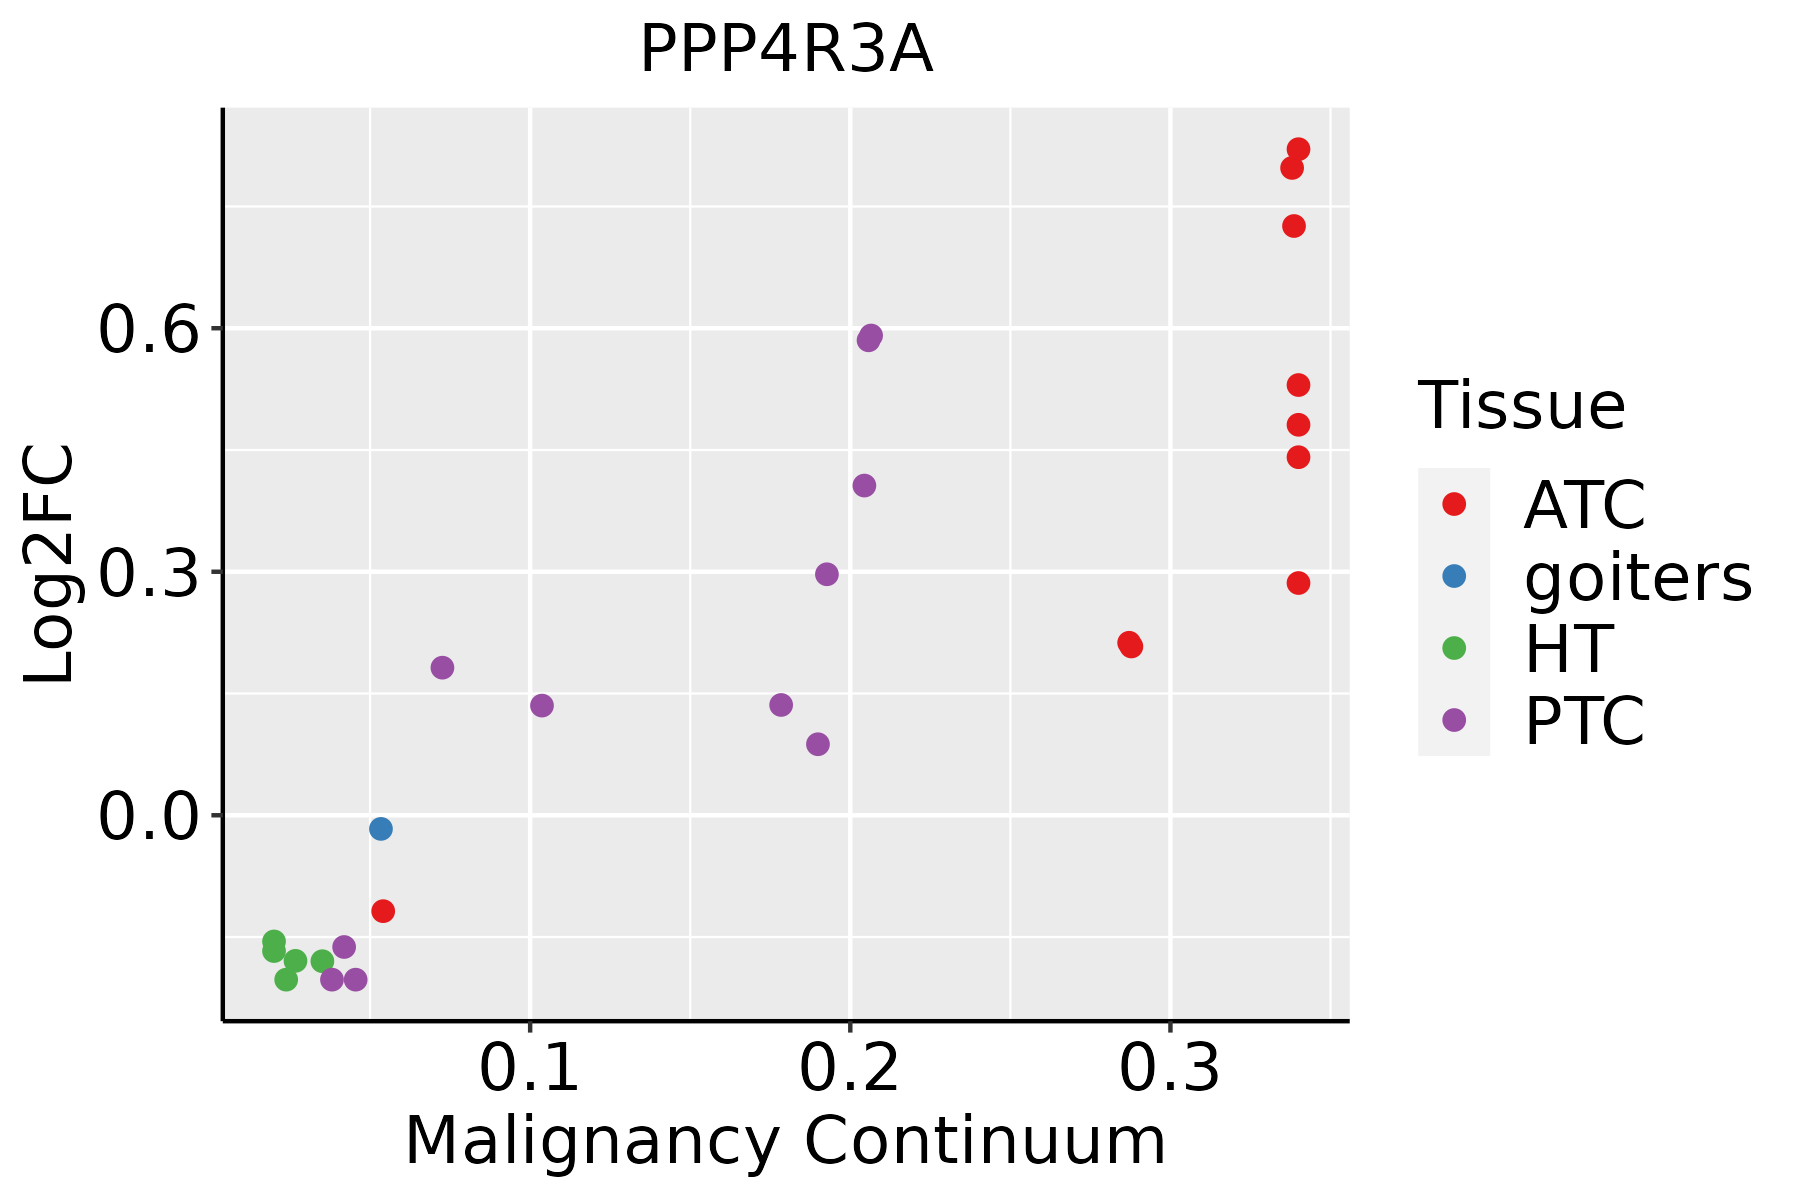 | ATC: Anaplastic thyroid cancer |
| HT: Hashimoto's thyroiditis | ||
| PTC: Papillary thyroid cancer |
| ∗log2FC in expression of this searched gene in stem-like cells from each diseased tissue sample relative to stem-like cells in normal samples in each tissue plotted against the malignancy continuum. Samples are colored based on if they are from different disease stage. |
Top |
Malignant transformation related pathway analysis |
| Find out the enriched GO biological processes and KEGG pathways involved in transition from healthy to precancer to cancer |
| Tissue | Disease Stage | Enriched GO biological Processes |
| Colorectum | AD |  |
| Colorectum | SER |  |
| Colorectum | MSS |  |
| Colorectum | MSI-H |  |
| Colorectum | FAP |  |
| ∗Top 15 enriched GO BP terms are showed in the bar plot of each disease state in each tissue. Each row represents a significant GO biological process which is colored according to the -log10(p.adjust). |
| Page: 1 2 3 4 5 6 7 8 9 |
| GO ID | Tissue | Disease Stage | Description | Gene Ratio | Bg Ratio | pvalue | p.adjust | Count |
| Page: 1 |
| Pathway ID | Tissue | Disease Stage | Description | Gene Ratio | Bg Ratio | pvalue | p.adjust | qvalue | Count |
| hsa0492214 | Esophagus | ESCC | Glucagon signaling pathway | 64/4205 | 107/8465 | 2.18e-02 | 4.80e-02 | 2.46e-02 | 64 |
| hsa0492215 | Esophagus | ESCC | Glucagon signaling pathway | 64/4205 | 107/8465 | 2.18e-02 | 4.80e-02 | 2.46e-02 | 64 |
| hsa0492210 | Liver | NAFLD | Glucagon signaling pathway | 24/1043 | 107/8465 | 2.33e-03 | 2.46e-02 | 1.99e-02 | 24 |
| hsa0492211 | Liver | NAFLD | Glucagon signaling pathway | 24/1043 | 107/8465 | 2.33e-03 | 2.46e-02 | 1.99e-02 | 24 |
| hsa0492221 | Liver | Cirrhotic | Glucagon signaling pathway | 43/2530 | 107/8465 | 1.42e-02 | 4.35e-02 | 2.68e-02 | 43 |
| hsa0492231 | Liver | Cirrhotic | Glucagon signaling pathway | 43/2530 | 107/8465 | 1.42e-02 | 4.35e-02 | 2.68e-02 | 43 |
| hsa0492241 | Liver | HCC | Glucagon signaling pathway | 64/4020 | 107/8465 | 6.70e-03 | 1.87e-02 | 1.04e-02 | 64 |
| hsa0492251 | Liver | HCC | Glucagon signaling pathway | 64/4020 | 107/8465 | 6.70e-03 | 1.87e-02 | 1.04e-02 | 64 |
| Page: 1 |
Top |
Cell-cell communication analysis |
| Identification of potential cell-cell interactions between two cell types and their ligand-receptor pairs for different disease states |
| Ligand | Receptor | LRpair | Pathway | Tissue | Disease Stage |
| Page: 1 |
Top |
Single-cell gene regulatory network inference analysis |
| Find out the significant the regulons (TFs) and the target genes of each regulon across cell types for different disease states |
| TF | Cell Type | Tissue | Disease Stage | Target Gene | RSS | Regulon Activity |
| ∗The dot plots of a searched regulon are shown for all cell subpopulations in each disease state of each tissue based on the regulon specific score inferred using pySCENIC and by calculating the average expression. |
| Page: 1 |
Top |
Somatic mutation of malignant transformation related genes |
| Annotation of somatic variants for genes involved in malignant transformation |
| Hugo Symbol | Variant Class | Variant Classification | dbSNP RS | HGVSc | HGVSp | HGVSp Short | SWISSPROT | BIOTYPE | SIFT | PolyPhen | Tumor Sample Barcode | Tissue | Histology | Sex | Age | Stage | Therapy Types | Drugs | Outcome |
| PPP4R3A | SNV | Missense_Mutation | c.1631G>A | p.Arg544His | p.R544H | Q6IN85 | protein_coding | deleterious(0) | probably_damaging(0.998) | TCGA-A7-A26J-01 | Breast | breast invasive carcinoma | Female | <65 | I/II | Hormone Therapy | tamoxiphen | SD | |
| PPP4R3A | SNV | Missense_Mutation | novel | c.161N>T | p.Ser54Leu | p.S54L | Q6IN85 | protein_coding | deleterious(0.03) | probably_damaging(0.975) | TCGA-AN-A046-01 | Breast | breast invasive carcinoma | Female | >=65 | I/II | Unknown | Unknown | SD |
| PPP4R3A | SNV | Missense_Mutation | c.2306G>C | p.Gly769Ala | p.G769A | Q6IN85 | protein_coding | tolerated(0.18) | benign(0.108) | TCGA-AO-A0JC-01 | Breast | breast invasive carcinoma | Female | <65 | I/II | Chemotherapy | fluorouracil | SD | |
| PPP4R3A | SNV | Missense_Mutation | rs141774507 | c.2216C>T | p.Thr739Met | p.T739M | Q6IN85 | protein_coding | tolerated(0.2) | possibly_damaging(0.703) | TCGA-BH-A18G-01 | Breast | breast invasive carcinoma | Female | >=65 | I/II | Unknown | Unknown | SD |
| PPP4R3A | SNV | Missense_Mutation | c.1522N>A | p.Glu508Lys | p.E508K | Q6IN85 | protein_coding | tolerated(0.09) | benign(0.11) | TCGA-BH-A1F6-01 | Breast | breast invasive carcinoma | Female | <65 | III/IV | Unknown | Unknown | SD | |
| PPP4R3A | SNV | Missense_Mutation | novel | c.133N>A | p.Glu45Lys | p.E45K | Q6IN85 | protein_coding | tolerated(0.07) | probably_damaging(0.953) | TCGA-PE-A5DD-01 | Breast | breast invasive carcinoma | Female | <65 | I/II | Chemotherapy | CR | |
| PPP4R3A | insertion | Frame_Shift_Ins | novel | c.1268_1269insGGTTTCTTCTACAAGCACTGTATGCATGTTCTCACTGCTCC | p.Cys423TrpfsTer34 | p.C423Wfs*34 | Q6IN85 | protein_coding | TCGA-AN-A0AK-01 | Breast | breast invasive carcinoma | Female | >=65 | I/II | Unknown | Unknown | SD | ||
| PPP4R3A | insertion | In_Frame_Ins | novel | c.1897_1898insGCGTGTGGTGGCGGGCGCCTGTAGTCTCAACTACTCAGGAGGCTG | p.Gln633delinsArgValTrpTrpArgAlaProValValSerThrThrGlnGluAlaGlu | p.Q633delinsRVWWRAPVVSTTQEAE | Q6IN85 | protein_coding | TCGA-AO-A0J9-01 | Breast | breast invasive carcinoma | Female | <65 | III/IV | Chemotherapy | cyclophosphamide | PD | ||
| PPP4R3A | deletion | Frame_Shift_Del | novel | c.813delN | p.Asp272IlefsTer27 | p.D272Ifs*27 | Q6IN85 | protein_coding | TCGA-EW-A2FV-01 | Breast | breast invasive carcinoma | Female | <65 | III/IV | Chemotherapy | docetaxel | SD | ||
| PPP4R3A | SNV | Missense_Mutation | novel | c.2152N>T | p.Leu718Phe | p.L718F | Q6IN85 | protein_coding | tolerated(0.16) | probably_damaging(0.975) | TCGA-2W-A8YY-01 | Cervix | cervical & endocervical cancer | Female | <65 | I/II | Chemotherapy | cisplatin | CR |
| Page: 1 2 3 4 5 6 7 8 |
Top |
Related drugs of malignant transformation related genes |
| Identification of chemicals and drugs interact with genes involved in malignant transfromation |
| (DGIdb 4.0) |
| Entrez ID | Symbol | Category | Interaction Types | Drug Claim Name | Drug Name | PMIDs |
| Page: 1 |

Copyright 2023-Present -The University of Texas Health Science Center at Houston |