
|
|||||
|
 | |
| |
| |
| |
| |
| |
|
Gene: PPP4R2 |
Gene summary for PPP4R2 |
| Gene information | Species | Human | Gene symbol | PPP4R2 | Gene ID | 151987 |
| Gene name | protein phosphatase 4 regulatory subunit 2 | |
| Gene Alias | PP4R2 | |
| Cytomap | 3p13 | |
| Gene Type | protein-coding | GO ID | GO:0000018 | UniProtAcc | Q9NY27 |
Top |
Malignant transformation analysis |
| Identification of the aberrant gene expression in precancerous and cancerous lesions by comparing the gene expression of stem-like cells in diseased tissues with normal stem cells |
| Entrez ID | Symbol | Replicates | Species | Organ | Tissue | Adj P-value | Log2FC | Malignancy |
| 151987 | PPP4R2 | HTA11_3410_2000001011 | Human | Colorectum | AD | 2.13e-12 | -5.23e-01 | 0.0155 |
| 151987 | PPP4R2 | HTA11_2487_2000001011 | Human | Colorectum | SER | 2.52e-03 | -3.90e-01 | -0.1808 |
| 151987 | PPP4R2 | HTA11_1938_2000001011 | Human | Colorectum | AD | 1.53e-02 | -1.80e-01 | -0.0811 |
| 151987 | PPP4R2 | HTA11_696_2000001011 | Human | Colorectum | AD | 2.63e-04 | -2.84e-01 | -0.1464 |
| 151987 | PPP4R2 | HTA11_866_3004761011 | Human | Colorectum | AD | 2.41e-07 | -4.54e-01 | 0.096 |
| 151987 | PPP4R2 | HTA11_7696_3000711011 | Human | Colorectum | AD | 1.65e-08 | -3.56e-01 | 0.0674 |
| 151987 | PPP4R2 | HTA11_99999973899_84307 | Human | Colorectum | MSS | 2.13e-02 | -5.05e-01 | 0.2585 |
| 151987 | PPP4R2 | HTA11_99999974143_84620 | Human | Colorectum | MSS | 2.22e-05 | -4.06e-01 | 0.3005 |
| 151987 | PPP4R2 | A015-C-203 | Human | Colorectum | FAP | 4.43e-19 | -3.09e-01 | -0.1294 |
| 151987 | PPP4R2 | A015-C-204 | Human | Colorectum | FAP | 7.56e-03 | -2.52e-01 | -0.0228 |
| 151987 | PPP4R2 | A014-C-040 | Human | Colorectum | FAP | 1.65e-02 | -2.08e-01 | -0.1184 |
| 151987 | PPP4R2 | A002-C-201 | Human | Colorectum | FAP | 1.71e-07 | -2.14e-01 | 0.0324 |
| 151987 | PPP4R2 | A001-C-119 | Human | Colorectum | FAP | 1.27e-02 | -1.46e-01 | -0.1557 |
| 151987 | PPP4R2 | A001-C-108 | Human | Colorectum | FAP | 7.78e-12 | -3.08e-01 | -0.0272 |
| 151987 | PPP4R2 | A002-C-205 | Human | Colorectum | FAP | 7.77e-15 | -2.28e-01 | -0.1236 |
| 151987 | PPP4R2 | A001-C-104 | Human | Colorectum | FAP | 1.37e-02 | -2.55e-01 | 0.0184 |
| 151987 | PPP4R2 | A015-C-005 | Human | Colorectum | FAP | 1.54e-03 | -3.13e-01 | -0.0336 |
| 151987 | PPP4R2 | A015-C-006 | Human | Colorectum | FAP | 3.80e-11 | -4.14e-01 | -0.0994 |
| 151987 | PPP4R2 | A015-C-106 | Human | Colorectum | FAP | 5.25e-06 | -2.71e-01 | -0.0511 |
| 151987 | PPP4R2 | A002-C-114 | Human | Colorectum | FAP | 5.36e-14 | -3.39e-01 | -0.1561 |
| Page: 1 2 3 4 5 6 7 8 |
| Tissue | Expression Dynamics | Abbreviation |
| Colorectum (GSE201348) | 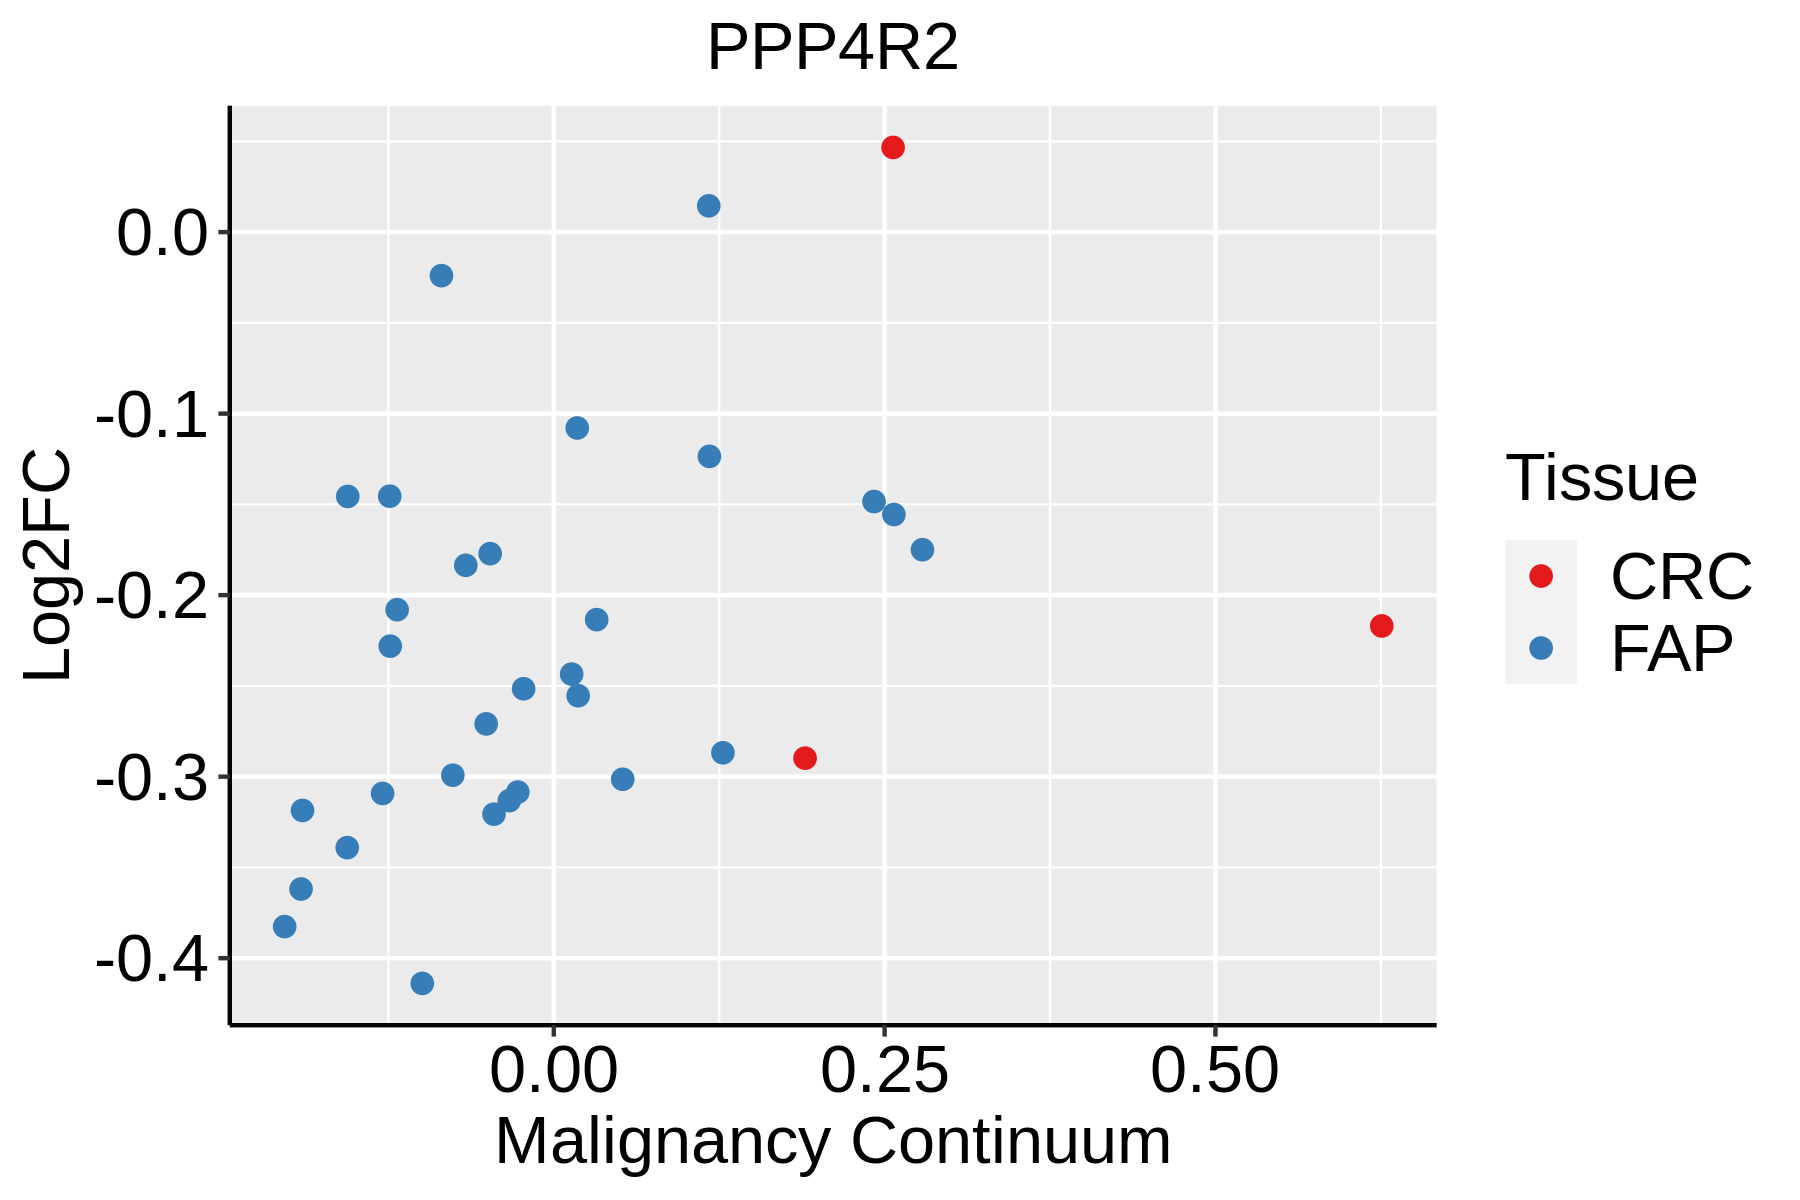 | FAP: Familial adenomatous polyposis |
| CRC: Colorectal cancer | ||
| Colorectum (HTA11) |  | AD: Adenomas |
| SER: Sessile serrated lesions | ||
| MSI-H: Microsatellite-high colorectal cancer | ||
| MSS: Microsatellite stable colorectal cancer | ||
| Esophagus |  | ESCC: Esophageal squamous cell carcinoma |
| HGIN: High-grade intraepithelial neoplasias | ||
| LGIN: Low-grade intraepithelial neoplasias | ||
| Liver | 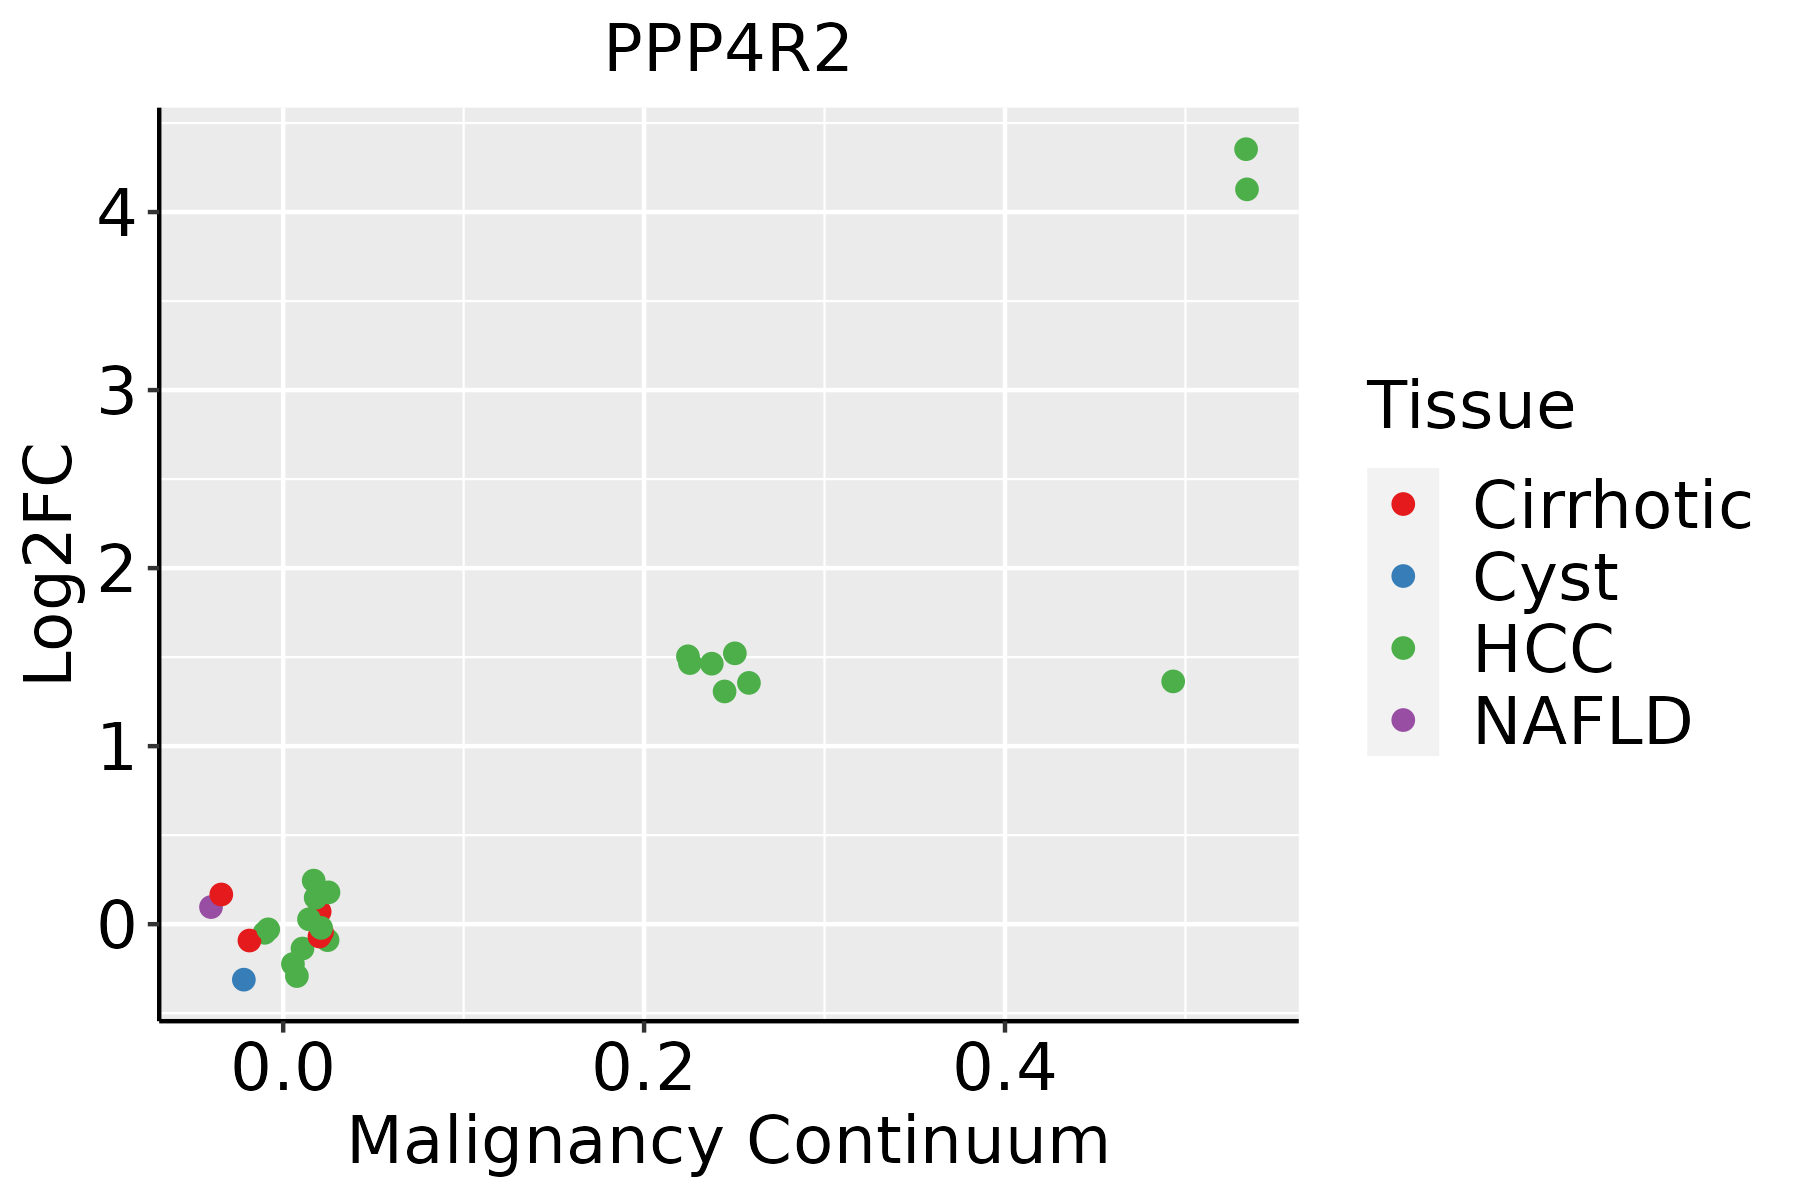 | HCC: Hepatocellular carcinoma |
| NAFLD: Non-alcoholic fatty liver disease | ||
| Oral Cavity |  | EOLP: Erosive Oral lichen planus |
| LP: leukoplakia | ||
| NEOLP: Non-erosive oral lichen planus | ||
| OSCC: Oral squamous cell carcinoma | ||
| Skin |  | AK: Actinic keratosis |
| cSCC: Cutaneous squamous cell carcinoma | ||
| SCCIS:squamous cell carcinoma in situ | ||
| Thyroid | 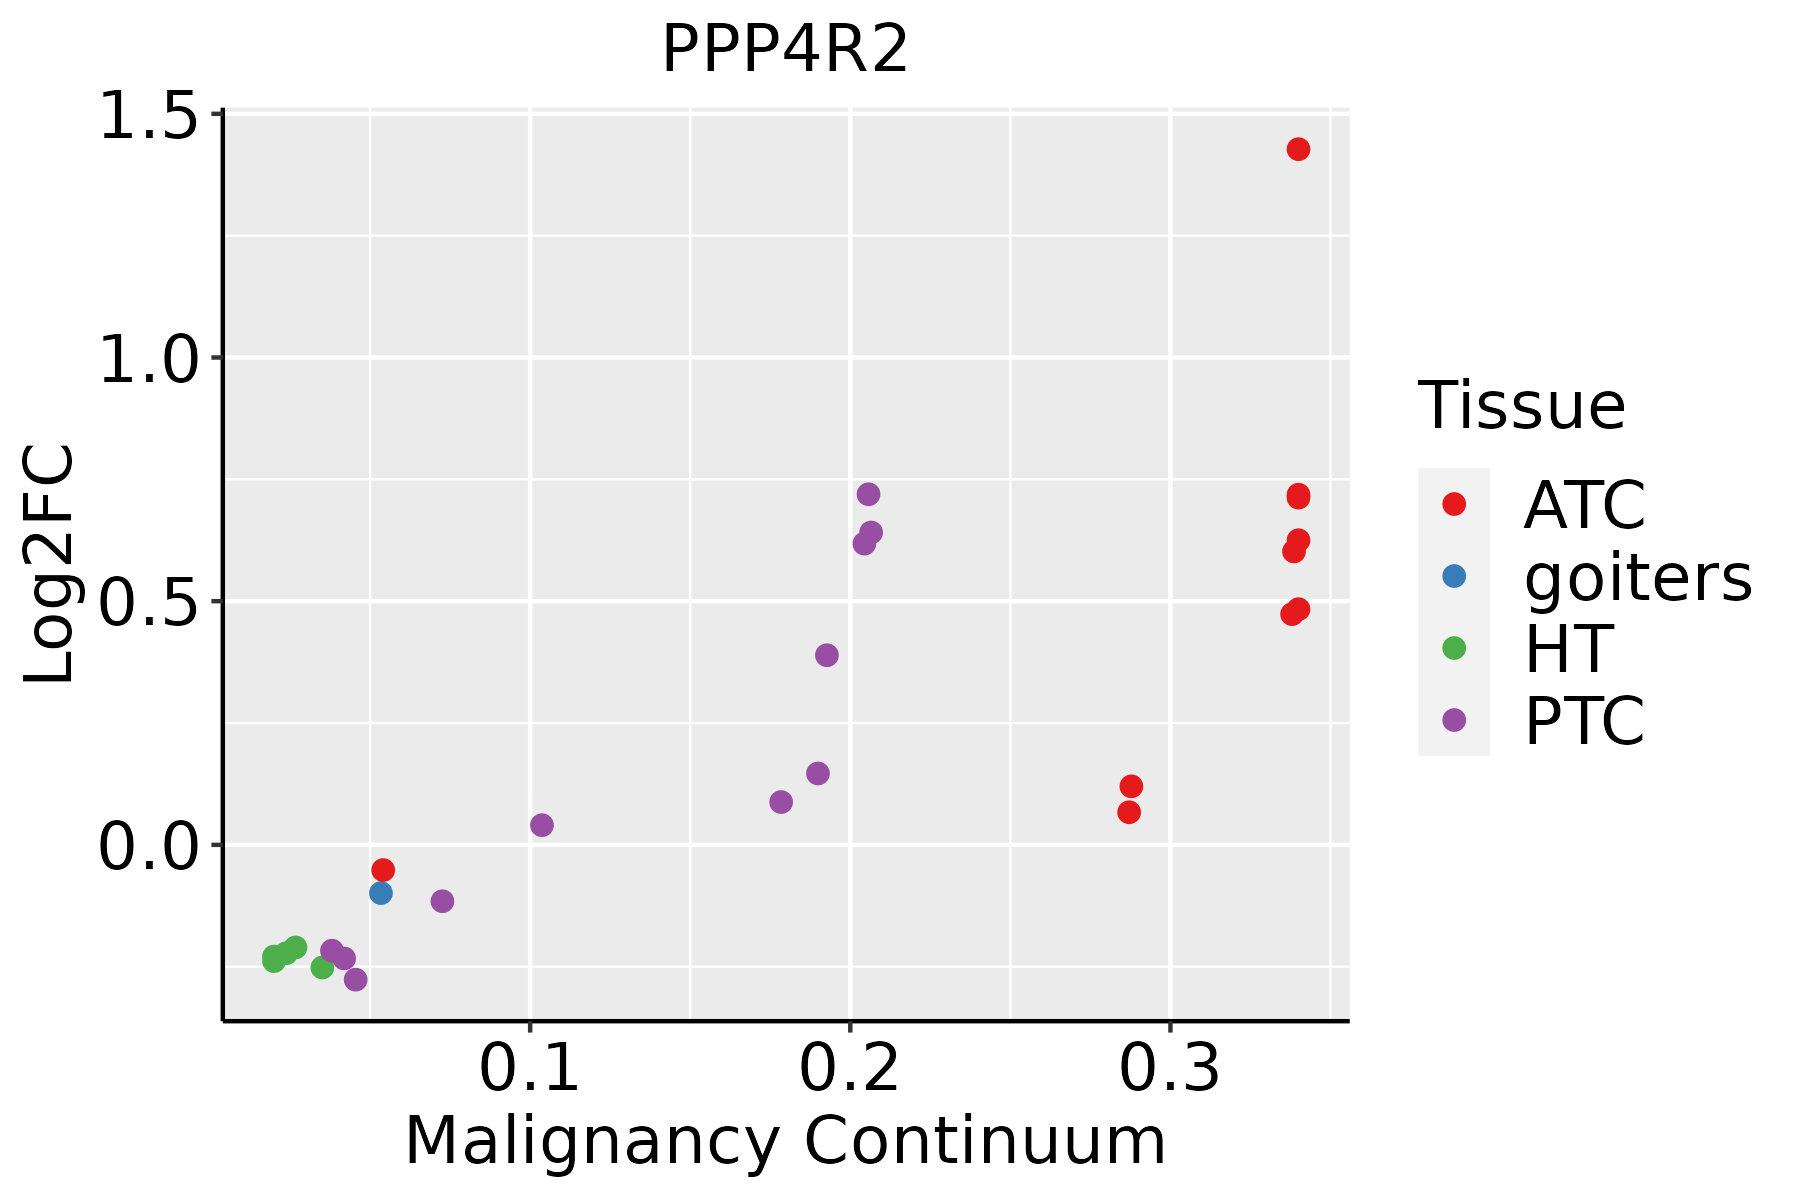 | ATC: Anaplastic thyroid cancer |
| HT: Hashimoto's thyroiditis | ||
| PTC: Papillary thyroid cancer |
| ∗log2FC in expression of this searched gene in stem-like cells from each diseased tissue sample relative to stem-like cells in normal samples in each tissue plotted against the malignancy continuum. Samples are colored based on if they are from different disease stage. |
Top |
Malignant transformation related pathway analysis |
| Find out the enriched GO biological processes and KEGG pathways involved in transition from healthy to precancer to cancer |
| Tissue | Disease Stage | Enriched GO biological Processes |
| Colorectum | AD |  |
| Colorectum | SER |  |
| Colorectum | MSS |  |
| Colorectum | MSI-H |  |
| Colorectum | FAP |  |
| ∗Top 15 enriched GO BP terms are showed in the bar plot of each disease state in each tissue. Each row represents a significant GO biological process which is colored according to the -log10(p.adjust). |
| Page: 1 2 3 4 5 6 7 8 9 |
| GO ID | Tissue | Disease Stage | Description | Gene Ratio | Bg Ratio | pvalue | p.adjust | Count |
| GO:0008380 | Colorectum | AD | RNA splicing | 169/3918 | 434/18723 | 3.59e-18 | 2.04e-15 | 169 |
| GO:0051052 | Colorectum | AD | regulation of DNA metabolic process | 116/3918 | 359/18723 | 2.47e-07 | 1.00e-05 | 116 |
| GO:0016311 | Colorectum | AD | dephosphorylation | 123/3918 | 417/18723 | 1.84e-05 | 3.82e-04 | 123 |
| GO:0006470 | Colorectum | AD | protein dephosphorylation | 88/3918 | 281/18723 | 2.56e-05 | 4.89e-04 | 88 |
| GO:2001020 | Colorectum | AD | regulation of response to DNA damage stimulus | 71/3918 | 219/18723 | 4.38e-05 | 7.65e-04 | 71 |
| GO:0006282 | Colorectum | AD | regulation of DNA repair | 42/3918 | 130/18723 | 1.57e-03 | 1.32e-02 | 42 |
| GO:00083801 | Colorectum | SER | RNA splicing | 123/2897 | 434/18723 | 3.84e-12 | 8.41e-10 | 123 |
| GO:00510521 | Colorectum | SER | regulation of DNA metabolic process | 83/2897 | 359/18723 | 8.03e-05 | 1.77e-03 | 83 |
| GO:00064701 | Colorectum | SER | protein dephosphorylation | 65/2897 | 281/18723 | 4.44e-04 | 6.51e-03 | 65 |
| GO:00163111 | Colorectum | SER | dephosphorylation | 86/2897 | 417/18723 | 2.73e-03 | 2.46e-02 | 86 |
| GO:20010201 | Colorectum | SER | regulation of response to DNA damage stimulus | 49/2897 | 219/18723 | 4.24e-03 | 3.45e-02 | 49 |
| GO:00083802 | Colorectum | MSS | RNA splicing | 159/3467 | 434/18723 | 1.75e-19 | 1.22e-16 | 159 |
| GO:00510522 | Colorectum | MSS | regulation of DNA metabolic process | 108/3467 | 359/18723 | 5.86e-08 | 3.10e-06 | 108 |
| GO:20010202 | Colorectum | MSS | regulation of response to DNA damage stimulus | 64/3467 | 219/18723 | 7.20e-05 | 1.21e-03 | 64 |
| GO:00064702 | Colorectum | MSS | protein dephosphorylation | 73/3467 | 281/18723 | 1.15e-03 | 1.12e-02 | 73 |
| GO:00062821 | Colorectum | MSS | regulation of DNA repair | 38/3467 | 130/18723 | 1.93e-03 | 1.67e-02 | 38 |
| GO:00163112 | Colorectum | MSS | dephosphorylation | 101/3467 | 417/18723 | 1.98e-03 | 1.70e-02 | 101 |
| GO:0006302 | Colorectum | MSS | double-strand break repair | 64/3467 | 251/18723 | 3.58e-03 | 2.65e-02 | 64 |
| GO:00083804 | Colorectum | FAP | RNA splicing | 108/2622 | 434/18723 | 7.90e-10 | 1.86e-07 | 108 |
| GO:00163113 | Colorectum | FAP | dephosphorylation | 95/2622 | 417/18723 | 7.07e-07 | 3.32e-05 | 95 |
| Page: 1 2 3 4 5 6 |
| Pathway ID | Tissue | Disease Stage | Description | Gene Ratio | Bg Ratio | pvalue | p.adjust | qvalue | Count |
| Page: 1 |
Top |
Cell-cell communication analysis |
| Identification of potential cell-cell interactions between two cell types and their ligand-receptor pairs for different disease states |
| Ligand | Receptor | LRpair | Pathway | Tissue | Disease Stage |
| Page: 1 |
Top |
Single-cell gene regulatory network inference analysis |
| Find out the significant the regulons (TFs) and the target genes of each regulon across cell types for different disease states |
| TF | Cell Type | Tissue | Disease Stage | Target Gene | RSS | Regulon Activity |
| ∗The dot plots of a searched regulon are shown for all cell subpopulations in each disease state of each tissue based on the regulon specific score inferred using pySCENIC and by calculating the average expression. |
| Page: 1 |
Top |
Somatic mutation of malignant transformation related genes |
| Annotation of somatic variants for genes involved in malignant transformation |
| Hugo Symbol | Variant Class | Variant Classification | dbSNP RS | HGVSc | HGVSp | HGVSp Short | SWISSPROT | BIOTYPE | SIFT | PolyPhen | Tumor Sample Barcode | Tissue | Histology | Sex | Age | Stage | Therapy Types | Drugs | Outcome |
| PPP4R2 | SNV | Missense_Mutation | c.445N>G | p.Arg149Gly | p.R149G | Q9NY27 | protein_coding | deleterious(0.02) | probably_damaging(0.974) | TCGA-AC-A23H-01 | Breast | breast invasive carcinoma | Female | >=65 | I/II | Unknown | Unknown | PD | |
| PPP4R2 | SNV | Missense_Mutation | c.1207N>A | p.Asp403Asn | p.D403N | Q9NY27 | protein_coding | tolerated(0.77) | benign(0) | TCGA-AC-A23H-01 | Breast | breast invasive carcinoma | Female | >=65 | I/II | Unknown | Unknown | PD | |
| PPP4R2 | SNV | Missense_Mutation | novel | c.904N>C | p.Glu302Gln | p.E302Q | Q9NY27 | protein_coding | deleterious(0.05) | benign(0.029) | TCGA-AO-A0J4-01 | Breast | breast invasive carcinoma | Female | <65 | I/II | Chemotherapy | doxorubicin | SD |
| PPP4R2 | SNV | Missense_Mutation | c.203N>C | p.Arg68Thr | p.R68T | Q9NY27 | protein_coding | deleterious(0) | probably_damaging(0.998) | TCGA-BH-A18K-01 | Breast | breast invasive carcinoma | Female | <65 | I/II | Unknown | Unknown | PD | |
| PPP4R2 | SNV | Missense_Mutation | c.958N>G | p.Pro320Ala | p.P320A | Q9NY27 | protein_coding | tolerated(0.18) | benign(0.001) | TCGA-BH-A18V-01 | Breast | breast invasive carcinoma | Female | <65 | I/II | Unknown | Unknown | SD | |
| PPP4R2 | insertion | Nonsense_Mutation | novel | c.918_919insTCACTGTAAAT | p.Glu307SerfsTer3 | p.E307Sfs*3 | Q9NY27 | protein_coding | TCGA-AN-A0FY-01 | Breast | breast invasive carcinoma | Female | <65 | I/II | Unknown | Unknown | SD | ||
| PPP4R2 | insertion | Frame_Shift_Ins | novel | c.918_919insTCACT | p.Glu307SerfsTer9 | p.E307Sfs*9 | Q9NY27 | protein_coding | TCGA-AR-A0U0-01 | Breast | breast invasive carcinoma | Female | >=65 | I/II | Unknown | Unknown | SD | ||
| PPP4R2 | insertion | Frame_Shift_Ins | novel | c.919_920insT | p.Glu307ValfsTer24 | p.E307Vfs*24 | Q9NY27 | protein_coding | TCGA-AR-A0U0-01 | Breast | breast invasive carcinoma | Female | >=65 | I/II | Unknown | Unknown | SD | ||
| PPP4R2 | SNV | Missense_Mutation | novel | c.940A>G | p.Thr314Ala | p.T314A | Q9NY27 | protein_coding | deleterious(0.04) | probably_damaging(0.956) | TCGA-5M-AAT6-01 | Colorectum | colon adenocarcinoma | Female | <65 | III/IV | Unknown | Unknown | PD |
| PPP4R2 | SNV | Missense_Mutation | c.496N>C | p.Ser166Pro | p.S166P | Q9NY27 | protein_coding | deleterious(0.04) | benign(0.023) | TCGA-CK-6746-01 | Colorectum | colon adenocarcinoma | Female | >=65 | I/II | Unknown | Unknown | SD |
| Page: 1 2 3 4 |
Top |
Related drugs of malignant transformation related genes |
| Identification of chemicals and drugs interact with genes involved in malignant transfromation |
| (DGIdb 4.0) |
| Entrez ID | Symbol | Category | Interaction Types | Drug Claim Name | Drug Name | PMIDs |
| Page: 1 |

Copyright 2023-Present -The University of Texas Health Science Center at Houston |