
|
|||||
|
 | |
| |
| |
| |
| |
| |
|
Gene: PPP4C |
Gene summary for PPP4C |
| Gene information | Species | Human | Gene symbol | PPP4C | Gene ID | 5531 |
| Gene name | protein phosphatase 4 catalytic subunit | |
| Gene Alias | PP-X | |
| Cytomap | 16p11.2 | |
| Gene Type | protein-coding | GO ID | GO:0000018 | UniProtAcc | A0A024R625 |
Top |
Malignant transformation analysis |
| Identification of the aberrant gene expression in precancerous and cancerous lesions by comparing the gene expression of stem-like cells in diseased tissues with normal stem cells |
| Entrez ID | Symbol | Replicates | Species | Organ | Tissue | Adj P-value | Log2FC | Malignancy |
| 5531 | PPP4C | GSM4909288 | Human | Breast | IDC | 4.04e-02 | -2.43e-01 | 0.0988 |
| 5531 | PPP4C | GSM4909294 | Human | Breast | IDC | 2.69e-04 | -2.13e-01 | 0.2022 |
| 5531 | PPP4C | GSM4909296 | Human | Breast | IDC | 1.13e-11 | 9.52e-02 | 0.1524 |
| 5531 | PPP4C | GSM4909297 | Human | Breast | IDC | 9.76e-14 | -1.56e-01 | 0.1517 |
| 5531 | PPP4C | GSM4909301 | Human | Breast | IDC | 1.37e-02 | -1.13e-01 | 0.1577 |
| 5531 | PPP4C | GSM4909306 | Human | Breast | IDC | 3.89e-07 | 3.81e-01 | 0.1564 |
| 5531 | PPP4C | GSM4909311 | Human | Breast | IDC | 5.04e-37 | -2.79e-01 | 0.1534 |
| 5531 | PPP4C | GSM4909312 | Human | Breast | IDC | 1.52e-17 | -9.56e-02 | 0.1552 |
| 5531 | PPP4C | GSM4909313 | Human | Breast | IDC | 3.68e-04 | -1.99e-01 | 0.0391 |
| 5531 | PPP4C | GSM4909319 | Human | Breast | IDC | 2.34e-43 | -1.40e-01 | 0.1563 |
| 5531 | PPP4C | GSM4909321 | Human | Breast | IDC | 4.60e-21 | 3.25e-02 | 0.1559 |
| 5531 | PPP4C | brca1 | Human | Breast | Precancer | 6.66e-16 | 5.13e-01 | -0.0338 |
| 5531 | PPP4C | brca2 | Human | Breast | Precancer | 8.66e-06 | 3.26e-01 | -0.024 |
| 5531 | PPP4C | brca3 | Human | Breast | Precancer | 4.70e-03 | 2.59e-01 | -0.0263 |
| 5531 | PPP4C | NCCBC14 | Human | Breast | DCIS | 1.78e-07 | -9.71e-02 | 0.2021 |
| 5531 | PPP4C | NCCBC3 | Human | Breast | DCIS | 3.95e-04 | -1.05e-01 | 0.1198 |
| 5531 | PPP4C | NCCBC5 | Human | Breast | DCIS | 2.38e-14 | 3.53e-02 | 0.2046 |
| 5531 | PPP4C | NCCBC6 | Human | Breast | DCIS | 5.28e-03 | 2.06e-01 | 0.2095 |
| 5531 | PPP4C | P1 | Human | Breast | IDC | 2.66e-20 | -1.17e-01 | 0.1527 |
| 5531 | PPP4C | DCIS2 | Human | Breast | DCIS | 1.41e-49 | -2.06e-02 | 0.0085 |
| Page: 1 2 3 4 5 6 7 8 9 10 11 |
| Tissue | Expression Dynamics | Abbreviation |
| Breast | 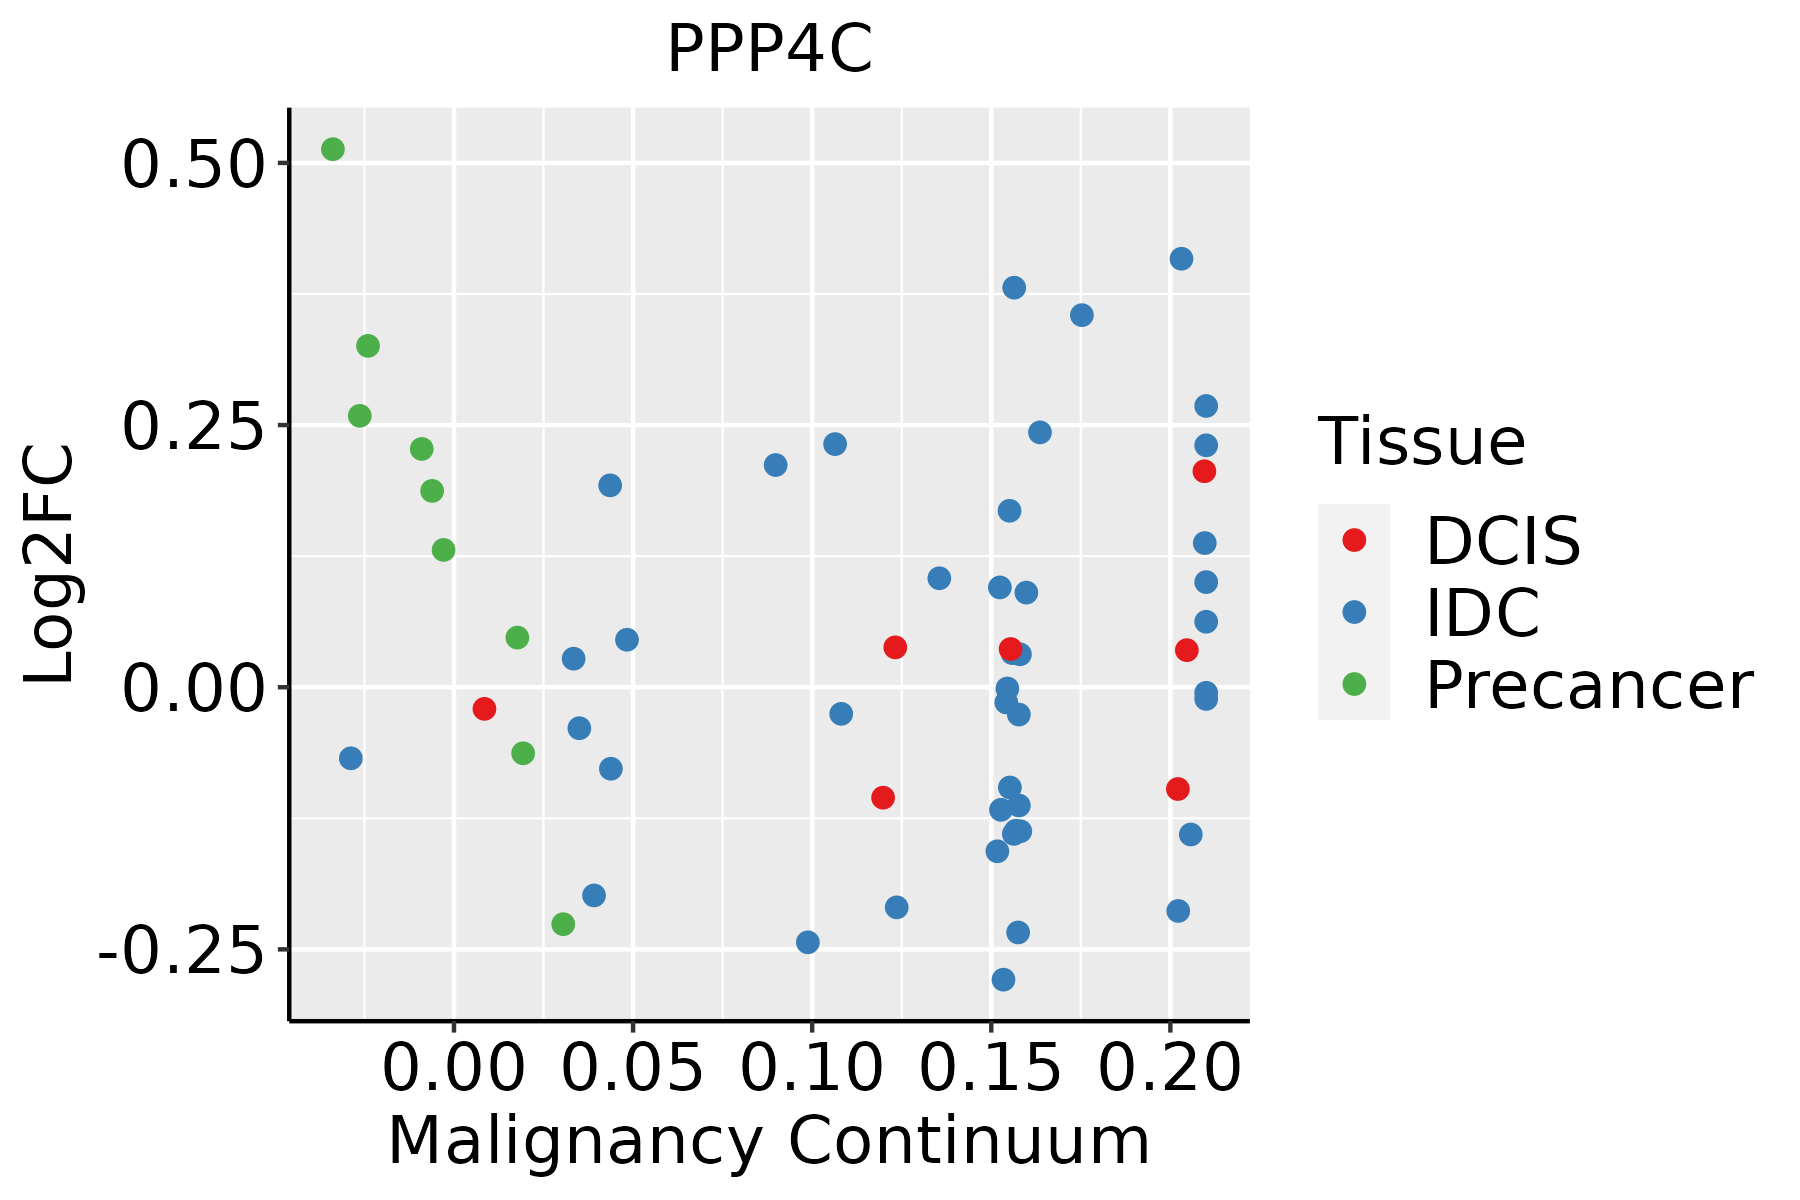 | IDC: Invasive ductal carcinoma |
| DCIS: Ductal carcinoma in situ | ||
| Precancer(BRCA1-mut): Precancerous lesion from BRCA1 mutation carriers | ||
| Colorectum (GSE201348) |  | FAP: Familial adenomatous polyposis |
| CRC: Colorectal cancer | ||
| Colorectum (HTA11) | 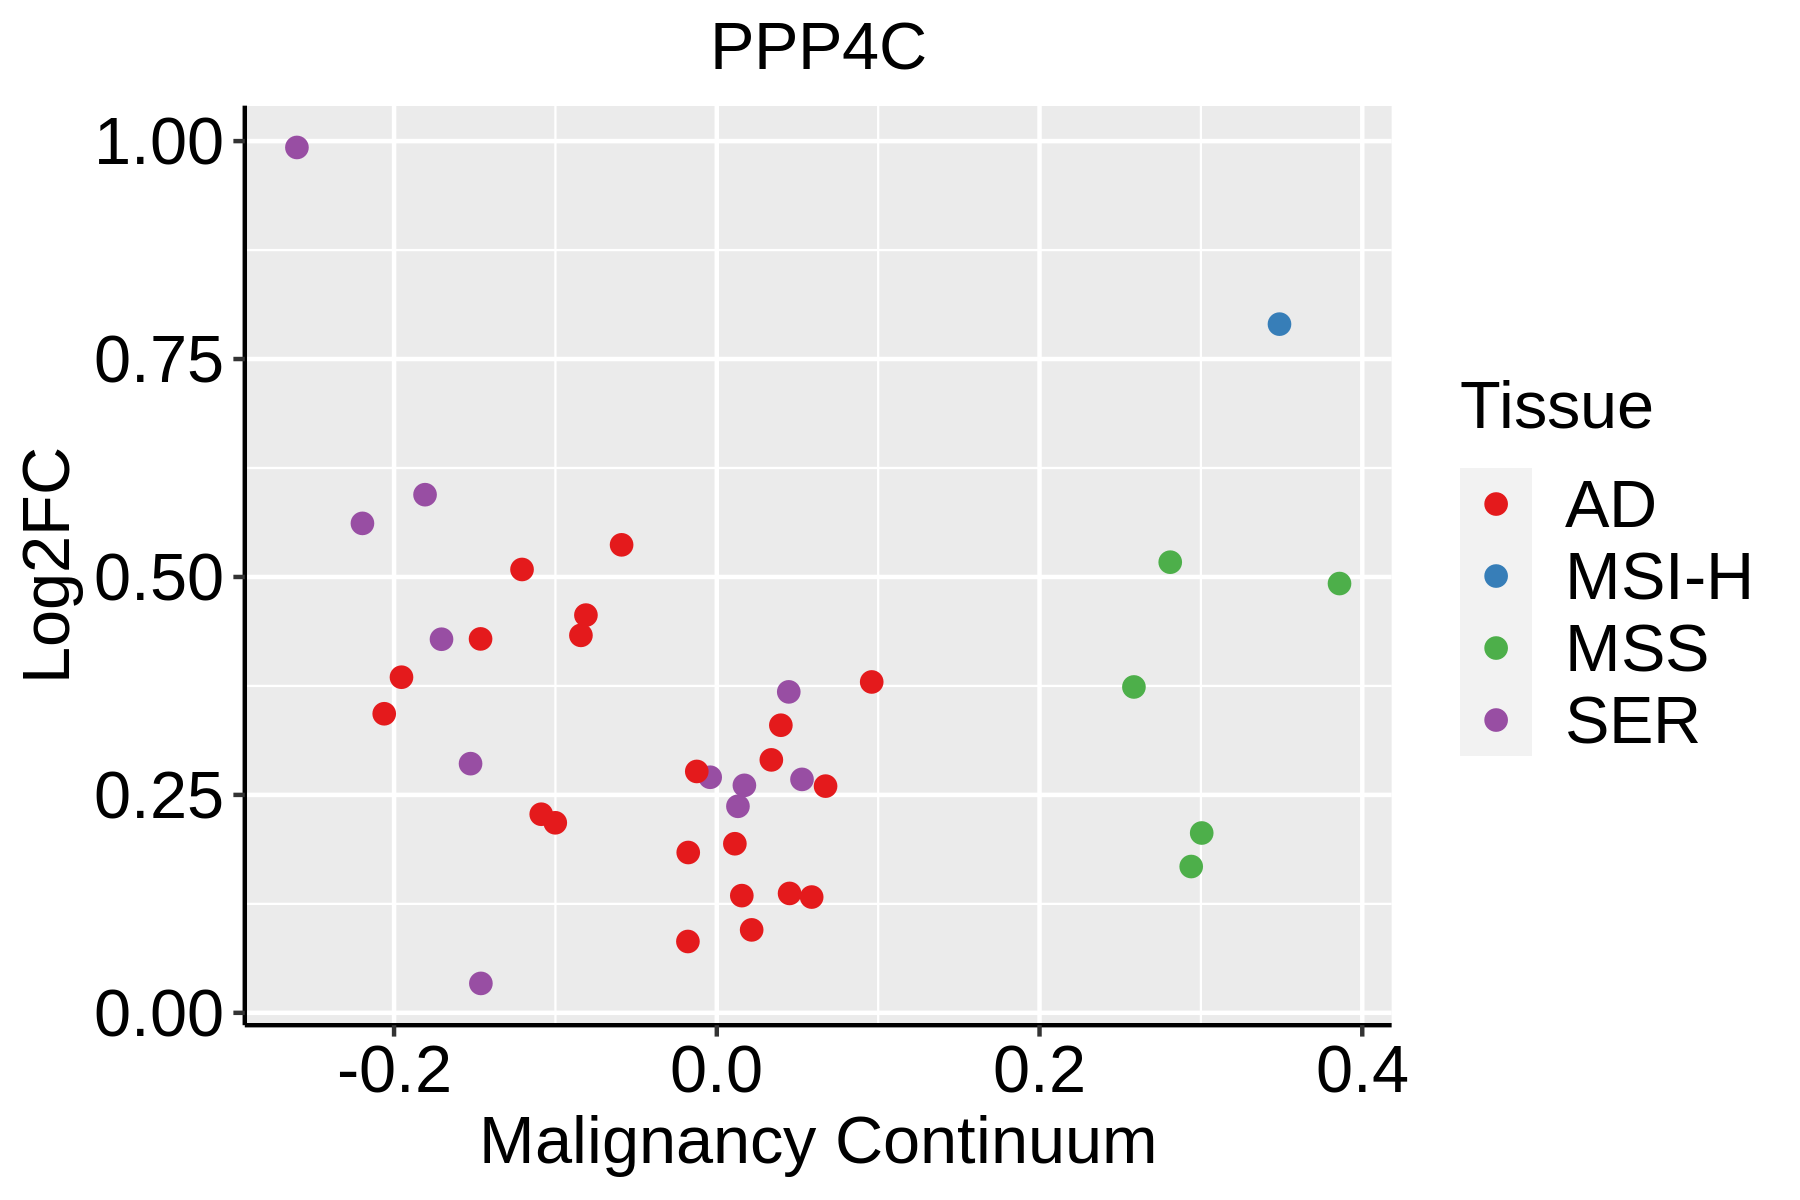 | AD: Adenomas |
| SER: Sessile serrated lesions | ||
| MSI-H: Microsatellite-high colorectal cancer | ||
| MSS: Microsatellite stable colorectal cancer | ||
| Endometrium |  | AEH: Atypical endometrial hyperplasia |
| EEC: Endometrioid Cancer | ||
| Esophagus | 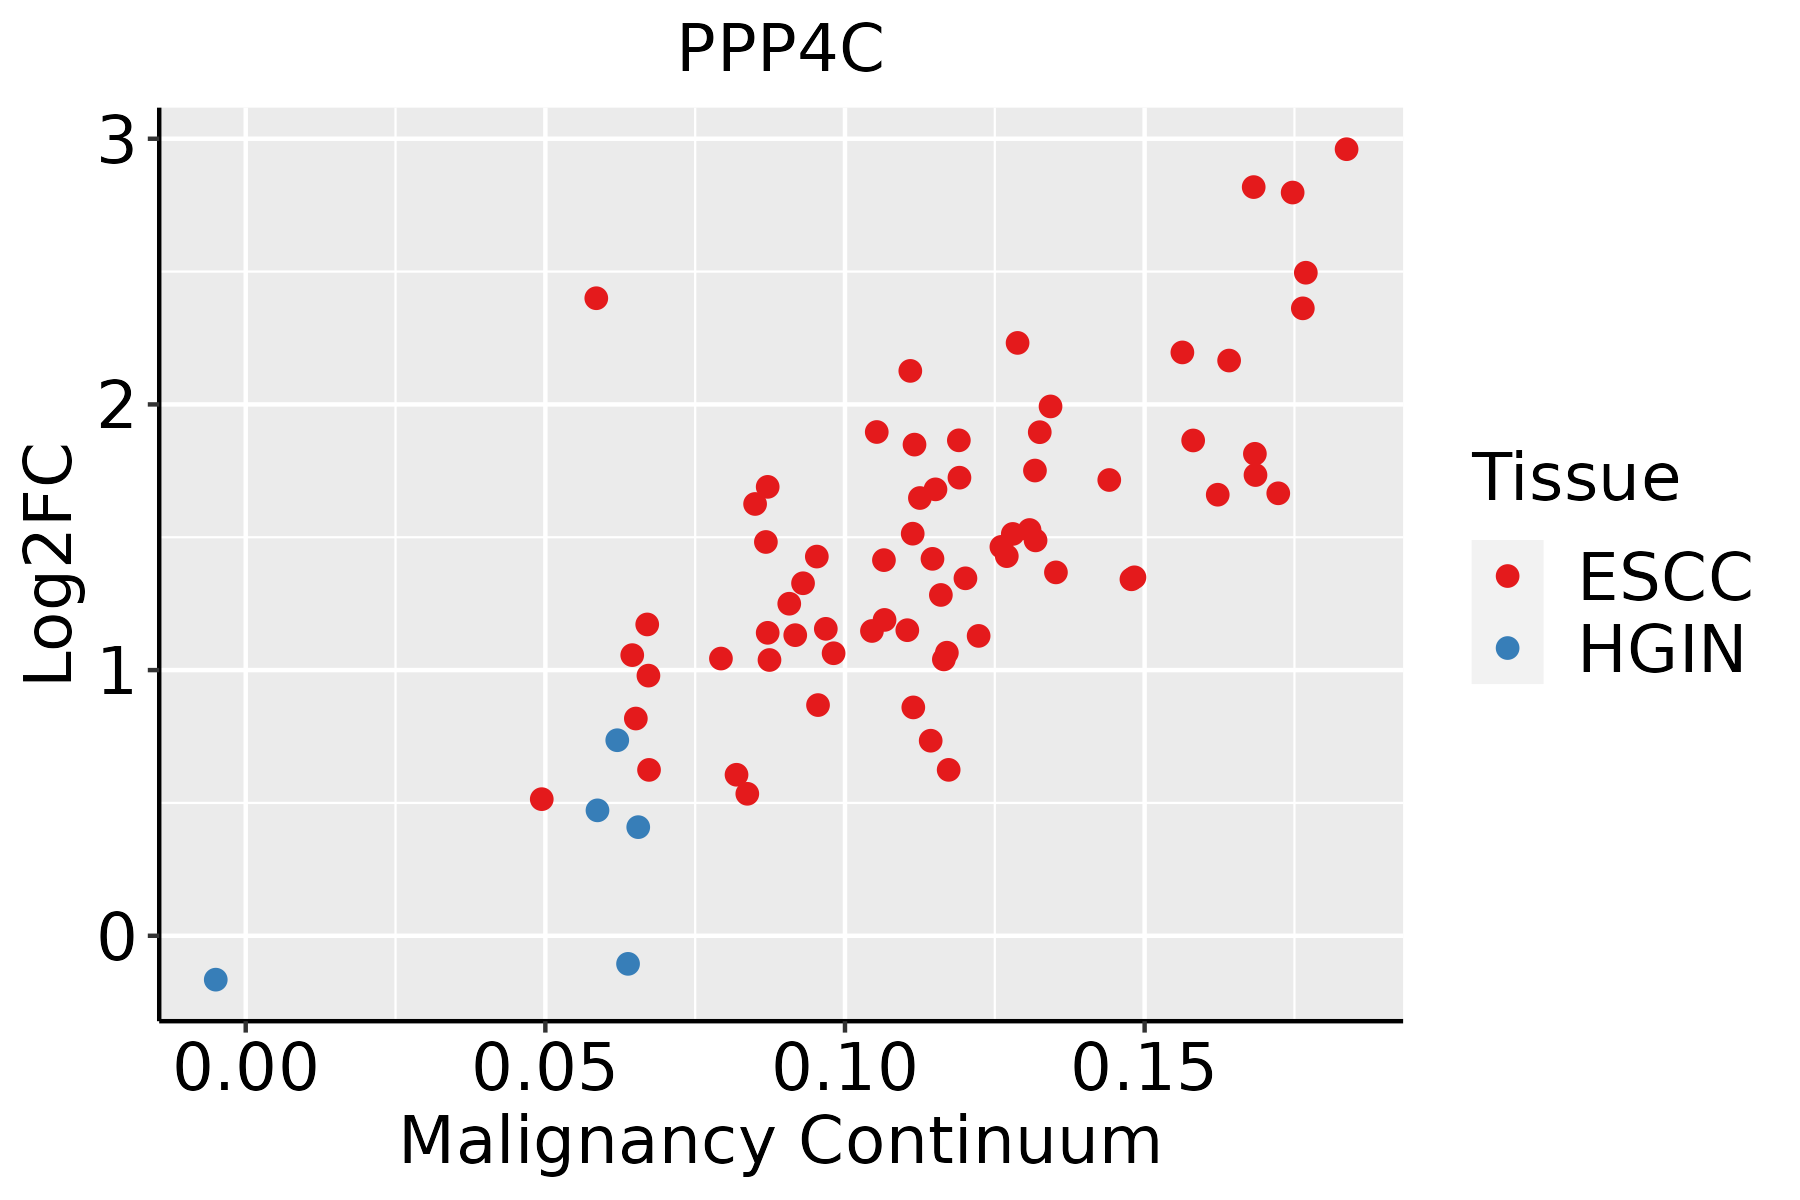 | ESCC: Esophageal squamous cell carcinoma |
| HGIN: High-grade intraepithelial neoplasias | ||
| LGIN: Low-grade intraepithelial neoplasias | ||
| Liver | 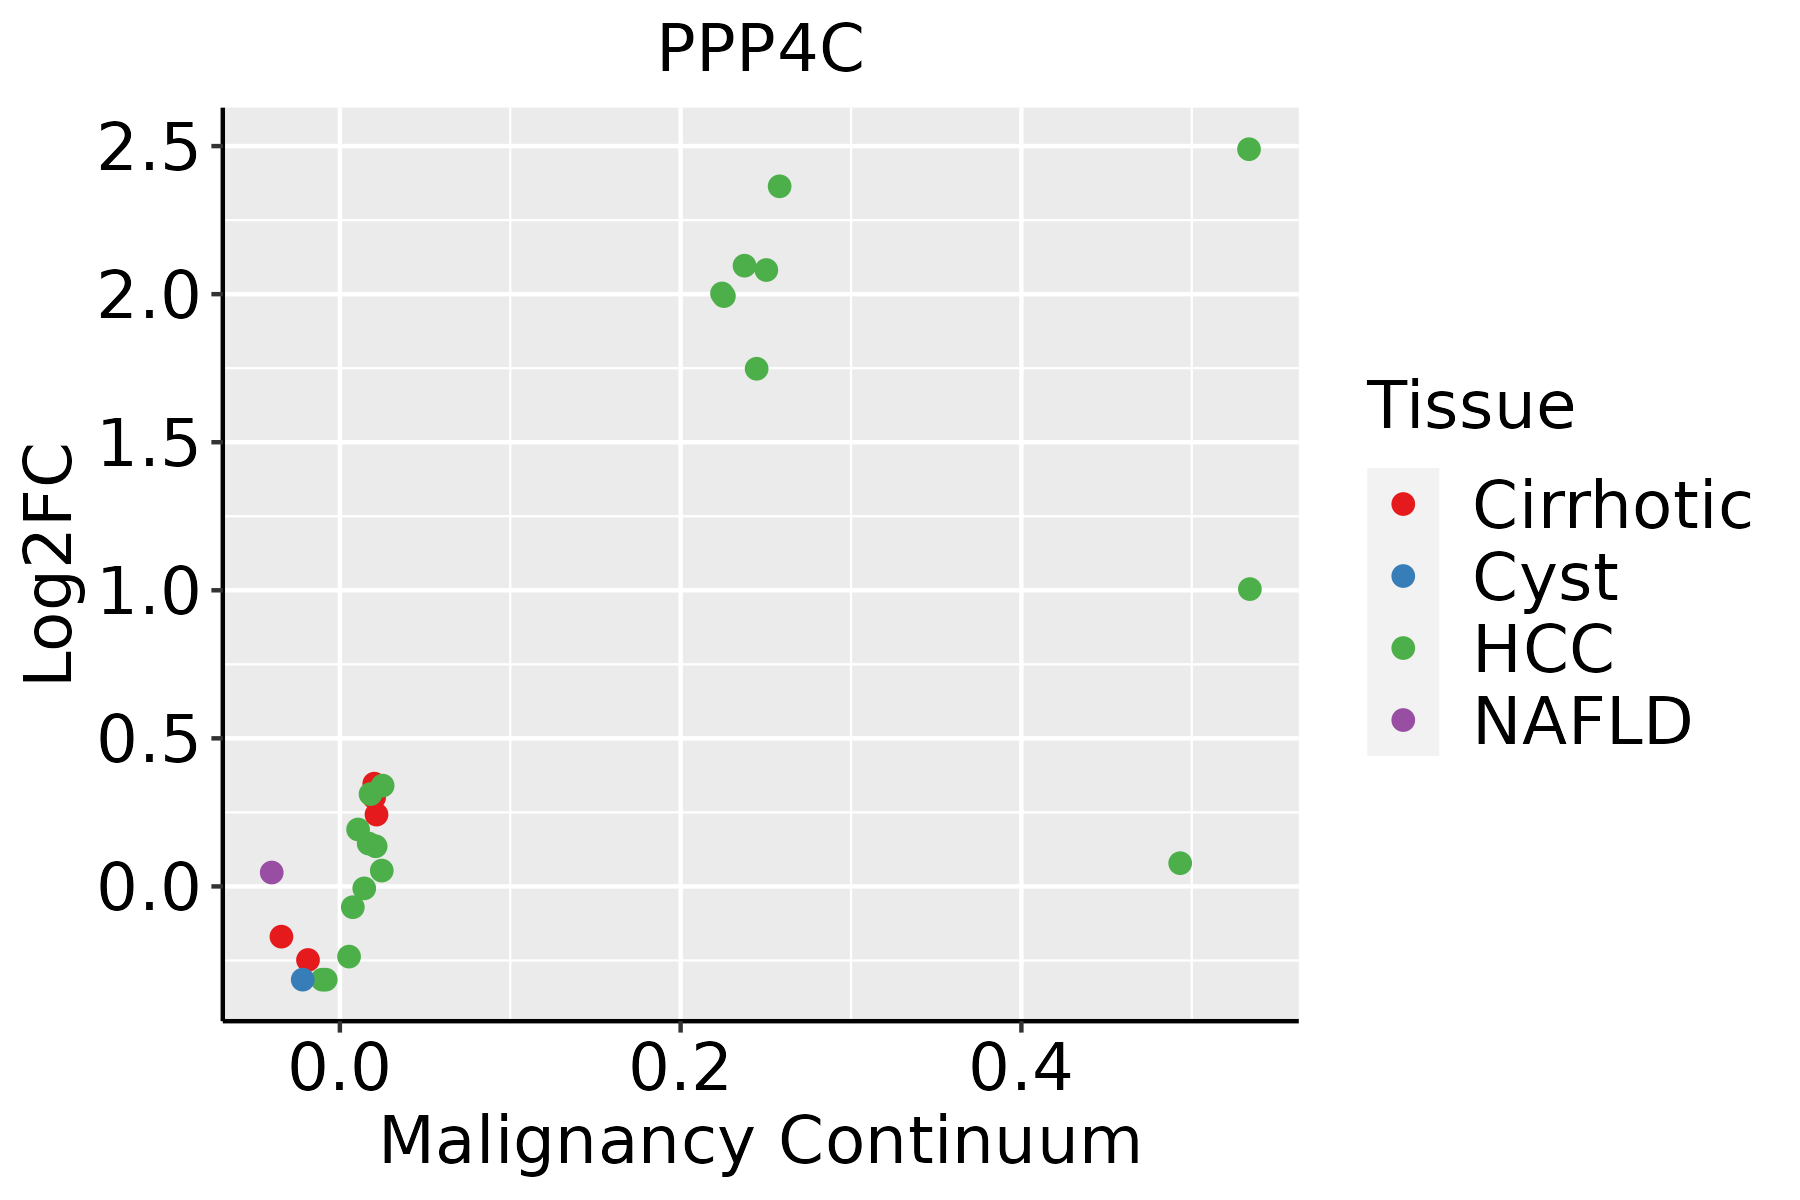 | HCC: Hepatocellular carcinoma |
| NAFLD: Non-alcoholic fatty liver disease | ||
| Oral Cavity |  | EOLP: Erosive Oral lichen planus |
| LP: leukoplakia | ||
| NEOLP: Non-erosive oral lichen planus | ||
| OSCC: Oral squamous cell carcinoma | ||
| Prostate | 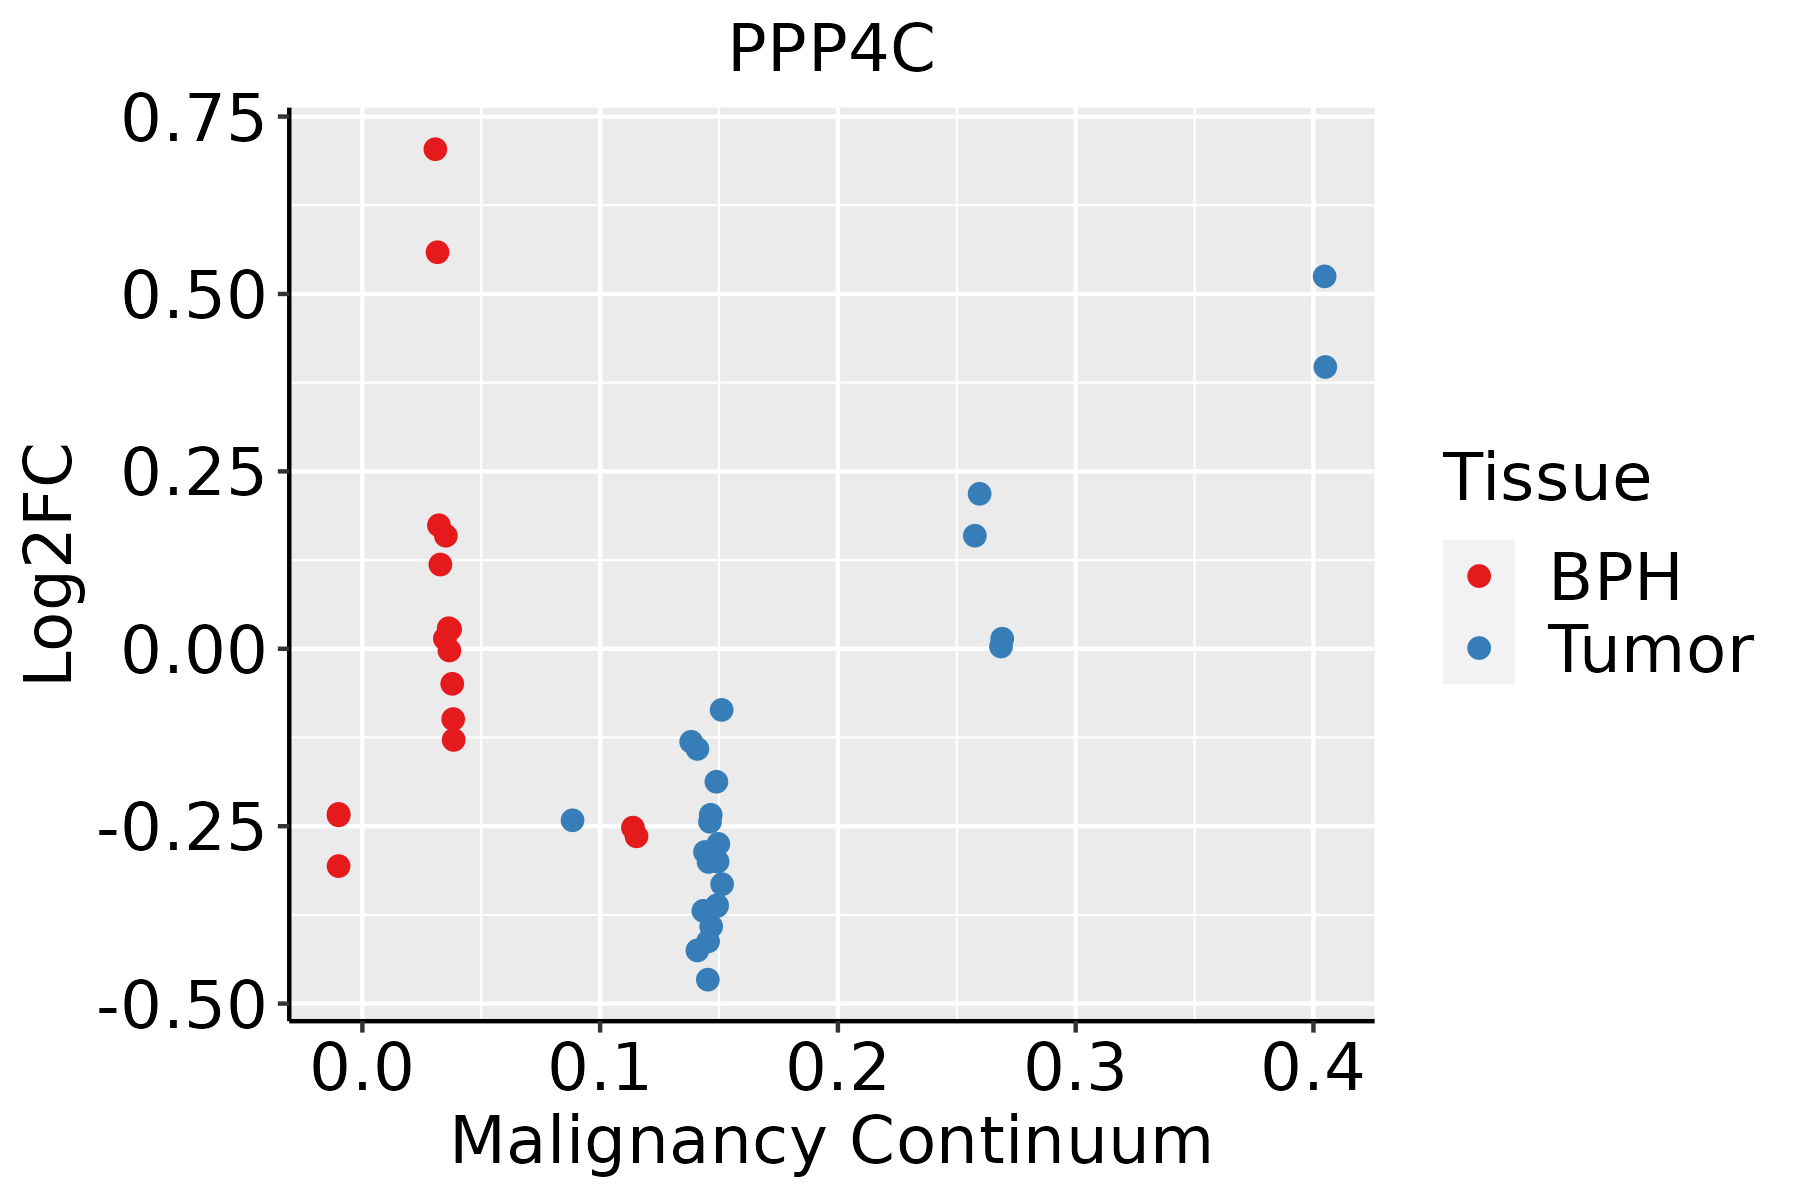 | BPH: Benign Prostatic Hyperplasia |
| Skin | 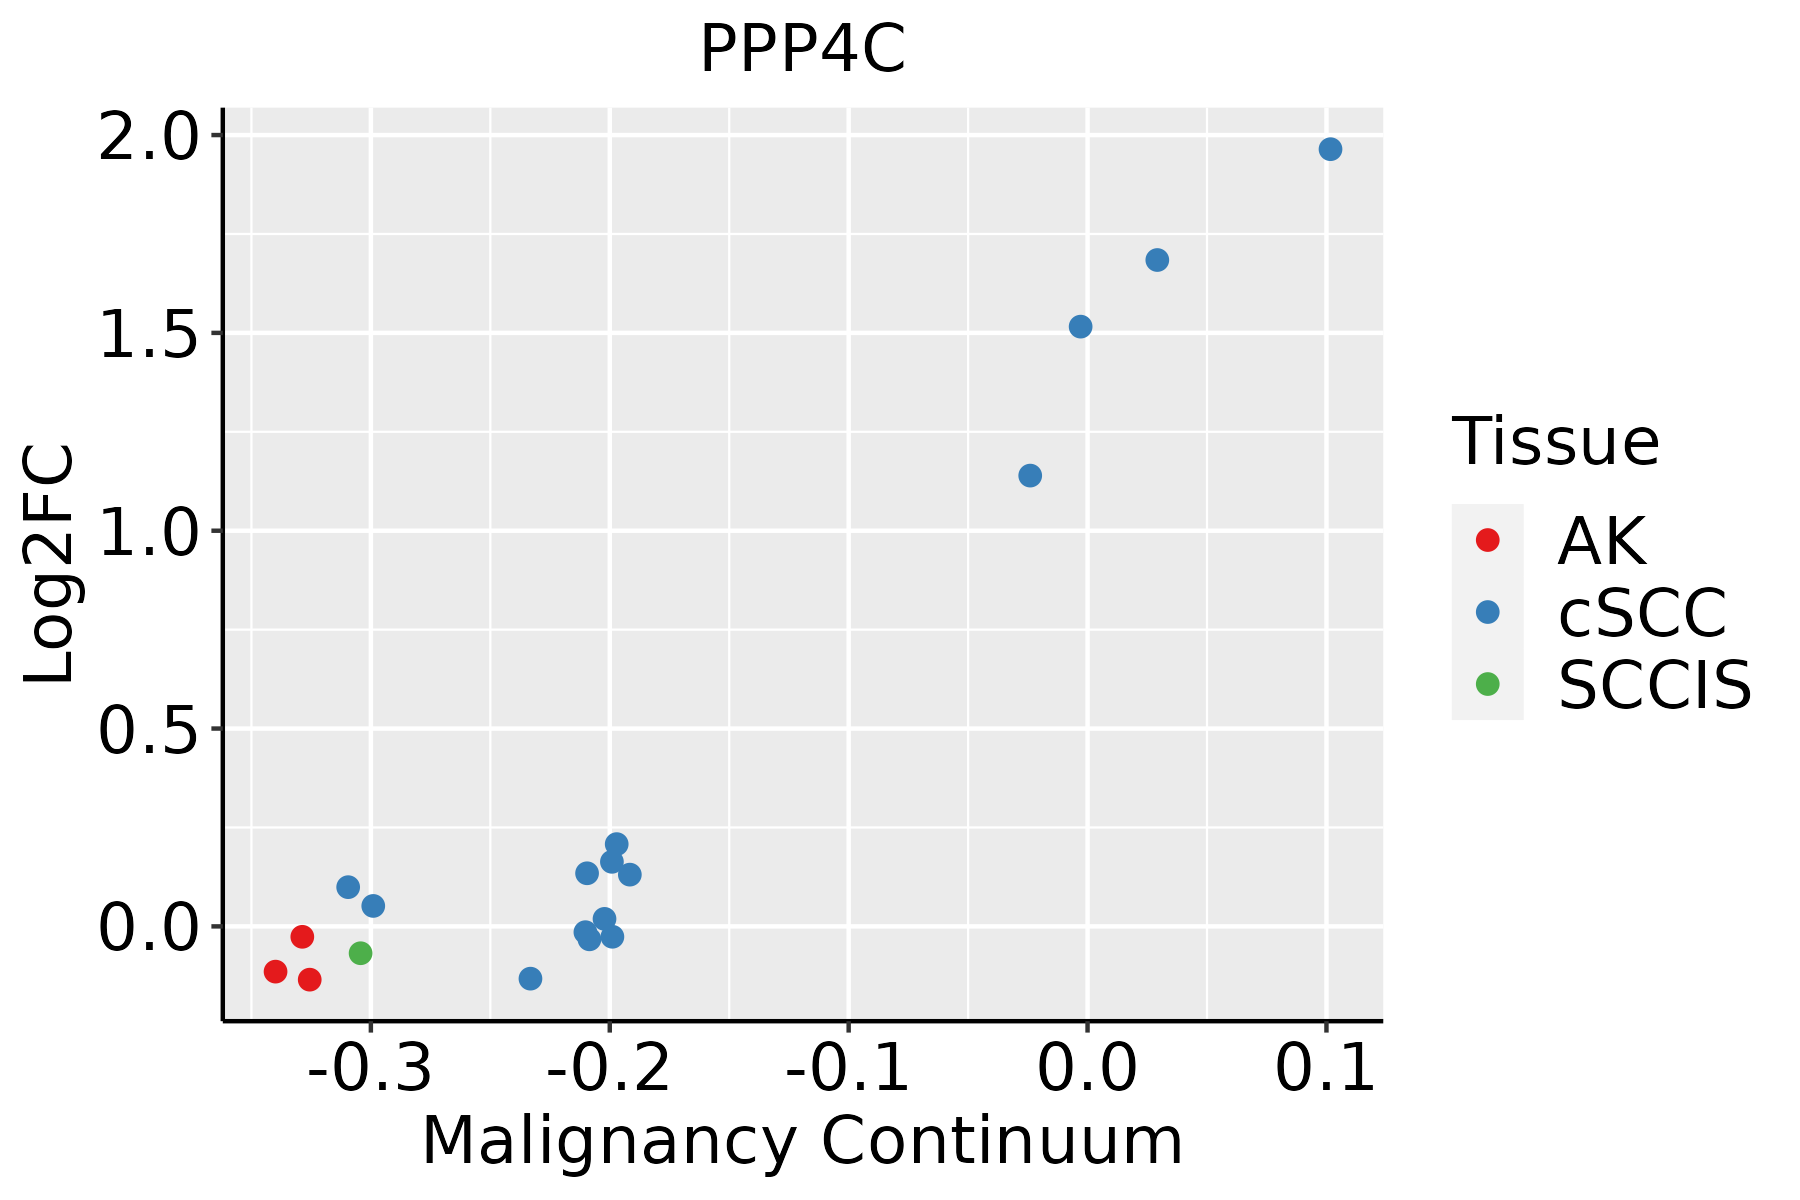 | AK: Actinic keratosis |
| cSCC: Cutaneous squamous cell carcinoma | ||
| SCCIS:squamous cell carcinoma in situ | ||
| Thyroid |  | ATC: Anaplastic thyroid cancer |
| HT: Hashimoto's thyroiditis | ||
| PTC: Papillary thyroid cancer |
| ∗log2FC in expression of this searched gene in stem-like cells from each diseased tissue sample relative to stem-like cells in normal samples in each tissue plotted against the malignancy continuum. Samples are colored based on if they are from different disease stage. |
Top |
Malignant transformation related pathway analysis |
| Find out the enriched GO biological processes and KEGG pathways involved in transition from healthy to precancer to cancer |
| Tissue | Disease Stage | Enriched GO biological Processes |
| Colorectum | AD |  |
| Colorectum | SER |  |
| Colorectum | MSS |  |
| Colorectum | MSI-H |  |
| Colorectum | FAP |  |
| ∗Top 15 enriched GO BP terms are showed in the bar plot of each disease state in each tissue. Each row represents a significant GO biological process which is colored according to the -log10(p.adjust). |
| Page: 1 2 3 4 5 6 7 8 9 |
| GO ID | Tissue | Disease Stage | Description | Gene Ratio | Bg Ratio | pvalue | p.adjust | Count |
| GO:20010208 | Breast | Precancer | regulation of response to DNA damage stimulus | 24/1080 | 219/18723 | 1.93e-03 | 1.87e-02 | 24 |
| GO:200102013 | Breast | IDC | regulation of response to DNA damage stimulus | 30/1434 | 219/18723 | 1.36e-03 | 1.40e-02 | 30 |
| GO:200102023 | Breast | DCIS | regulation of response to DNA damage stimulus | 30/1390 | 219/18723 | 8.32e-04 | 9.47e-03 | 30 |
| GO:0051052 | Colorectum | AD | regulation of DNA metabolic process | 116/3918 | 359/18723 | 2.47e-07 | 1.00e-05 | 116 |
| GO:0016311 | Colorectum | AD | dephosphorylation | 123/3918 | 417/18723 | 1.84e-05 | 3.82e-04 | 123 |
| GO:0006470 | Colorectum | AD | protein dephosphorylation | 88/3918 | 281/18723 | 2.56e-05 | 4.89e-04 | 88 |
| GO:2001020 | Colorectum | AD | regulation of response to DNA damage stimulus | 71/3918 | 219/18723 | 4.38e-05 | 7.65e-04 | 71 |
| GO:0006282 | Colorectum | AD | regulation of DNA repair | 42/3918 | 130/18723 | 1.57e-03 | 1.32e-02 | 42 |
| GO:00510521 | Colorectum | SER | regulation of DNA metabolic process | 83/2897 | 359/18723 | 8.03e-05 | 1.77e-03 | 83 |
| GO:00064701 | Colorectum | SER | protein dephosphorylation | 65/2897 | 281/18723 | 4.44e-04 | 6.51e-03 | 65 |
| GO:00163111 | Colorectum | SER | dephosphorylation | 86/2897 | 417/18723 | 2.73e-03 | 2.46e-02 | 86 |
| GO:20010201 | Colorectum | SER | regulation of response to DNA damage stimulus | 49/2897 | 219/18723 | 4.24e-03 | 3.45e-02 | 49 |
| GO:00510522 | Colorectum | MSS | regulation of DNA metabolic process | 108/3467 | 359/18723 | 5.86e-08 | 3.10e-06 | 108 |
| GO:20010202 | Colorectum | MSS | regulation of response to DNA damage stimulus | 64/3467 | 219/18723 | 7.20e-05 | 1.21e-03 | 64 |
| GO:00064702 | Colorectum | MSS | protein dephosphorylation | 73/3467 | 281/18723 | 1.15e-03 | 1.12e-02 | 73 |
| GO:00062821 | Colorectum | MSS | regulation of DNA repair | 38/3467 | 130/18723 | 1.93e-03 | 1.67e-02 | 38 |
| GO:00163112 | Colorectum | MSS | dephosphorylation | 101/3467 | 417/18723 | 1.98e-03 | 1.70e-02 | 101 |
| GO:0006302 | Colorectum | MSS | double-strand break repair | 64/3467 | 251/18723 | 3.58e-03 | 2.65e-02 | 64 |
| GO:00064709 | Endometrium | AEH | protein dephosphorylation | 50/2100 | 281/18723 | 6.41e-04 | 6.23e-03 | 50 |
| GO:200102010 | Endometrium | AEH | regulation of response to DNA damage stimulus | 40/2100 | 219/18723 | 1.28e-03 | 1.09e-02 | 40 |
| Page: 1 2 3 4 5 |
| Pathway ID | Tissue | Disease Stage | Description | Gene Ratio | Bg Ratio | pvalue | p.adjust | qvalue | Count |
| hsa04922 | Colorectum | AD | Glucagon signaling pathway | 41/2092 | 107/8465 | 1.18e-03 | 7.75e-03 | 4.94e-03 | 41 |
| hsa049221 | Colorectum | AD | Glucagon signaling pathway | 41/2092 | 107/8465 | 1.18e-03 | 7.75e-03 | 4.94e-03 | 41 |
| hsa049222 | Colorectum | SER | Glucagon signaling pathway | 38/1580 | 107/8465 | 2.57e-05 | 3.28e-04 | 2.38e-04 | 38 |
| hsa049223 | Colorectum | SER | Glucagon signaling pathway | 38/1580 | 107/8465 | 2.57e-05 | 3.28e-04 | 2.38e-04 | 38 |
| hsa049224 | Colorectum | MSS | Glucagon signaling pathway | 39/1875 | 107/8465 | 5.00e-04 | 3.45e-03 | 2.11e-03 | 39 |
| hsa049225 | Colorectum | MSS | Glucagon signaling pathway | 39/1875 | 107/8465 | 5.00e-04 | 3.45e-03 | 2.11e-03 | 39 |
| hsa0492214 | Esophagus | ESCC | Glucagon signaling pathway | 64/4205 | 107/8465 | 2.18e-02 | 4.80e-02 | 2.46e-02 | 64 |
| hsa0492215 | Esophagus | ESCC | Glucagon signaling pathway | 64/4205 | 107/8465 | 2.18e-02 | 4.80e-02 | 2.46e-02 | 64 |
| hsa0492221 | Liver | Cirrhotic | Glucagon signaling pathway | 43/2530 | 107/8465 | 1.42e-02 | 4.35e-02 | 2.68e-02 | 43 |
| hsa0492231 | Liver | Cirrhotic | Glucagon signaling pathway | 43/2530 | 107/8465 | 1.42e-02 | 4.35e-02 | 2.68e-02 | 43 |
| hsa0492241 | Liver | HCC | Glucagon signaling pathway | 64/4020 | 107/8465 | 6.70e-03 | 1.87e-02 | 1.04e-02 | 64 |
| hsa0492251 | Liver | HCC | Glucagon signaling pathway | 64/4020 | 107/8465 | 6.70e-03 | 1.87e-02 | 1.04e-02 | 64 |
| hsa0492212 | Prostate | BPH | Glucagon signaling pathway | 32/1718 | 107/8465 | 1.13e-02 | 3.43e-02 | 2.12e-02 | 32 |
| hsa0492213 | Prostate | BPH | Glucagon signaling pathway | 32/1718 | 107/8465 | 1.13e-02 | 3.43e-02 | 2.12e-02 | 32 |
| Page: 1 |
Top |
Cell-cell communication analysis |
| Identification of potential cell-cell interactions between two cell types and their ligand-receptor pairs for different disease states |
| Ligand | Receptor | LRpair | Pathway | Tissue | Disease Stage |
| Page: 1 |
Top |
Single-cell gene regulatory network inference analysis |
| Find out the significant the regulons (TFs) and the target genes of each regulon across cell types for different disease states |
| TF | Cell Type | Tissue | Disease Stage | Target Gene | RSS | Regulon Activity |
| ∗The dot plots of a searched regulon are shown for all cell subpopulations in each disease state of each tissue based on the regulon specific score inferred using pySCENIC and by calculating the average expression. |
| Page: 1 |
Top |
Somatic mutation of malignant transformation related genes |
| Annotation of somatic variants for genes involved in malignant transformation |
| Hugo Symbol | Variant Class | Variant Classification | dbSNP RS | HGVSc | HGVSp | HGVSp Short | SWISSPROT | BIOTYPE | SIFT | PolyPhen | Tumor Sample Barcode | Tissue | Histology | Sex | Age | Stage | Therapy Types | Drugs | Outcome |
| PPP4C | SNV | Missense_Mutation | c.357G>C | p.Gln119His | p.Q119H | P60510 | protein_coding | deleterious(0) | possibly_damaging(0.889) | TCGA-A2-A0YD-01 | Breast | breast invasive carcinoma | Female | <65 | I/II | Chemotherapy | cytoxan | SD | |
| PPP4C | SNV | Missense_Mutation | c.578G>A | p.Cys193Tyr | p.C193Y | P60510 | protein_coding | deleterious(0) | probably_damaging(0.998) | TCGA-AZ-6598-01 | Colorectum | colon adenocarcinoma | Female | >=65 | I/II | Unknown | Unknown | SD | |
| PPP4C | SNV | Missense_Mutation | c.365N>G | p.Gln122Arg | p.Q122R | P60510 | protein_coding | deleterious(0) | possibly_damaging(0.679) | TCGA-CM-6169-01 | Colorectum | colon adenocarcinoma | Male | >=65 | I/II | Ancillary | leucovorin | SD | |
| PPP4C | SNV | Missense_Mutation | c.850N>G | p.Ile284Val | p.I284V | P60510 | protein_coding | tolerated(0.56) | benign(0) | TCGA-DM-A1HB-01 | Colorectum | colon adenocarcinoma | Male | >=65 | III/IV | Unknown | Unknown | SD | |
| PPP4C | SNV | Missense_Mutation | novel | c.856N>G | p.Phe286Val | p.F286V | P60510 | protein_coding | deleterious(0) | probably_damaging(0.985) | TCGA-A5-A0G2-01 | Endometrium | uterine corpus endometrioid carcinoma | Female | <65 | III/IV | Unknown | Unknown | SD |
| PPP4C | SNV | Missense_Mutation | rs546535681 | c.274G>A | p.Glu92Lys | p.E92K | P60510 | protein_coding | deleterious(0) | probably_damaging(0.999) | TCGA-A5-A2K5-01 | Endometrium | uterine corpus endometrioid carcinoma | Female | >=65 | I/II | Unknown | Unknown | SD |
| PPP4C | SNV | Missense_Mutation | rs546535681 | c.274N>A | p.Glu92Lys | p.E92K | P60510 | protein_coding | deleterious(0) | probably_damaging(0.999) | TCGA-AJ-A5DW-01 | Endometrium | uterine corpus endometrioid carcinoma | Female | <65 | I/II | Unknown | Unknown | SD |
| PPP4C | SNV | Missense_Mutation | c.394N>T | p.Arg132Cys | p.R132C | P60510 | protein_coding | deleterious(0) | probably_damaging(0.99) | TCGA-AP-A054-01 | Endometrium | uterine corpus endometrioid carcinoma | Female | <65 | III/IV | Chemotherapy | carboplatin | PD | |
| PPP4C | SNV | Missense_Mutation | rs546535681 | c.274N>A | p.Glu92Lys | p.E92K | P60510 | protein_coding | deleterious(0) | probably_damaging(0.999) | TCGA-AP-A056-01 | Endometrium | uterine corpus endometrioid carcinoma | Female | <65 | I/II | Unknown | Unknown | SD |
| PPP4C | SNV | Missense_Mutation | novel | c.80N>T | p.Ala27Val | p.A27V | P60510 | protein_coding | tolerated(0.27) | benign(0) | TCGA-AX-A1CE-01 | Endometrium | uterine corpus endometrioid carcinoma | Female | <65 | I/II | Unspecific | Paclitaxel | SD |
| Page: 1 2 3 |
Top |
Related drugs of malignant transformation related genes |
| Identification of chemicals and drugs interact with genes involved in malignant transfromation |
| (DGIdb 4.0) |
| Entrez ID | Symbol | Category | Interaction Types | Drug Claim Name | Drug Name | PMIDs |
| Page: 1 |

Copyright 2023-Present -The University of Texas Health Science Center at Houston |