
|
|||||
|
 | |
| |
| |
| |
| |
| |
|
Gene: PPP3R1 |
Gene summary for PPP3R1 |
| Gene information | Species | Human | Gene symbol | PPP3R1 | Gene ID | 5534 |
| Gene name | protein phosphatase 3 regulatory subunit B, alpha | |
| Gene Alias | CALNB1 | |
| Cytomap | 2p14 | |
| Gene Type | protein-coding | GO ID | GO:0001525 | UniProtAcc | P63098 |
Top |
Malignant transformation analysis |
| Identification of the aberrant gene expression in precancerous and cancerous lesions by comparing the gene expression of stem-like cells in diseased tissues with normal stem cells |
| Entrez ID | Symbol | Replicates | Species | Organ | Tissue | Adj P-value | Log2FC | Malignancy |
| 5534 | PPP3R1 | AEH-subject1 | Human | Endometrium | AEH | 3.29e-14 | 4.65e-01 | -0.3059 |
| 5534 | PPP3R1 | AEH-subject2 | Human | Endometrium | AEH | 2.91e-06 | 3.77e-01 | -0.2525 |
| 5534 | PPP3R1 | AEH-subject3 | Human | Endometrium | AEH | 2.40e-06 | 3.49e-01 | -0.2576 |
| 5534 | PPP3R1 | AEH-subject4 | Human | Endometrium | AEH | 1.14e-04 | 3.63e-01 | -0.2657 |
| 5534 | PPP3R1 | AEH-subject5 | Human | Endometrium | AEH | 1.72e-19 | 5.97e-01 | -0.2953 |
| 5534 | PPP3R1 | EEC-subject1 | Human | Endometrium | EEC | 1.18e-12 | 5.02e-01 | -0.2682 |
| 5534 | PPP3R1 | EEC-subject3 | Human | Endometrium | EEC | 2.09e-02 | 2.10e-01 | -0.2525 |
| 5534 | PPP3R1 | GSM6177620_NYU_UCEC1_lib1_lib1 | Human | Endometrium | EEC | 4.88e-03 | 9.77e-02 | -0.1869 |
| 5534 | PPP3R1 | GSM6177620_NYU_UCEC1_lib2_lib2 | Human | Endometrium | EEC | 2.45e-05 | 4.03e-02 | -0.1875 |
| 5534 | PPP3R1 | GSM6177620_NYU_UCEC1_lib3_lib3 | Human | Endometrium | EEC | 1.21e-04 | 6.52e-02 | -0.1883 |
| 5534 | PPP3R1 | GSM6177622_NYU_UCEC3_lib1_lib1 | Human | Endometrium | EEC | 2.38e-05 | 1.02e-01 | -0.1917 |
| 5534 | PPP3R1 | GSM6177622_NYU_UCEC3_lib2_lib2 | Human | Endometrium | EEC | 1.38e-07 | 9.63e-02 | -0.1916 |
| 5534 | PPP3R1 | LZE4T | Human | Esophagus | ESCC | 5.99e-03 | 2.22e-02 | 0.0811 |
| 5534 | PPP3R1 | LZE24T | Human | Esophagus | ESCC | 1.08e-14 | 1.77e-01 | 0.0596 |
| 5534 | PPP3R1 | P1T-E | Human | Esophagus | ESCC | 2.58e-04 | 4.30e-01 | 0.0875 |
| 5534 | PPP3R1 | P2T-E | Human | Esophagus | ESCC | 8.15e-44 | 7.82e-01 | 0.1177 |
| 5534 | PPP3R1 | P4T-E | Human | Esophagus | ESCC | 6.56e-22 | 4.65e-01 | 0.1323 |
| 5534 | PPP3R1 | P5T-E | Human | Esophagus | ESCC | 3.84e-08 | 2.11e-01 | 0.1327 |
| 5534 | PPP3R1 | P8T-E | Human | Esophagus | ESCC | 2.56e-15 | 1.43e-01 | 0.0889 |
| 5534 | PPP3R1 | P9T-E | Human | Esophagus | ESCC | 5.49e-07 | 1.50e-01 | 0.1131 |
| Page: 1 2 3 4 5 6 |
| Tissue | Expression Dynamics | Abbreviation |
| Endometrium | 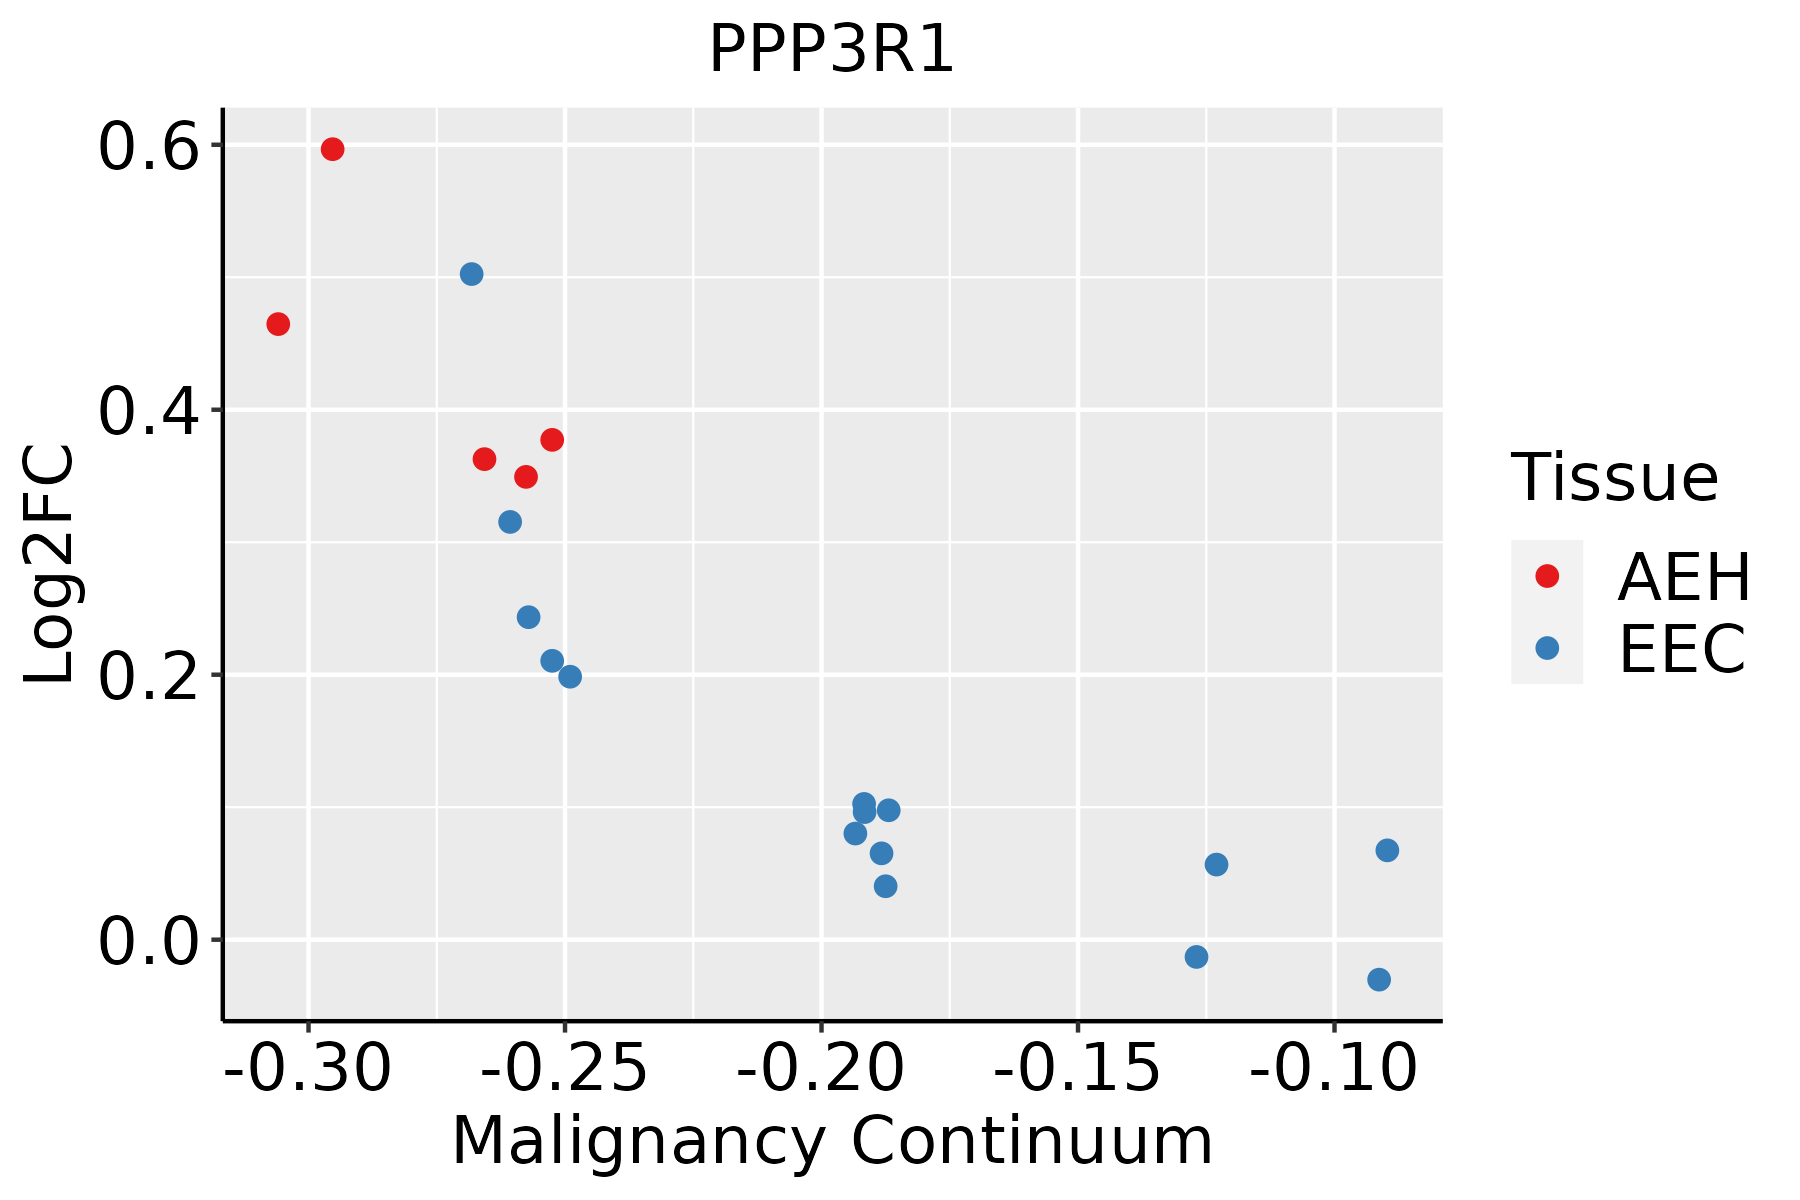 | AEH: Atypical endometrial hyperplasia |
| EEC: Endometrioid Cancer | ||
| Esophagus | 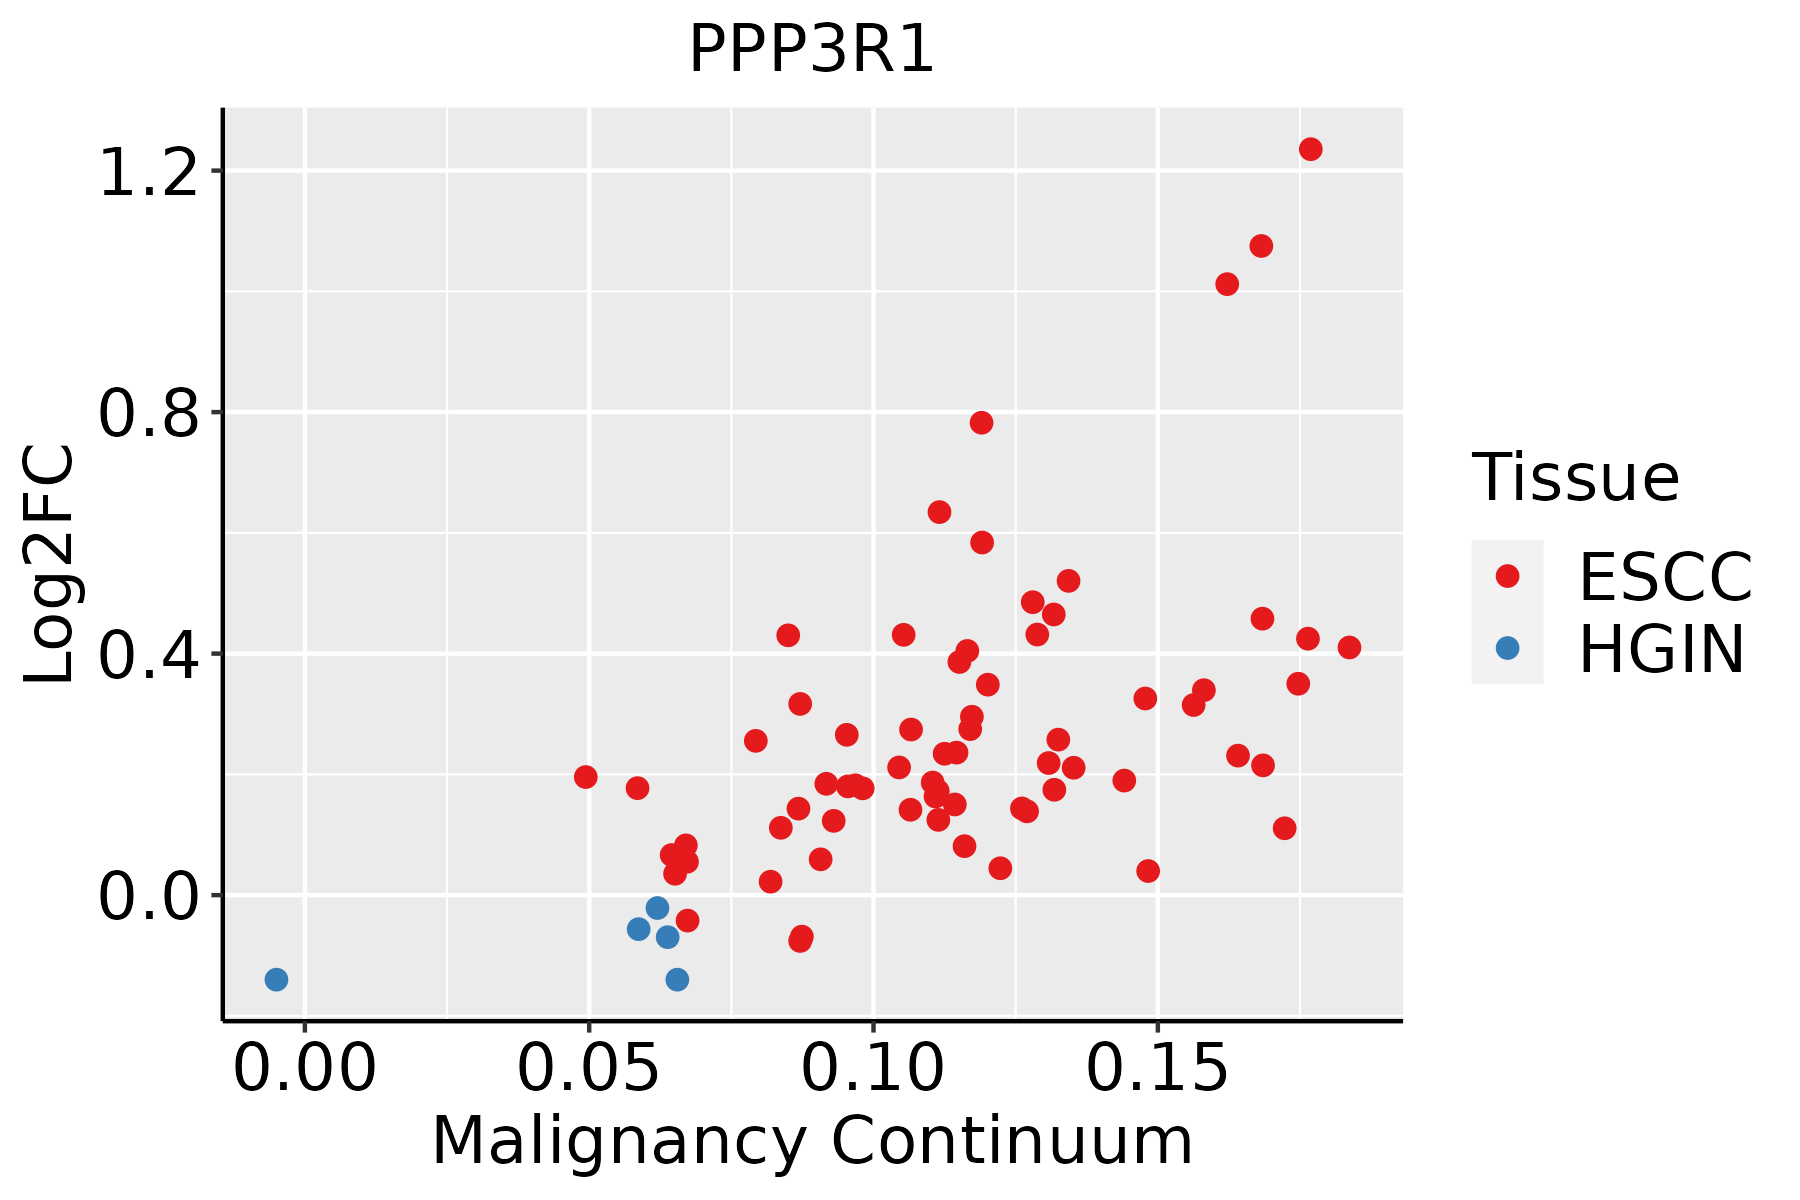 | ESCC: Esophageal squamous cell carcinoma |
| HGIN: High-grade intraepithelial neoplasias | ||
| LGIN: Low-grade intraepithelial neoplasias | ||
| Liver | 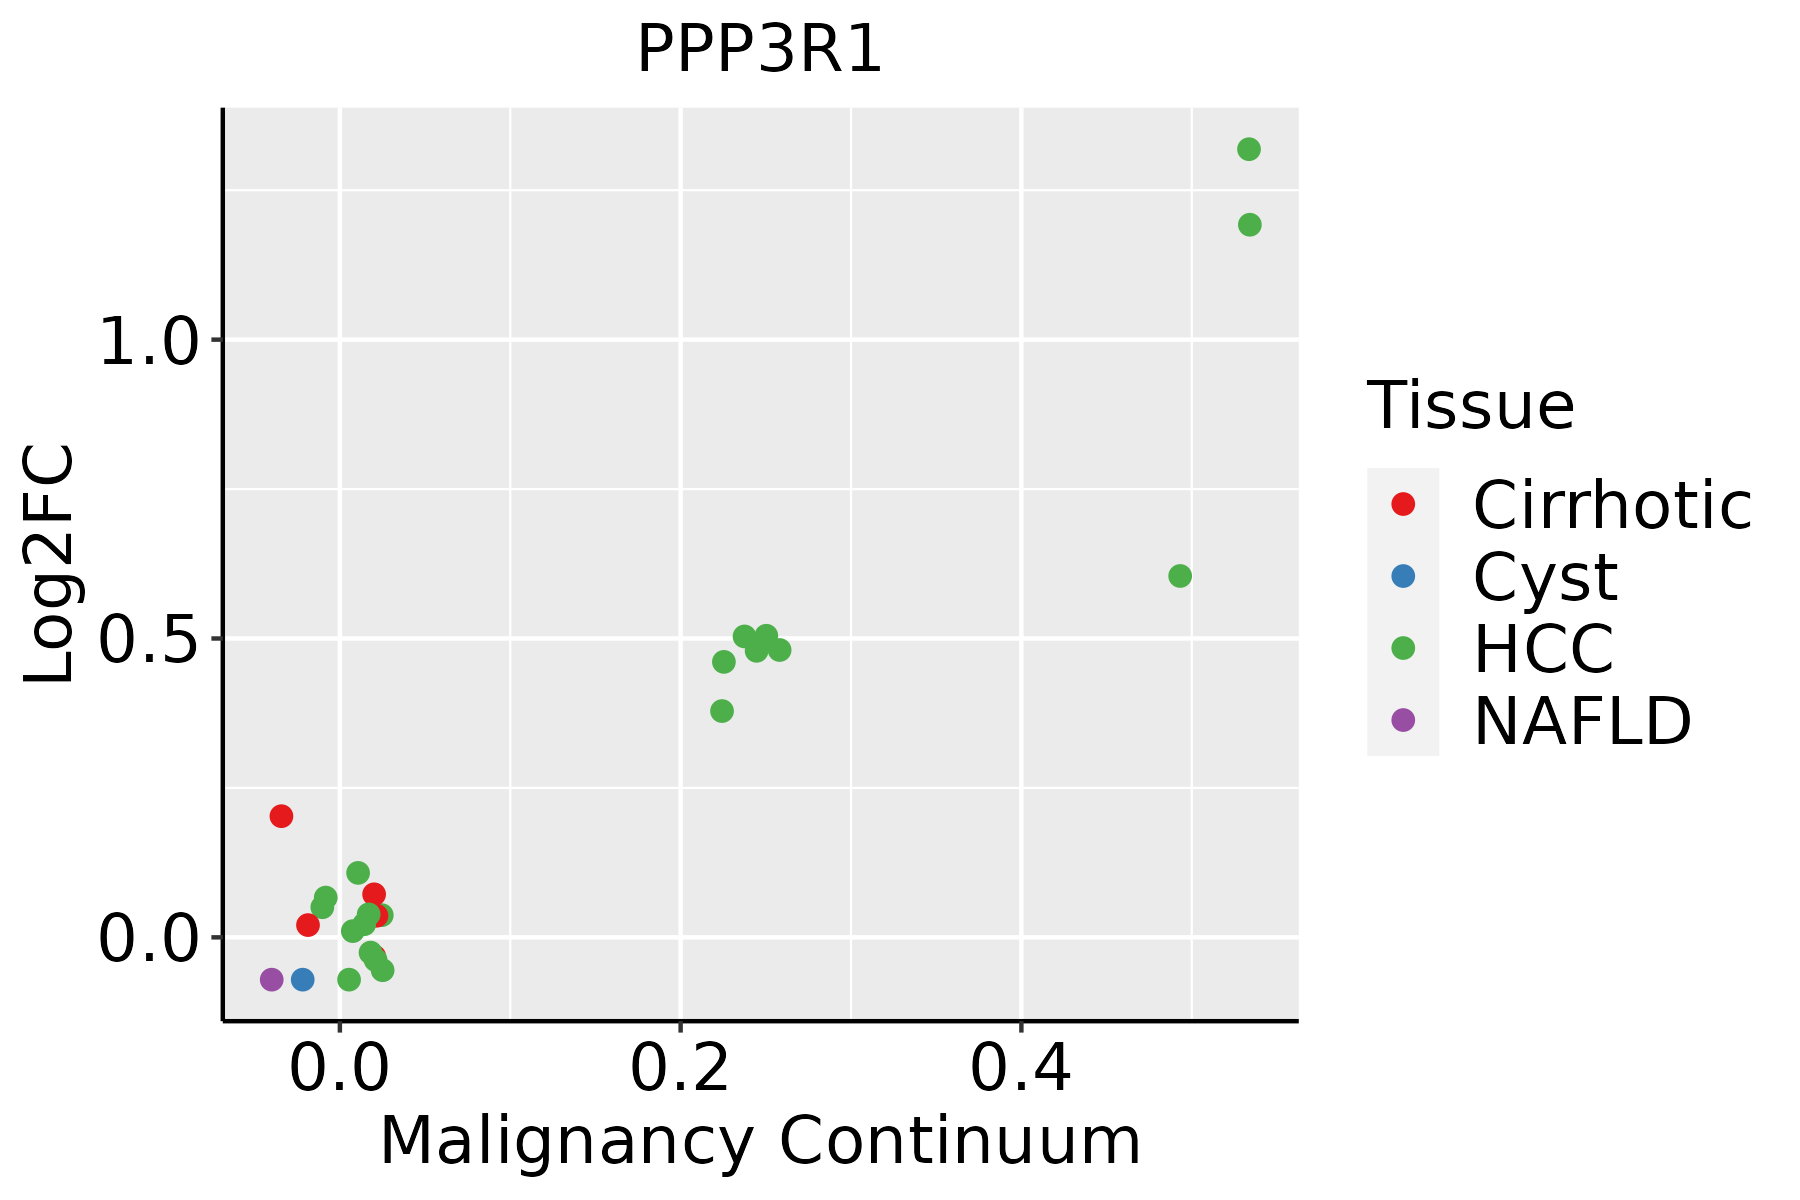 | HCC: Hepatocellular carcinoma |
| NAFLD: Non-alcoholic fatty liver disease | ||
| Lung | 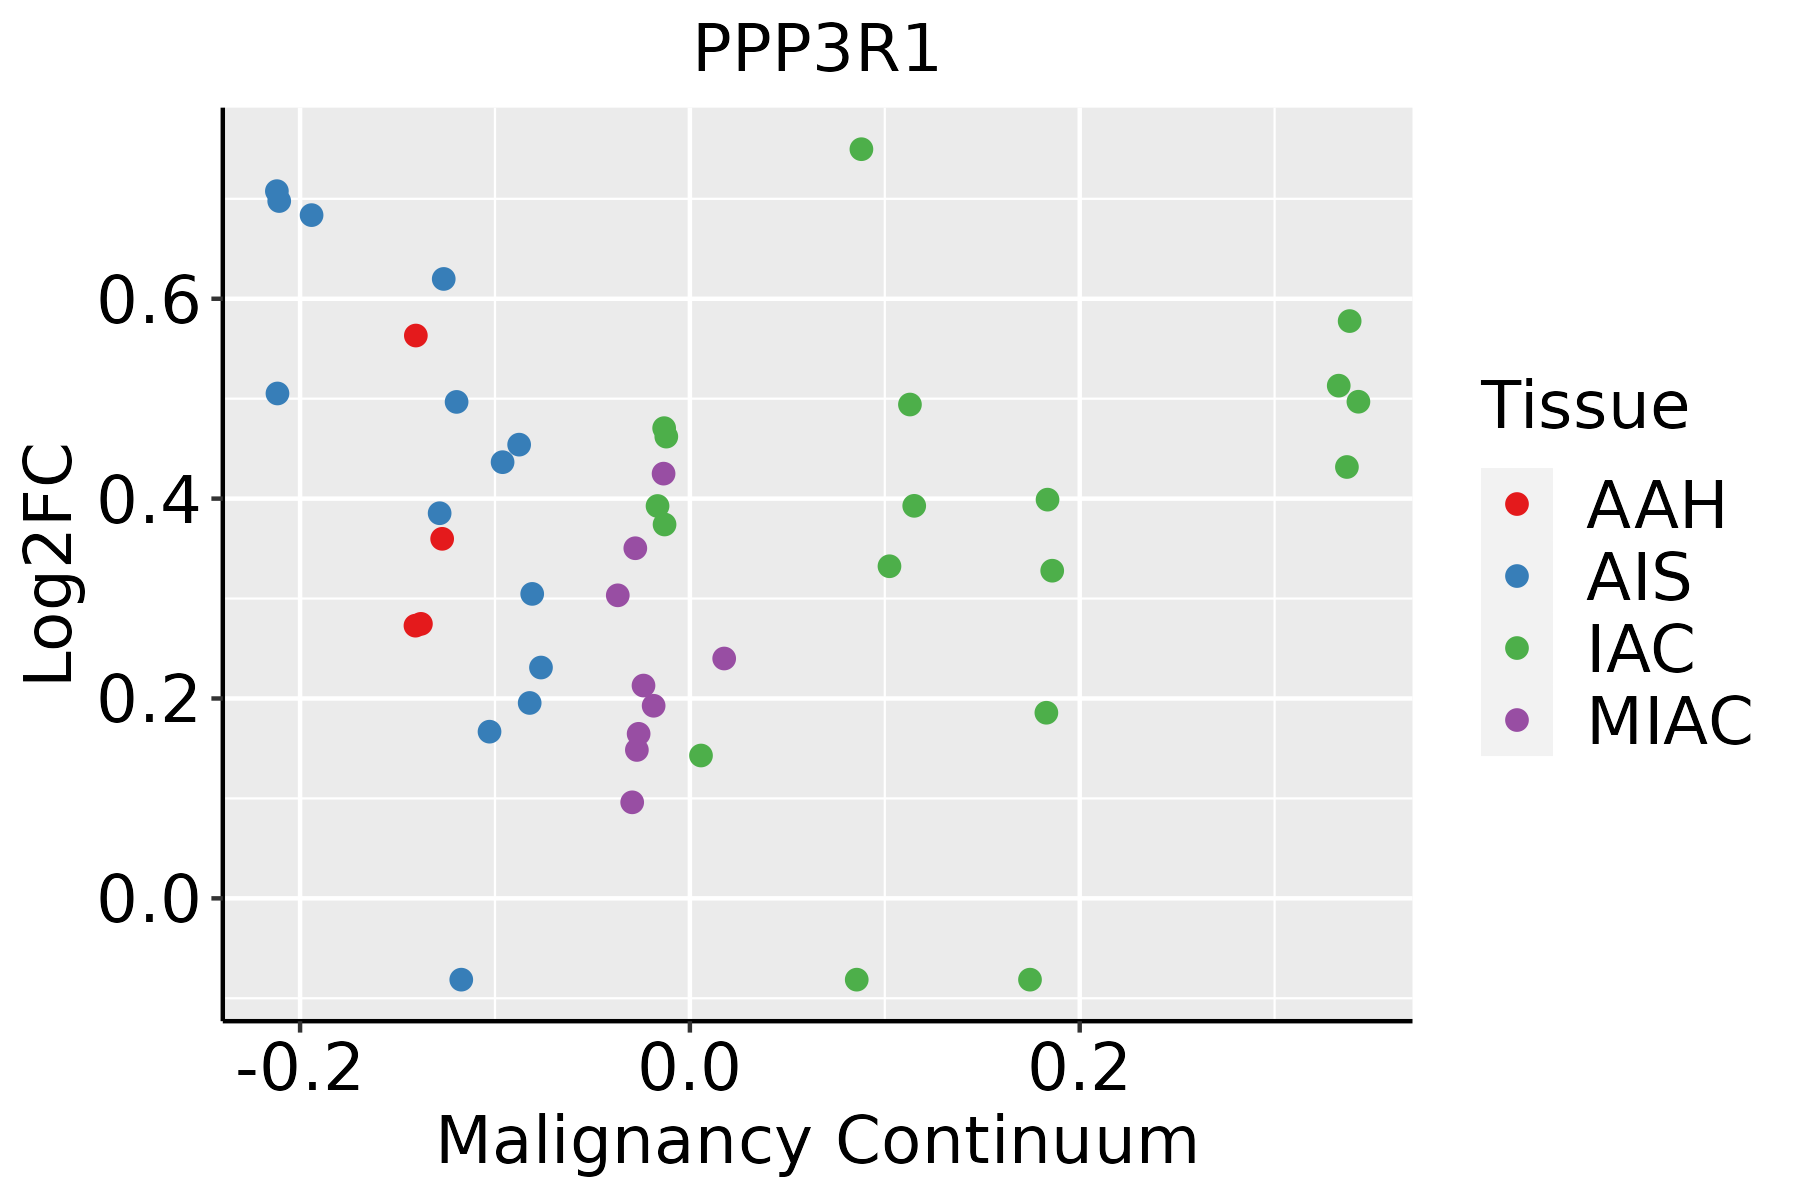 | AAH: Atypical adenomatous hyperplasia |
| AIS: Adenocarcinoma in situ | ||
| IAC: Invasive lung adenocarcinoma | ||
| MIA: Minimally invasive adenocarcinoma | ||
| Oral Cavity |  | EOLP: Erosive Oral lichen planus |
| LP: leukoplakia | ||
| NEOLP: Non-erosive oral lichen planus | ||
| OSCC: Oral squamous cell carcinoma | ||
| Prostate | 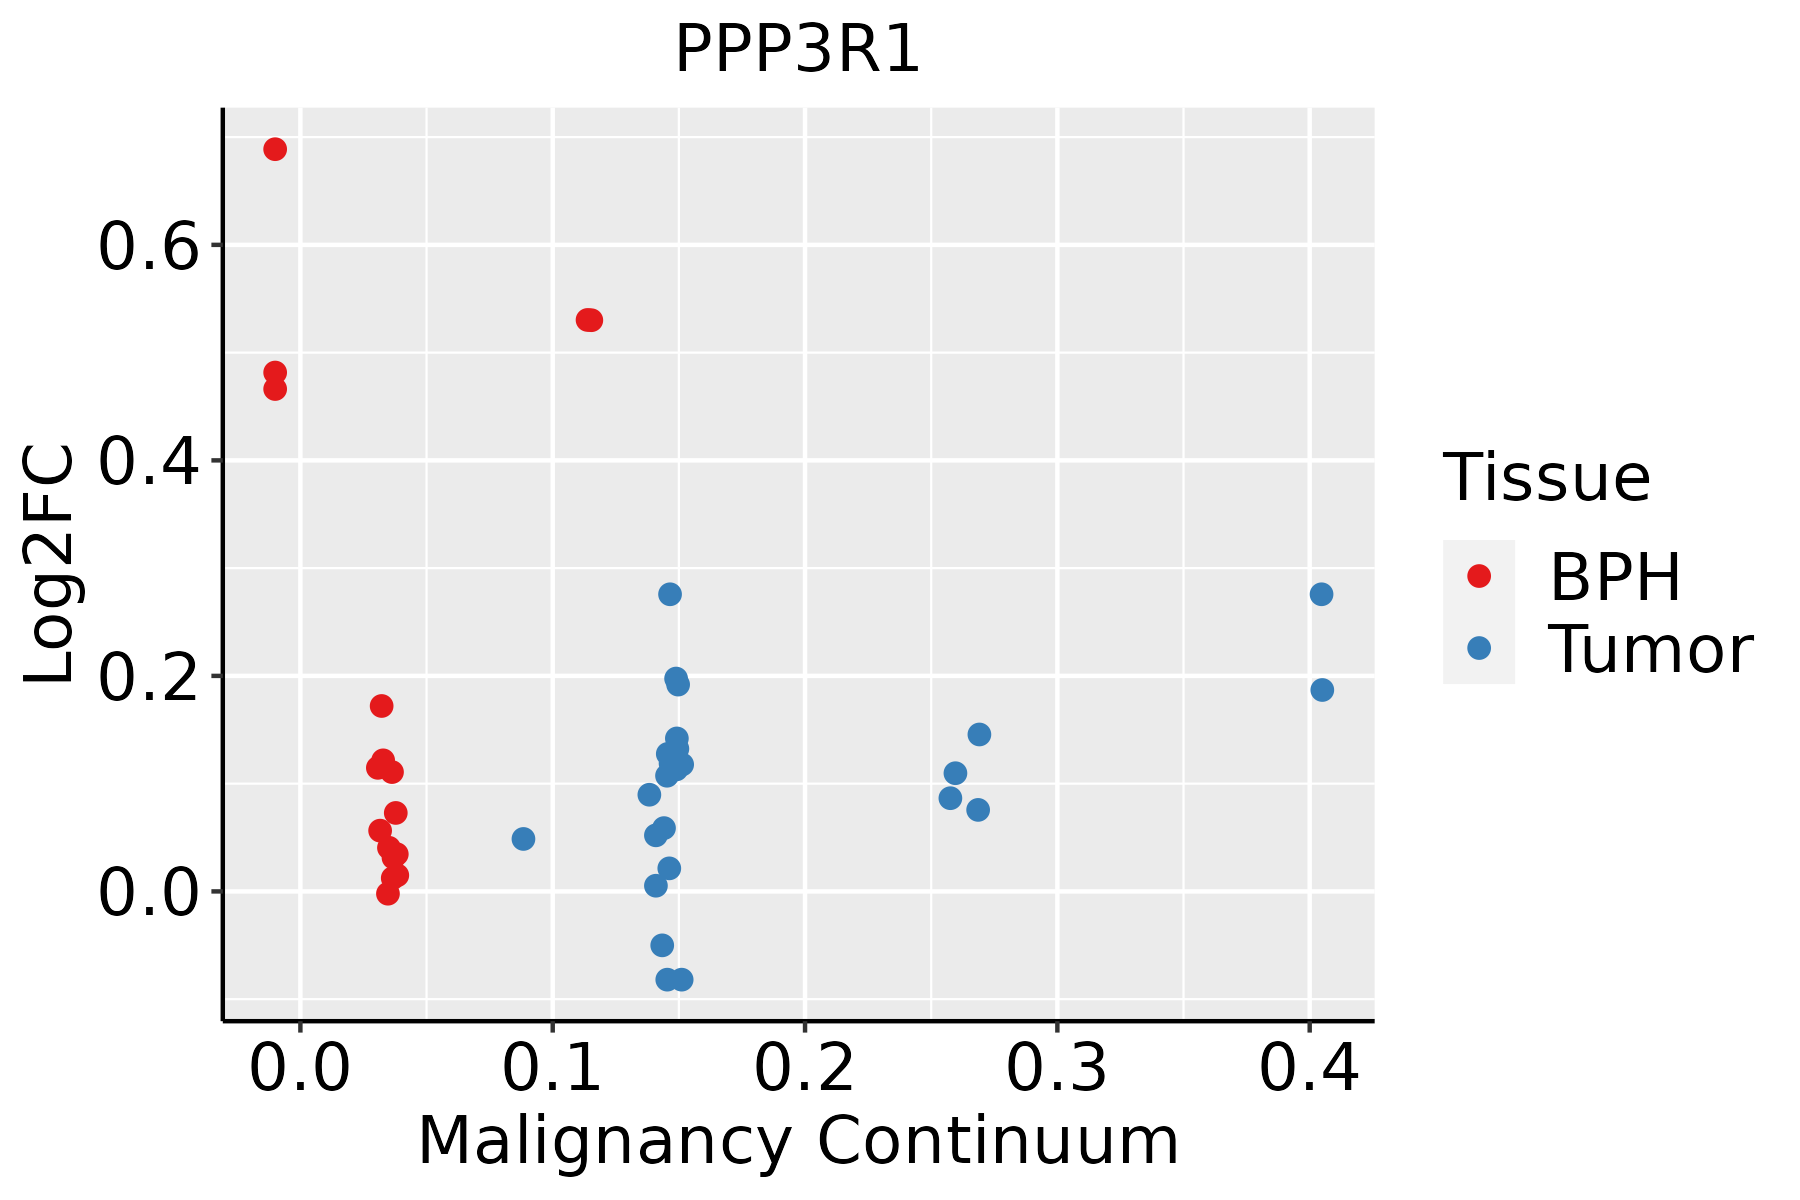 | BPH: Benign Prostatic Hyperplasia |
| ∗log2FC in expression of this searched gene in stem-like cells from each diseased tissue sample relative to stem-like cells in normal samples in each tissue plotted against the malignancy continuum. Samples are colored based on if they are from different disease stage. |
Top |
Malignant transformation related pathway analysis |
| Find out the enriched GO biological processes and KEGG pathways involved in transition from healthy to precancer to cancer |
| Tissue | Disease Stage | Enriched GO biological Processes |
| Colorectum | AD |  |
| Colorectum | SER |  |
| Colorectum | MSS |  |
| Colorectum | MSI-H |  |
| Colorectum | FAP |  |
| ∗Top 15 enriched GO BP terms are showed in the bar plot of each disease state in each tissue. Each row represents a significant GO biological process which is colored according to the -log10(p.adjust). |
| Page: 1 2 3 4 5 6 7 8 9 |
| GO ID | Tissue | Disease Stage | Description | Gene Ratio | Bg Ratio | pvalue | p.adjust | Count |
| GO:007259410 | Endometrium | AEH | establishment of protein localization to organelle | 89/2100 | 422/18723 | 2.41e-09 | 1.90e-07 | 89 |
| GO:00605627 | Endometrium | AEH | epithelial tube morphogenesis | 63/2100 | 325/18723 | 9.63e-06 | 2.23e-04 | 63 |
| GO:00345049 | Endometrium | AEH | protein localization to nucleus | 57/2100 | 290/18723 | 1.65e-05 | 3.42e-04 | 57 |
| GO:00611384 | Endometrium | AEH | morphogenesis of a branching epithelium | 40/2100 | 182/18723 | 2.16e-05 | 4.20e-04 | 40 |
| GO:00482598 | Endometrium | AEH | regulation of receptor-mediated endocytosis | 28/2100 | 110/18723 | 2.28e-05 | 4.35e-04 | 28 |
| GO:00017637 | Endometrium | AEH | morphogenesis of a branching structure | 42/2100 | 196/18723 | 2.58e-05 | 4.86e-04 | 42 |
| GO:00301009 | Endometrium | AEH | regulation of endocytosis | 44/2100 | 211/18723 | 3.39e-05 | 6.05e-04 | 44 |
| GO:00068988 | Endometrium | AEH | receptor-mediated endocytosis | 49/2100 | 244/18723 | 3.54e-05 | 6.24e-04 | 49 |
| GO:00487542 | Endometrium | AEH | branching morphogenesis of an epithelial tube | 33/2100 | 151/18723 | 1.22e-04 | 1.68e-03 | 33 |
| GO:00487625 | Endometrium | AEH | mesenchymal cell differentiation | 46/2100 | 236/18723 | 1.27e-04 | 1.74e-03 | 46 |
| GO:00604853 | Endometrium | AEH | mesenchyme development | 54/2100 | 291/18723 | 1.34e-04 | 1.83e-03 | 54 |
| GO:00431128 | Endometrium | AEH | receptor metabolic process | 35/2100 | 166/18723 | 1.64e-04 | 2.15e-03 | 35 |
| GO:00316237 | Endometrium | AEH | receptor internalization | 26/2100 | 113/18723 | 2.62e-04 | 3.08e-03 | 26 |
| GO:00018375 | Endometrium | AEH | epithelial to mesenchymal transition | 33/2100 | 157/18723 | 2.64e-04 | 3.09e-03 | 33 |
| GO:000691310 | Endometrium | AEH | nucleocytoplasmic transport | 54/2100 | 301/18723 | 3.24e-04 | 3.62e-03 | 54 |
| GO:005116910 | Endometrium | AEH | nuclear transport | 54/2100 | 301/18723 | 3.24e-04 | 3.62e-03 | 54 |
| GO:00064709 | Endometrium | AEH | protein dephosphorylation | 50/2100 | 281/18723 | 6.41e-04 | 6.23e-03 | 50 |
| GO:00020902 | Endometrium | AEH | regulation of receptor internalization | 15/2100 | 56/18723 | 9.88e-04 | 8.90e-03 | 15 |
| GO:00605414 | Endometrium | AEH | respiratory system development | 37/2100 | 203/18723 | 1.97e-03 | 1.54e-02 | 37 |
| GO:00303246 | Endometrium | AEH | lung development | 33/2100 | 177/18723 | 2.30e-03 | 1.74e-02 | 33 |
| Page: 1 2 3 4 5 6 7 8 9 10 11 12 13 14 15 |
| Pathway ID | Tissue | Disease Stage | Description | Gene Ratio | Bg Ratio | pvalue | p.adjust | qvalue | Count |
| hsa0502020 | Endometrium | AEH | Prion disease | 110/1197 | 273/8465 | 2.39e-27 | 2.44e-25 | 1.78e-25 | 110 |
| hsa0501420 | Endometrium | AEH | Amyotrophic lateral sclerosis | 123/1197 | 364/8465 | 2.17e-22 | 7.82e-21 | 5.72e-21 | 123 |
| hsa0501020 | Endometrium | AEH | Alzheimer disease | 124/1197 | 384/8465 | 1.20e-20 | 3.91e-19 | 2.86e-19 | 124 |
| hsa0502220 | Endometrium | AEH | Pathways of neurodegeneration - multiple diseases | 137/1197 | 476/8465 | 9.27e-18 | 2.32e-16 | 1.70e-16 | 137 |
| hsa0516626 | Endometrium | AEH | Human T-cell leukemia virus 1 infection | 50/1197 | 222/8465 | 4.30e-04 | 3.11e-03 | 2.27e-03 | 50 |
| hsa0516725 | Endometrium | AEH | Kaposi sarcoma-associated herpesvirus infection | 44/1197 | 194/8465 | 7.97e-04 | 5.28e-03 | 3.87e-03 | 44 |
| hsa0421816 | Endometrium | AEH | Cellular senescence | 37/1197 | 156/8465 | 8.49e-04 | 5.52e-03 | 4.04e-03 | 37 |
| hsa0541726 | Endometrium | AEH | Lipid and atherosclerosis | 47/1197 | 215/8465 | 1.24e-03 | 7.62e-03 | 5.58e-03 | 47 |
| hsa0436010 | Endometrium | AEH | Axon guidance | 39/1197 | 182/8465 | 4.47e-03 | 2.46e-02 | 1.80e-02 | 39 |
| hsa0431010 | Endometrium | AEH | Wnt signaling pathway | 37/1197 | 171/8465 | 4.68e-03 | 2.53e-02 | 1.86e-02 | 37 |
| hsa0517018 | Endometrium | AEH | Human immunodeficiency virus 1 infection | 43/1197 | 212/8465 | 8.19e-03 | 4.22e-02 | 3.09e-02 | 43 |
| hsa0516320 | Endometrium | AEH | Human cytomegalovirus infection | 45/1197 | 225/8465 | 8.98e-03 | 4.56e-02 | 3.34e-02 | 45 |
| hsa05020110 | Endometrium | AEH | Prion disease | 110/1197 | 273/8465 | 2.39e-27 | 2.44e-25 | 1.78e-25 | 110 |
| hsa05014110 | Endometrium | AEH | Amyotrophic lateral sclerosis | 123/1197 | 364/8465 | 2.17e-22 | 7.82e-21 | 5.72e-21 | 123 |
| hsa05010110 | Endometrium | AEH | Alzheimer disease | 124/1197 | 384/8465 | 1.20e-20 | 3.91e-19 | 2.86e-19 | 124 |
| hsa05022110 | Endometrium | AEH | Pathways of neurodegeneration - multiple diseases | 137/1197 | 476/8465 | 9.27e-18 | 2.32e-16 | 1.70e-16 | 137 |
| hsa05166111 | Endometrium | AEH | Human T-cell leukemia virus 1 infection | 50/1197 | 222/8465 | 4.30e-04 | 3.11e-03 | 2.27e-03 | 50 |
| hsa05167111 | Endometrium | AEH | Kaposi sarcoma-associated herpesvirus infection | 44/1197 | 194/8465 | 7.97e-04 | 5.28e-03 | 3.87e-03 | 44 |
| hsa0421817 | Endometrium | AEH | Cellular senescence | 37/1197 | 156/8465 | 8.49e-04 | 5.52e-03 | 4.04e-03 | 37 |
| hsa05417111 | Endometrium | AEH | Lipid and atherosclerosis | 47/1197 | 215/8465 | 1.24e-03 | 7.62e-03 | 5.58e-03 | 47 |
| Page: 1 2 3 4 5 6 7 8 9 10 11 12 13 14 15 16 17 18 19 |
Top |
Cell-cell communication analysis |
| Identification of potential cell-cell interactions between two cell types and their ligand-receptor pairs for different disease states |
| Ligand | Receptor | LRpair | Pathway | Tissue | Disease Stage |
| Page: 1 |
Top |
Single-cell gene regulatory network inference analysis |
| Find out the significant the regulons (TFs) and the target genes of each regulon across cell types for different disease states |
| TF | Cell Type | Tissue | Disease Stage | Target Gene | RSS | Regulon Activity |
| ∗The dot plots of a searched regulon are shown for all cell subpopulations in each disease state of each tissue based on the regulon specific score inferred using pySCENIC and by calculating the average expression. |
| Page: 1 |
Top |
Somatic mutation of malignant transformation related genes |
| Annotation of somatic variants for genes involved in malignant transformation |
| Hugo Symbol | Variant Class | Variant Classification | dbSNP RS | HGVSc | HGVSp | HGVSp Short | SWISSPROT | BIOTYPE | SIFT | PolyPhen | Tumor Sample Barcode | Tissue | Histology | Sex | Age | Stage | Therapy Types | Drugs | Outcome |
| PPP3R1 | SNV | Missense_Mutation | c.362G>A | p.Gly121Glu | p.G121E | P63098 | protein_coding | deleterious(0) | probably_damaging(0.992) | TCGA-BH-A1FL-01 | Breast | breast invasive carcinoma | Female | >=65 | I/II | Unknown | Unknown | PD | |
| PPP3R1 | SNV | Missense_Mutation | novel | c.299A>G | p.Asp100Gly | p.D100G | P63098 | protein_coding | deleterious(0) | probably_damaging(1) | TCGA-AA-3984-01 | Colorectum | colon adenocarcinoma | Female | <65 | I/II | Unknown | Unknown | SD |
| PPP3R1 | SNV | Missense_Mutation | novel | c.187N>A | p.Asp63Asn | p.D63N | P63098 | protein_coding | deleterious(0.04) | probably_damaging(0.97) | TCGA-AZ-4315-01 | Colorectum | colon adenocarcinoma | Male | <65 | I/II | Unknown | Unknown | SD |
| PPP3R1 | SNV | Missense_Mutation | c.259N>T | p.Asp87Tyr | p.D87Y | P63098 | protein_coding | deleterious(0) | possibly_damaging(0.753) | TCGA-CA-6718-01 | Colorectum | colon adenocarcinoma | Male | <65 | I/II | Unknown | Unknown | PD | |
| PPP3R1 | SNV | Missense_Mutation | novel | c.270N>T | p.Gln90His | p.Q90H | P63098 | protein_coding | deleterious(0.01) | benign(0.135) | TCGA-AG-A002-01 | Colorectum | rectum adenocarcinoma | Male | <65 | I/II | Unknown | Unknown | SD |
| PPP3R1 | SNV | Missense_Mutation | c.71N>A | p.Gly24Glu | p.G24E | P63098 | protein_coding | tolerated(0.27) | benign(0.031) | TCGA-F5-6464-01 | Colorectum | rectum adenocarcinoma | Female | >=65 | III/IV | Unknown | Unknown | SD | |
| PPP3R1 | SNV | Missense_Mutation | novel | c.224N>G | p.Phe75Cys | p.F75C | P63098 | protein_coding | deleterious(0) | probably_damaging(1) | TCGA-A5-A0G2-01 | Endometrium | uterine corpus endometrioid carcinoma | Female | <65 | III/IV | Unknown | Unknown | SD |
| PPP3R1 | SNV | Missense_Mutation | c.170N>A | p.Arg57Gln | p.R57Q | P63098 | protein_coding | deleterious(0) | probably_damaging(0.998) | TCGA-A5-A0G2-01 | Endometrium | uterine corpus endometrioid carcinoma | Female | <65 | III/IV | Unknown | Unknown | SD | |
| PPP3R1 | SNV | Missense_Mutation | c.395N>A | p.Ile132Asn | p.I132N | P63098 | protein_coding | deleterious(0) | probably_damaging(1) | TCGA-A5-A0G9-01 | Endometrium | uterine corpus endometrioid carcinoma | Female | >=65 | I/II | Unknown | Unknown | SD | |
| PPP3R1 | SNV | Missense_Mutation | novel | c.187N>A | p.Asp63Asn | p.D63N | P63098 | protein_coding | deleterious(0.04) | probably_damaging(0.97) | TCGA-AX-A06F-01 | Endometrium | uterine corpus endometrioid carcinoma | Female | <65 | III/IV | Chemotherapy | carboplatin | SD |
| Page: 1 2 3 |
Top |
Related drugs of malignant transformation related genes |
| Identification of chemicals and drugs interact with genes involved in malignant transfromation |
| (DGIdb 4.0) |
| Entrez ID | Symbol | Category | Interaction Types | Drug Claim Name | Drug Name | PMIDs |
| Page: 1 |

Copyright 2023-Present -The University of Texas Health Science Center at Houston |