
|
|||||
|
 | |
| |
| |
| |
| |
| |
|
Gene: PPP2R5C |
Gene summary for PPP2R5C |
| Gene information | Species | Human | Gene symbol | PPP2R5C | Gene ID | 5527 |
| Gene name | protein phosphatase 2 regulatory subunit B'gamma | |
| Gene Alias | B56G | |
| Cytomap | 14q32.31 | |
| Gene Type | protein-coding | GO ID | GO:0006464 | UniProtAcc | Q13362 |
Top |
Malignant transformation analysis |
| Identification of the aberrant gene expression in precancerous and cancerous lesions by comparing the gene expression of stem-like cells in diseased tissues with normal stem cells |
| Entrez ID | Symbol | Replicates | Species | Organ | Tissue | Adj P-value | Log2FC | Malignancy |
| 5527 | PPP2R5C | HTA11_347_2000001011 | Human | Colorectum | AD | 1.18e-03 | 4.15e-01 | -0.1954 |
| 5527 | PPP2R5C | HTA11_99999965062_69753 | Human | Colorectum | MSI-H | 1.12e-03 | 9.38e-01 | 0.3487 |
| 5527 | PPP2R5C | A015-C-203 | Human | Colorectum | FAP | 1.60e-29 | -4.25e-01 | -0.1294 |
| 5527 | PPP2R5C | A015-C-204 | Human | Colorectum | FAP | 1.92e-05 | -2.91e-01 | -0.0228 |
| 5527 | PPP2R5C | A002-C-201 | Human | Colorectum | FAP | 1.34e-14 | -3.31e-01 | 0.0324 |
| 5527 | PPP2R5C | A002-C-203 | Human | Colorectum | FAP | 7.86e-04 | -3.52e-02 | 0.2786 |
| 5527 | PPP2R5C | A001-C-119 | Human | Colorectum | FAP | 1.44e-05 | -3.45e-01 | -0.1557 |
| 5527 | PPP2R5C | A001-C-108 | Human | Colorectum | FAP | 5.85e-12 | -7.04e-02 | -0.0272 |
| 5527 | PPP2R5C | A002-C-205 | Human | Colorectum | FAP | 1.99e-23 | -4.83e-01 | -0.1236 |
| 5527 | PPP2R5C | A001-C-104 | Human | Colorectum | FAP | 1.17e-03 | 1.03e-01 | 0.0184 |
| 5527 | PPP2R5C | A015-C-005 | Human | Colorectum | FAP | 9.68e-03 | -1.72e-01 | -0.0336 |
| 5527 | PPP2R5C | A015-C-006 | Human | Colorectum | FAP | 4.97e-18 | -5.63e-01 | -0.0994 |
| 5527 | PPP2R5C | A015-C-106 | Human | Colorectum | FAP | 4.95e-09 | -1.31e-01 | -0.0511 |
| 5527 | PPP2R5C | A002-C-114 | Human | Colorectum | FAP | 5.97e-19 | -4.13e-01 | -0.1561 |
| 5527 | PPP2R5C | A015-C-104 | Human | Colorectum | FAP | 5.81e-26 | -3.67e-01 | -0.1899 |
| 5527 | PPP2R5C | A001-C-014 | Human | Colorectum | FAP | 4.10e-11 | -1.31e-02 | 0.0135 |
| 5527 | PPP2R5C | A002-C-016 | Human | Colorectum | FAP | 2.53e-19 | -2.49e-01 | 0.0521 |
| 5527 | PPP2R5C | A015-C-002 | Human | Colorectum | FAP | 1.36e-10 | -2.54e-01 | -0.0763 |
| 5527 | PPP2R5C | A001-C-203 | Human | Colorectum | FAP | 6.00e-06 | -8.97e-03 | -0.0481 |
| 5527 | PPP2R5C | A002-C-116 | Human | Colorectum | FAP | 3.86e-31 | -3.08e-01 | -0.0452 |
| Page: 1 2 3 4 5 6 7 8 |
| Tissue | Expression Dynamics | Abbreviation |
| Colorectum (GSE201348) |  | FAP: Familial adenomatous polyposis |
| CRC: Colorectal cancer | ||
| Colorectum (HTA11) |  | AD: Adenomas |
| SER: Sessile serrated lesions | ||
| MSI-H: Microsatellite-high colorectal cancer | ||
| MSS: Microsatellite stable colorectal cancer | ||
| Esophagus |  | ESCC: Esophageal squamous cell carcinoma |
| HGIN: High-grade intraepithelial neoplasias | ||
| LGIN: Low-grade intraepithelial neoplasias | ||
| Oral Cavity | 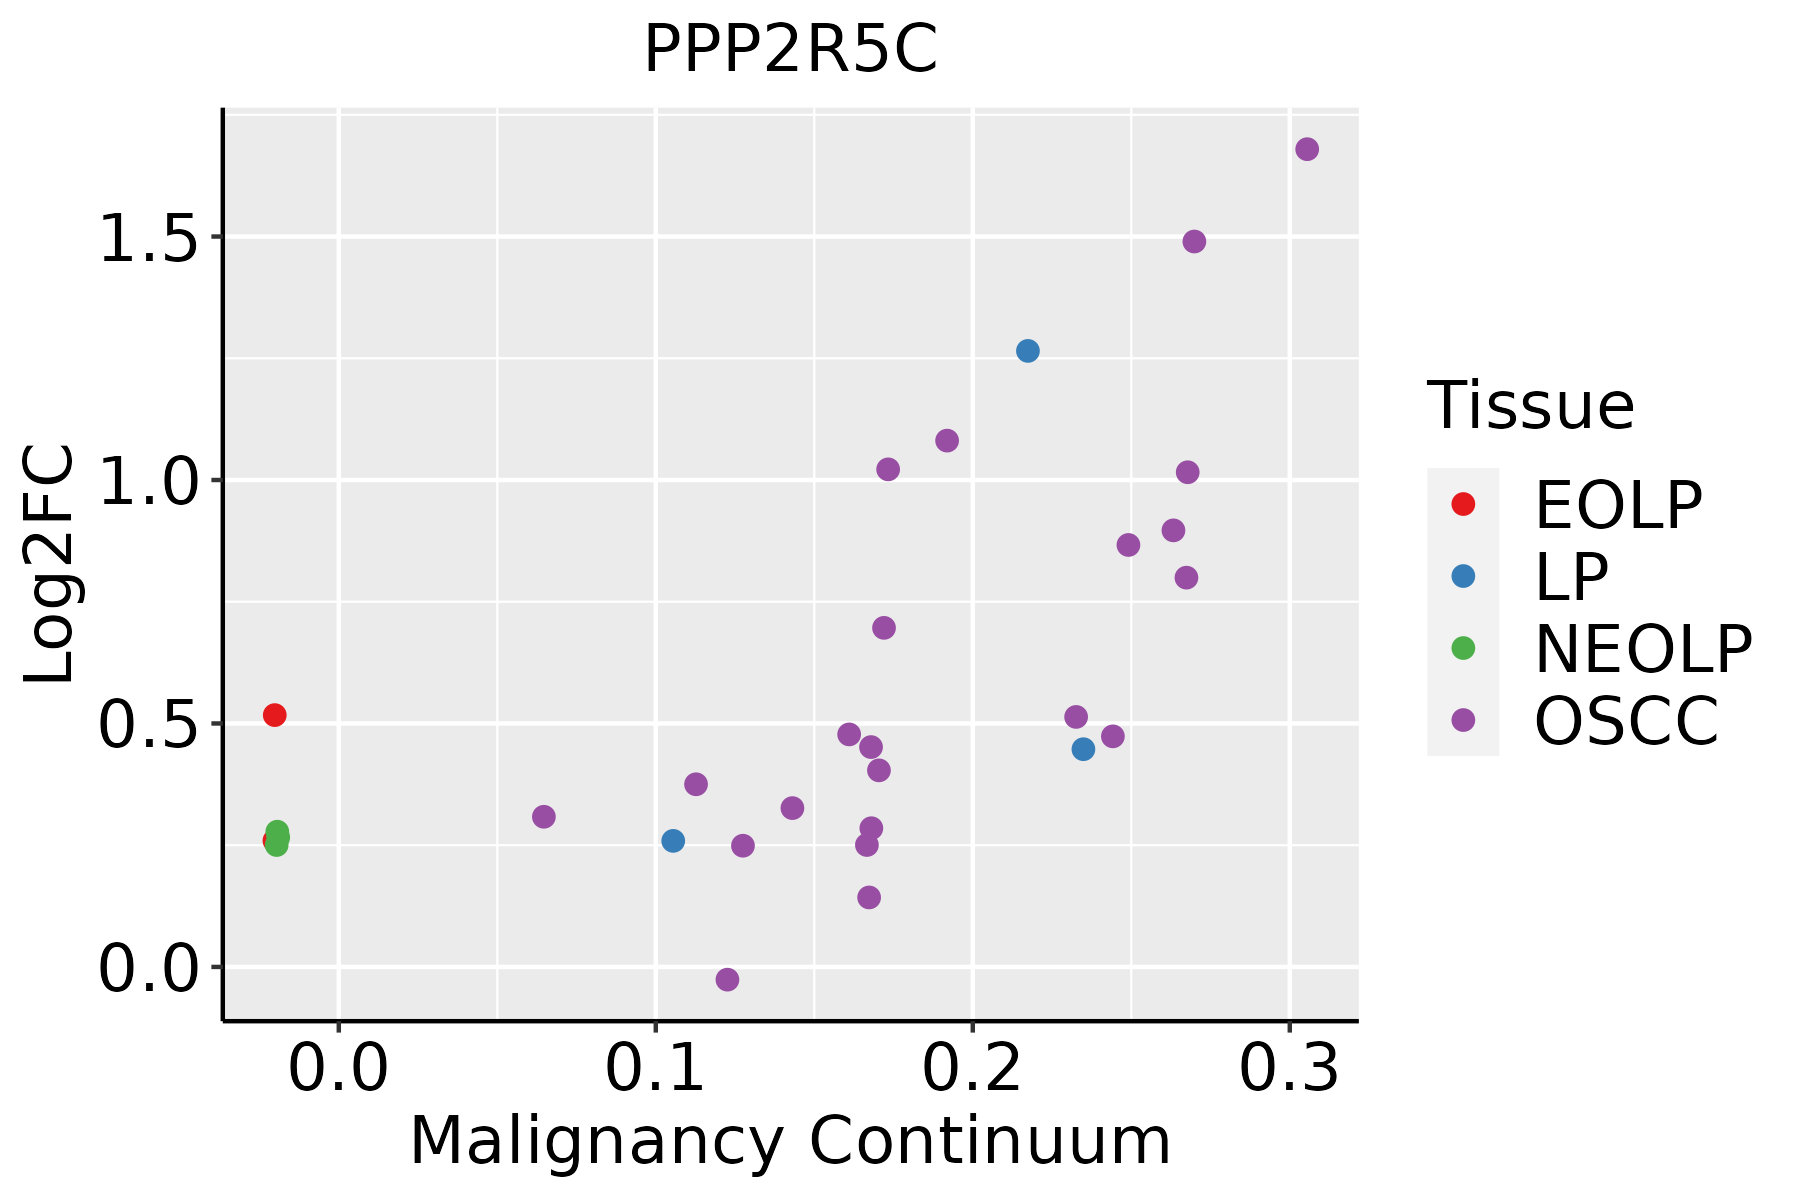 | EOLP: Erosive Oral lichen planus |
| LP: leukoplakia | ||
| NEOLP: Non-erosive oral lichen planus | ||
| OSCC: Oral squamous cell carcinoma | ||
| Prostate | 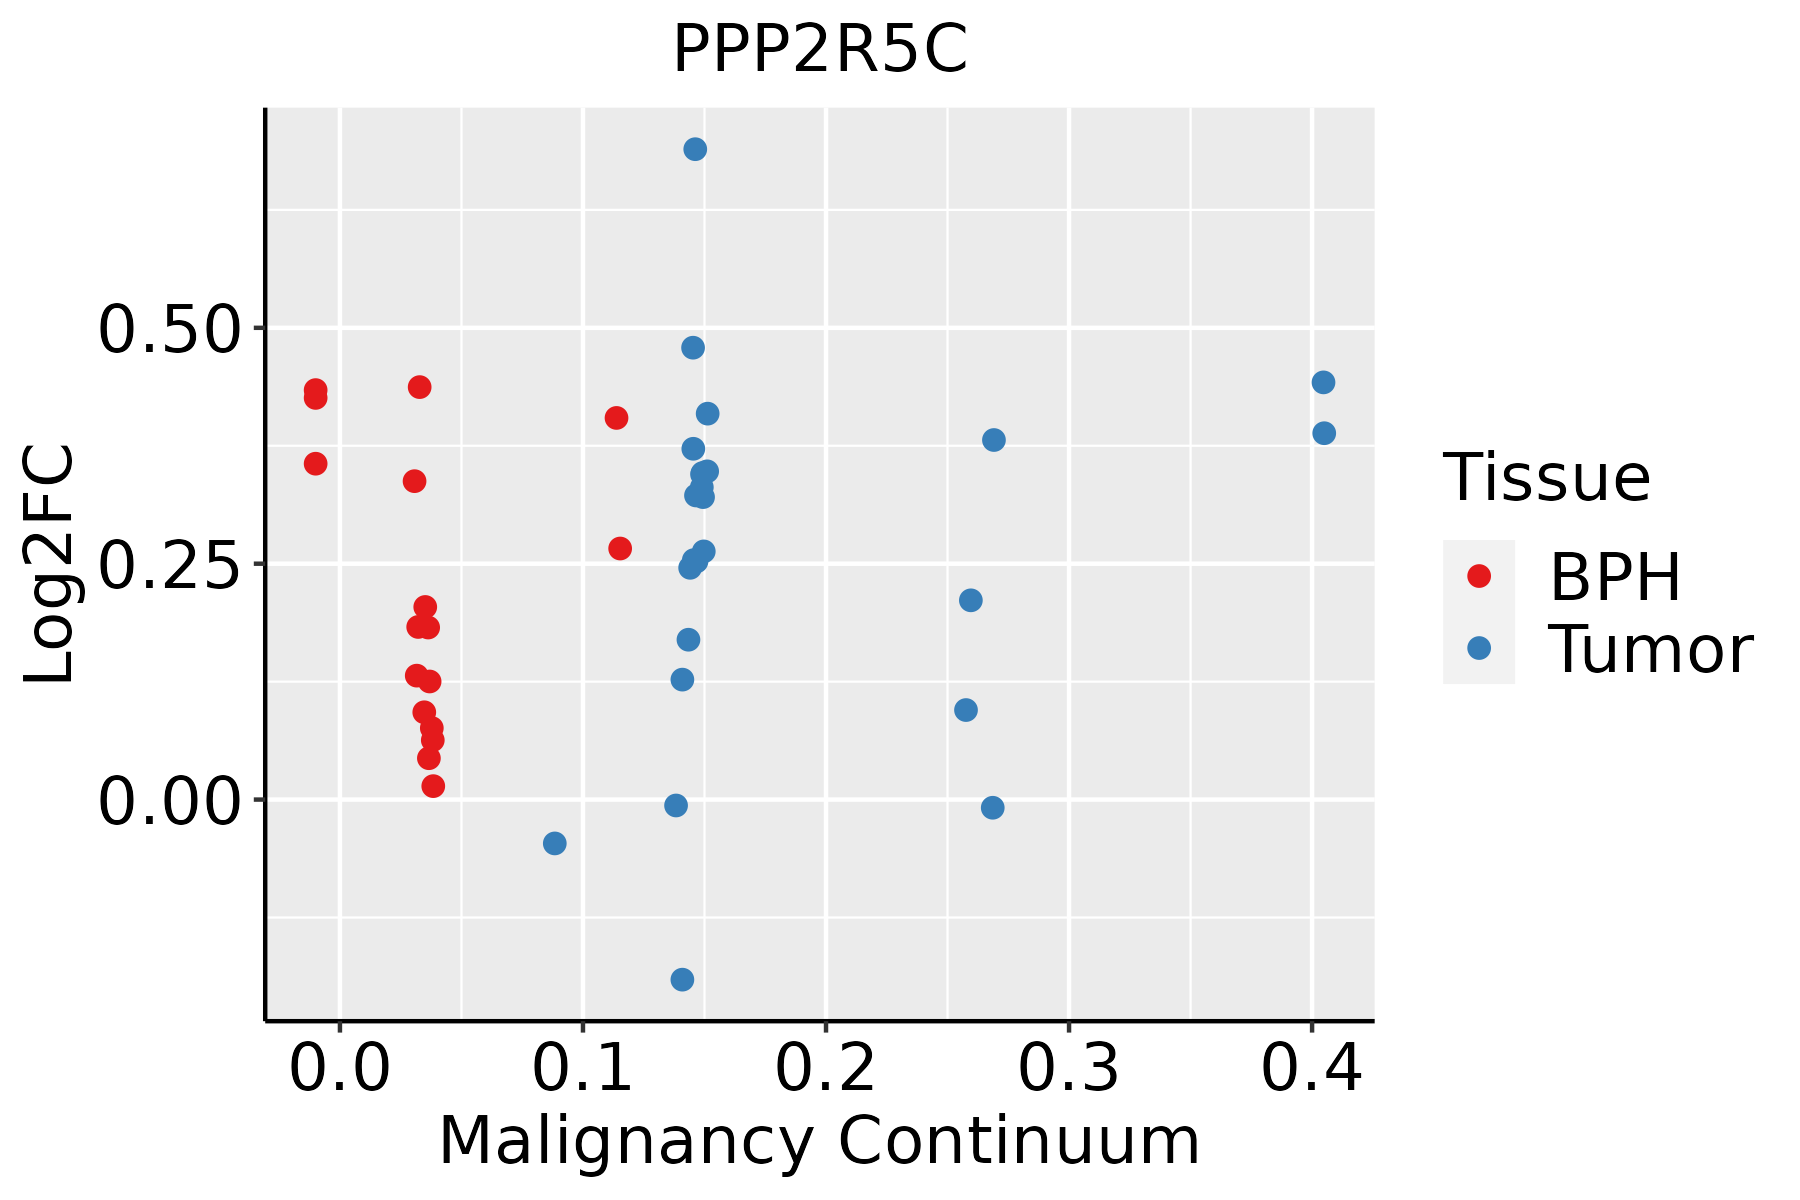 | BPH: Benign Prostatic Hyperplasia |
| Skin |  | AK: Actinic keratosis |
| cSCC: Cutaneous squamous cell carcinoma | ||
| SCCIS:squamous cell carcinoma in situ | ||
| Thyroid |  | ATC: Anaplastic thyroid cancer |
| HT: Hashimoto's thyroiditis | ||
| PTC: Papillary thyroid cancer |
| ∗log2FC in expression of this searched gene in stem-like cells from each diseased tissue sample relative to stem-like cells in normal samples in each tissue plotted against the malignancy continuum. Samples are colored based on if they are from different disease stage. |
Top |
Malignant transformation related pathway analysis |
| Find out the enriched GO biological processes and KEGG pathways involved in transition from healthy to precancer to cancer |
| Tissue | Disease Stage | Enriched GO biological Processes |
| Colorectum | AD |  |
| Colorectum | SER |  |
| Colorectum | MSS |  |
| Colorectum | MSI-H |  |
| Colorectum | FAP |  |
| ∗Top 15 enriched GO BP terms are showed in the bar plot of each disease state in each tissue. Each row represents a significant GO biological process which is colored according to the -log10(p.adjust). |
| Page: 1 2 3 4 5 6 7 8 9 |
| GO ID | Tissue | Disease Stage | Description | Gene Ratio | Bg Ratio | pvalue | p.adjust | Count |
| GO:0010498 | Colorectum | AD | proteasomal protein catabolic process | 174/3918 | 490/18723 | 3.18e-14 | 7.66e-12 | 174 |
| GO:0043161 | Colorectum | AD | proteasome-mediated ubiquitin-dependent protein catabolic process | 141/3918 | 412/18723 | 1.77e-10 | 1.68e-08 | 141 |
| GO:0016311 | Colorectum | AD | dephosphorylation | 123/3918 | 417/18723 | 1.84e-05 | 3.82e-04 | 123 |
| GO:0006470 | Colorectum | AD | protein dephosphorylation | 88/3918 | 281/18723 | 2.56e-05 | 4.89e-04 | 88 |
| GO:00104983 | Colorectum | MSI-H | proteasomal protein catabolic process | 71/1319 | 490/18723 | 4.67e-09 | 6.03e-07 | 71 |
| GO:00431613 | Colorectum | MSI-H | proteasome-mediated ubiquitin-dependent protein catabolic process | 53/1319 | 412/18723 | 1.51e-05 | 6.62e-04 | 53 |
| GO:00064703 | Colorectum | MSI-H | protein dephosphorylation | 34/1319 | 281/18723 | 1.43e-03 | 2.22e-02 | 34 |
| GO:00431614 | Colorectum | FAP | proteasome-mediated ubiquitin-dependent protein catabolic process | 98/2622 | 412/18723 | 5.41e-08 | 4.20e-06 | 98 |
| GO:00104984 | Colorectum | FAP | proteasomal protein catabolic process | 110/2622 | 490/18723 | 2.12e-07 | 1.26e-05 | 110 |
| GO:00163113 | Colorectum | FAP | dephosphorylation | 95/2622 | 417/18723 | 7.07e-07 | 3.32e-05 | 95 |
| GO:00064704 | Colorectum | FAP | protein dephosphorylation | 69/2622 | 281/18723 | 1.47e-06 | 6.39e-05 | 69 |
| GO:00163114 | Colorectum | CRC | dephosphorylation | 79/2078 | 417/18723 | 1.27e-06 | 7.21e-05 | 79 |
| GO:00064705 | Colorectum | CRC | protein dephosphorylation | 57/2078 | 281/18723 | 4.49e-06 | 1.87e-04 | 57 |
| GO:00431615 | Colorectum | CRC | proteasome-mediated ubiquitin-dependent protein catabolic process | 69/2078 | 412/18723 | 3.16e-04 | 4.90e-03 | 69 |
| GO:00104985 | Colorectum | CRC | proteasomal protein catabolic process | 77/2078 | 490/18723 | 1.03e-03 | 1.21e-02 | 77 |
| GO:001049826 | Esophagus | HGIN | proteasomal protein catabolic process | 139/2587 | 490/18723 | 1.20e-17 | 3.41e-15 | 139 |
| GO:004316126 | Esophagus | HGIN | proteasome-mediated ubiquitin-dependent protein catabolic process | 114/2587 | 412/18723 | 7.00e-14 | 1.20e-11 | 114 |
| GO:000647017 | Esophagus | HGIN | protein dephosphorylation | 61/2587 | 281/18723 | 1.86e-04 | 3.51e-03 | 61 |
| GO:0010498111 | Esophagus | ESCC | proteasomal protein catabolic process | 369/8552 | 490/18723 | 1.13e-41 | 1.80e-38 | 369 |
| GO:0043161111 | Esophagus | ESCC | proteasome-mediated ubiquitin-dependent protein catabolic process | 312/8552 | 412/18723 | 3.53e-36 | 4.48e-33 | 312 |
| Page: 1 2 3 |
| Pathway ID | Tissue | Disease Stage | Description | Gene Ratio | Bg Ratio | pvalue | p.adjust | qvalue | Count |
| hsa04152 | Colorectum | AD | AMPK signaling pathway | 47/2092 | 121/8465 | 3.74e-04 | 2.82e-03 | 1.80e-03 | 47 |
| hsa04071 | Colorectum | AD | Sphingolipid signaling pathway | 43/2092 | 121/8465 | 4.83e-03 | 2.28e-02 | 1.45e-02 | 43 |
| hsa04728 | Colorectum | AD | Dopaminergic synapse | 46/2092 | 132/8465 | 5.55e-03 | 2.48e-02 | 1.58e-02 | 46 |
| hsa03015 | Colorectum | AD | mRNA surveillance pathway | 35/2092 | 97/8465 | 7.95e-03 | 3.13e-02 | 2.00e-02 | 35 |
| hsa041521 | Colorectum | AD | AMPK signaling pathway | 47/2092 | 121/8465 | 3.74e-04 | 2.82e-03 | 1.80e-03 | 47 |
| hsa040711 | Colorectum | AD | Sphingolipid signaling pathway | 43/2092 | 121/8465 | 4.83e-03 | 2.28e-02 | 1.45e-02 | 43 |
| hsa047281 | Colorectum | AD | Dopaminergic synapse | 46/2092 | 132/8465 | 5.55e-03 | 2.48e-02 | 1.58e-02 | 46 |
| hsa030151 | Colorectum | AD | mRNA surveillance pathway | 35/2092 | 97/8465 | 7.95e-03 | 3.13e-02 | 2.00e-02 | 35 |
| hsa041524 | Colorectum | FAP | AMPK signaling pathway | 37/1404 | 121/8465 | 8.97e-05 | 8.56e-04 | 5.21e-04 | 37 |
| hsa040714 | Colorectum | FAP | Sphingolipid signaling pathway | 34/1404 | 121/8465 | 9.53e-04 | 5.22e-03 | 3.17e-03 | 34 |
| hsa047286 | Colorectum | FAP | Dopaminergic synapse | 34/1404 | 132/8465 | 4.59e-03 | 1.89e-02 | 1.15e-02 | 34 |
| hsa04261 | Colorectum | FAP | Adrenergic signaling in cardiomyocytes | 38/1404 | 154/8465 | 6.16e-03 | 2.34e-02 | 1.42e-02 | 38 |
| hsa030152 | Colorectum | FAP | mRNA surveillance pathway | 26/1404 | 97/8465 | 7.11e-03 | 2.64e-02 | 1.60e-02 | 26 |
| hsa04151 | Colorectum | FAP | PI3K-Akt signaling pathway | 75/1404 | 354/8465 | 1.23e-02 | 4.19e-02 | 2.55e-02 | 75 |
| hsa04110 | Colorectum | FAP | Cell cycle | 37/1404 | 157/8465 | 1.44e-02 | 4.77e-02 | 2.90e-02 | 37 |
| hsa041525 | Colorectum | FAP | AMPK signaling pathway | 37/1404 | 121/8465 | 8.97e-05 | 8.56e-04 | 5.21e-04 | 37 |
| hsa040715 | Colorectum | FAP | Sphingolipid signaling pathway | 34/1404 | 121/8465 | 9.53e-04 | 5.22e-03 | 3.17e-03 | 34 |
| hsa047287 | Colorectum | FAP | Dopaminergic synapse | 34/1404 | 132/8465 | 4.59e-03 | 1.89e-02 | 1.15e-02 | 34 |
| hsa042611 | Colorectum | FAP | Adrenergic signaling in cardiomyocytes | 38/1404 | 154/8465 | 6.16e-03 | 2.34e-02 | 1.42e-02 | 38 |
| hsa030153 | Colorectum | FAP | mRNA surveillance pathway | 26/1404 | 97/8465 | 7.11e-03 | 2.64e-02 | 1.60e-02 | 26 |
| Page: 1 2 3 4 5 6 |
Top |
Cell-cell communication analysis |
| Identification of potential cell-cell interactions between two cell types and their ligand-receptor pairs for different disease states |
| Ligand | Receptor | LRpair | Pathway | Tissue | Disease Stage |
| Page: 1 |
Top |
Single-cell gene regulatory network inference analysis |
| Find out the significant the regulons (TFs) and the target genes of each regulon across cell types for different disease states |
| TF | Cell Type | Tissue | Disease Stage | Target Gene | RSS | Regulon Activity |
| ∗The dot plots of a searched regulon are shown for all cell subpopulations in each disease state of each tissue based on the regulon specific score inferred using pySCENIC and by calculating the average expression. |
| Page: 1 |
Top |
Somatic mutation of malignant transformation related genes |
| Annotation of somatic variants for genes involved in malignant transformation |
| Hugo Symbol | Variant Class | Variant Classification | dbSNP RS | HGVSc | HGVSp | HGVSp Short | SWISSPROT | BIOTYPE | SIFT | PolyPhen | Tumor Sample Barcode | Tissue | Histology | Sex | Age | Stage | Therapy Types | Drugs | Outcome |
| PPP2R5C | SNV | Missense_Mutation | c.407N>A | p.Arg136Gln | p.R136Q | Q13362 | protein_coding | deleterious(0.02) | probably_damaging(0.99) | TCGA-AN-A046-01 | Breast | breast invasive carcinoma | Female | >=65 | I/II | Unknown | Unknown | SD | |
| PPP2R5C | SNV | Missense_Mutation | novel | c.656G>A | p.Arg219Lys | p.R219K | Q13362 | protein_coding | deleterious(0) | probably_damaging(0.994) | TCGA-BH-A0B6-01 | Breast | breast invasive carcinoma | Female | <65 | I/II | Unknown | Unknown | SD |
| PPP2R5C | SNV | Missense_Mutation | c.1329C>G | p.Phe443Leu | p.F443L | Q13362 | protein_coding | deleterious(0) | benign(0.066) | TCGA-D8-A27G-01 | Breast | breast invasive carcinoma | Female | >=65 | I/II | Unknown | Unknown | SD | |
| PPP2R5C | SNV | Missense_Mutation | c.1100N>A | p.Ser367Tyr | p.S367Y | Q13362 | protein_coding | deleterious(0) | probably_damaging(0.981) | TCGA-OL-A5RW-01 | Breast | breast invasive carcinoma | Female | <65 | I/II | Chemotherapy | adriamycin | CR | |
| PPP2R5C | SNV | Missense_Mutation | novel | c.1111N>C | p.Phe371Leu | p.F371L | Q13362 | protein_coding | deleterious(0.01) | possibly_damaging(0.628) | TCGA-2W-A8YY-01 | Cervix | cervical & endocervical cancer | Female | <65 | I/II | Chemotherapy | cisplatin | CR |
| PPP2R5C | SNV | Missense_Mutation | c.1150N>C | p.Glu384Gln | p.E384Q | Q13362 | protein_coding | deleterious(0) | probably_damaging(0.972) | TCGA-EK-A3GK-01 | Cervix | cervical & endocervical cancer | Female | <65 | I/II | Unknown | Unknown | SD | |
| PPP2R5C | SNV | Missense_Mutation | novel | c.1474G>A | p.Asp492Asn | p.D492N | Q13362 | protein_coding | tolerated(0.09) | benign(0.02) | TCGA-JW-A5VJ-01 | Cervix | cervical & endocervical cancer | Female | <65 | I/II | Unknown | Unknown | PD |
| PPP2R5C | SNV | Missense_Mutation | c.407G>A | p.Arg136Gln | p.R136Q | Q13362 | protein_coding | deleterious(0.02) | probably_damaging(0.99) | TCGA-AA-3977-01 | Colorectum | colon adenocarcinoma | Male | >=65 | I/II | Unknown | Unknown | SD | |
| PPP2R5C | SNV | Missense_Mutation | novel | c.869N>A | p.Ser290Tyr | p.S290Y | Q13362 | protein_coding | deleterious(0) | possibly_damaging(0.831) | TCGA-AA-3984-01 | Colorectum | colon adenocarcinoma | Female | <65 | I/II | Unknown | Unknown | SD |
| PPP2R5C | SNV | Missense_Mutation | c.1144A>G | p.Asn382Asp | p.N382D | Q13362 | protein_coding | deleterious(0) | benign(0.436) | TCGA-G4-6309-01 | Colorectum | colon adenocarcinoma | Female | <65 | III/IV | Chemotherapy | xeloda | PD |
| Page: 1 2 3 4 5 |
Top |
Related drugs of malignant transformation related genes |
| Identification of chemicals and drugs interact with genes involved in malignant transfromation |
| (DGIdb 4.0) |
| Entrez ID | Symbol | Category | Interaction Types | Drug Claim Name | Drug Name | PMIDs |
| Page: 1 |

Copyright 2023-Present -The University of Texas Health Science Center at Houston |