| Tissue | Expression Dynamics | Abbreviation |
| Esophagus |  | ESCC: Esophageal squamous cell carcinoma |
| HGIN: High-grade intraepithelial neoplasias |
| LGIN: Low-grade intraepithelial neoplasias |
| Liver | 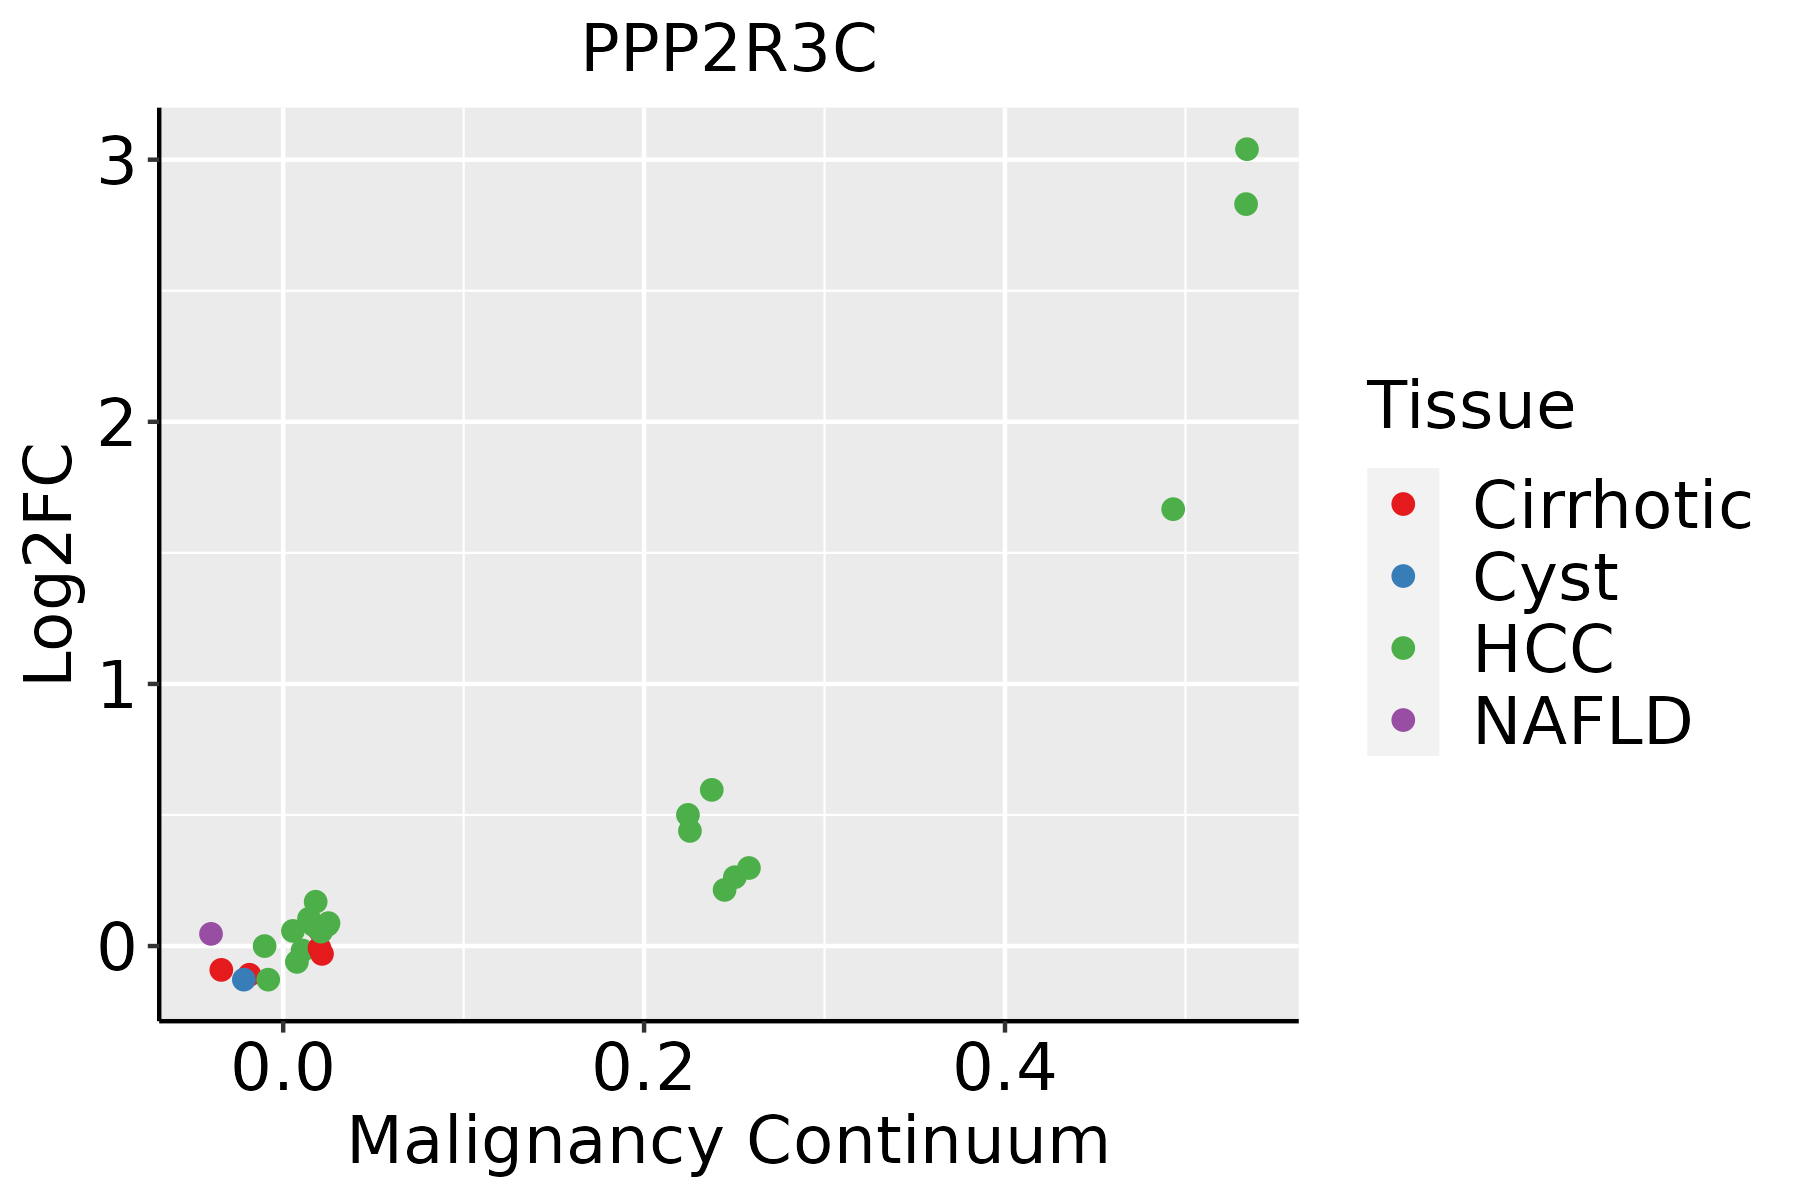 | HCC: Hepatocellular carcinoma |
| NAFLD: Non-alcoholic fatty liver disease |
| Oral Cavity | 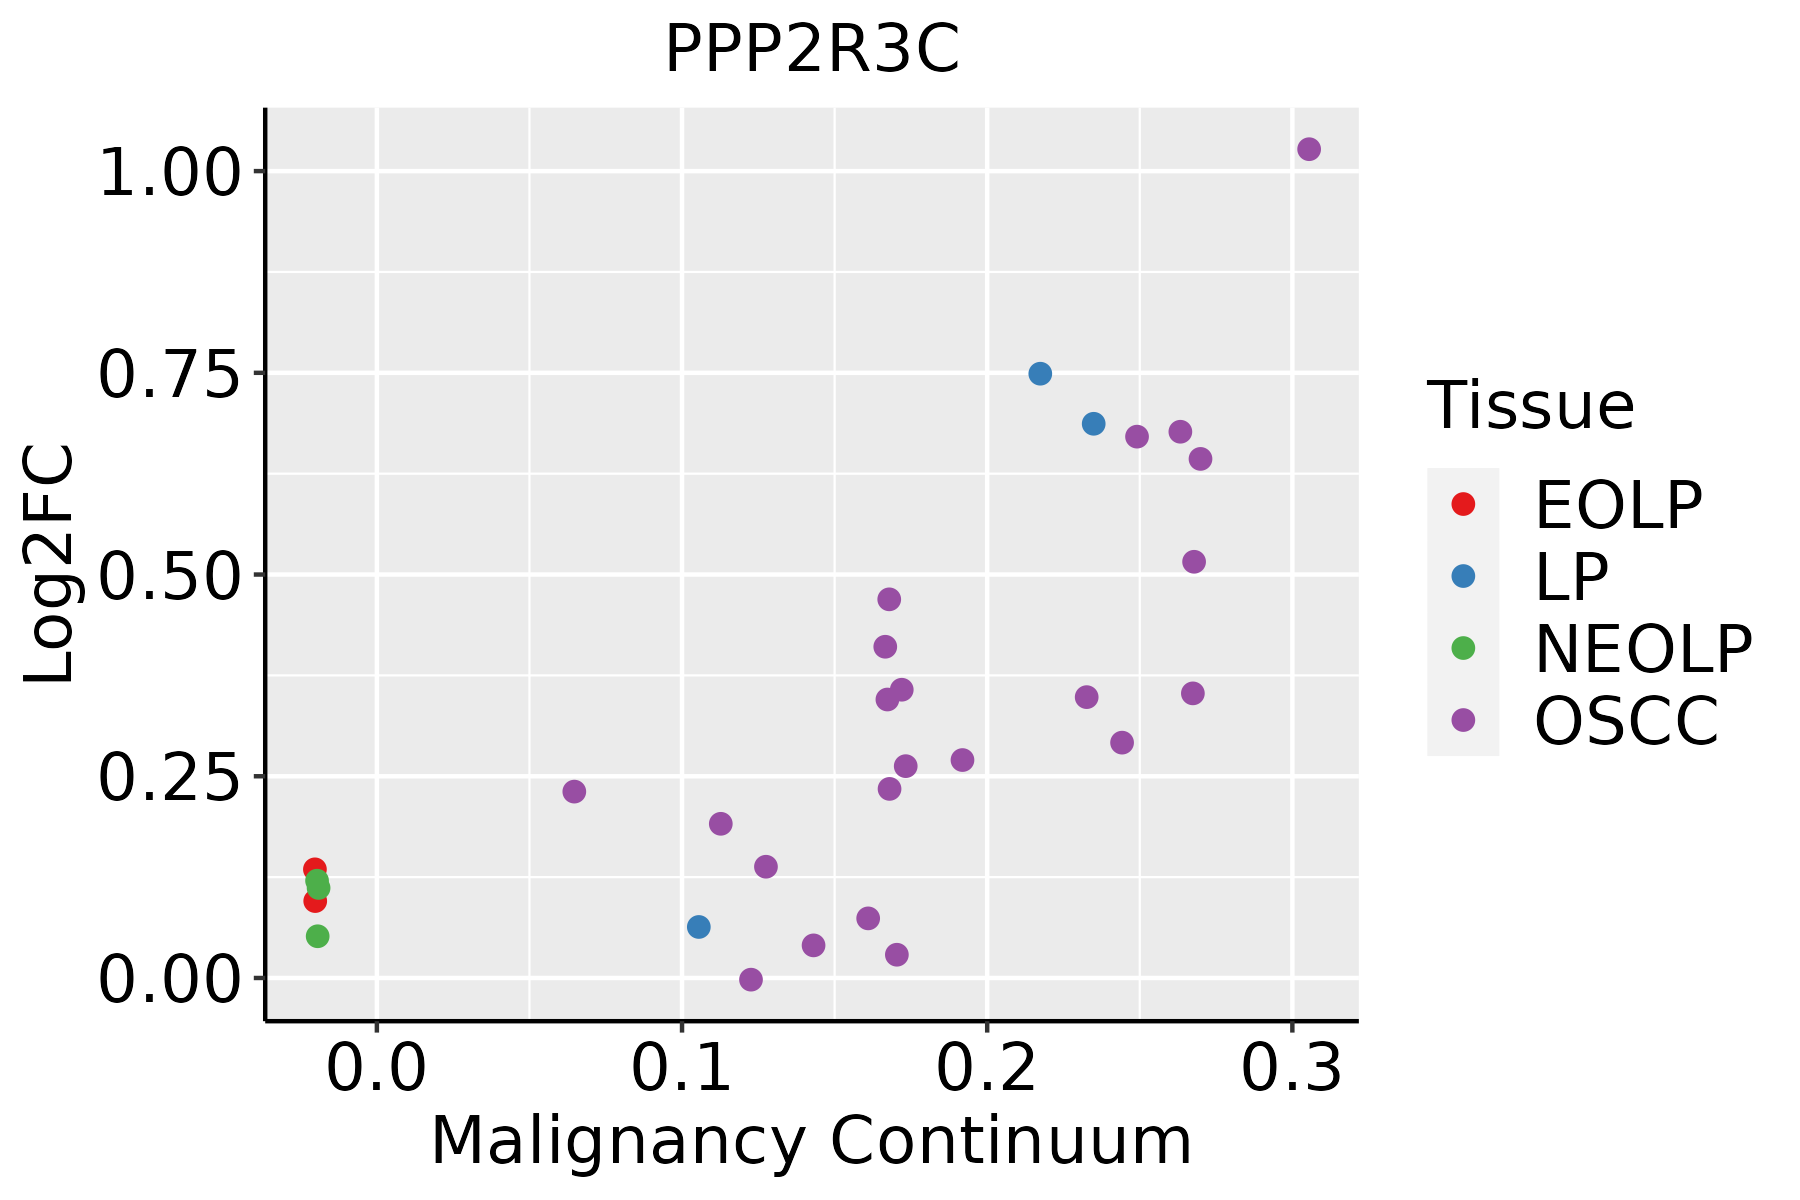 | EOLP: Erosive Oral lichen planus |
| LP: leukoplakia |
| NEOLP: Non-erosive oral lichen planus |
| OSCC: Oral squamous cell carcinoma |
| Skin |  | AK: Actinic keratosis |
| cSCC: Cutaneous squamous cell carcinoma |
| SCCIS:squamous cell carcinoma in situ |
| Thyroid |  | ATC: Anaplastic thyroid cancer |
| HT: Hashimoto's thyroiditis |
| PTC: Papillary thyroid cancer |
| GO ID | Tissue | Disease Stage | Description | Gene Ratio | Bg Ratio | pvalue | p.adjust | Count |
| GO:001631110 | Esophagus | ESCC | dephosphorylation | 251/8552 | 417/18723 | 1.26e-09 | 2.99e-08 | 251 |
| GO:0035303111 | Esophagus | ESCC | regulation of dephosphorylation | 88/8552 | 128/18723 | 1.04e-07 | 1.71e-06 | 88 |
| GO:0048872111 | Esophagus | ESCC | homeostasis of number of cells | 163/8552 | 272/18723 | 1.40e-06 | 1.69e-05 | 163 |
| GO:00028318 | Esophagus | ESCC | regulation of response to biotic stimulus | 191/8552 | 327/18723 | 2.12e-06 | 2.45e-05 | 191 |
| GO:004586018 | Esophagus | ESCC | positive regulation of protein kinase activity | 219/8552 | 386/18723 | 6.91e-06 | 6.97e-05 | 219 |
| GO:003367420 | Esophagus | ESCC | positive regulation of kinase activity | 260/8552 | 467/18723 | 7.26e-06 | 7.22e-05 | 260 |
| GO:003086517 | Esophagus | ESCC | cortical cytoskeleton organization | 44/8552 | 61/18723 | 2.50e-05 | 2.13e-04 | 44 |
| GO:005188110 | Esophagus | ESCC | regulation of mitochondrial membrane potential | 51/8552 | 74/18723 | 4.42e-05 | 3.51e-04 | 51 |
| GO:1903706110 | Esophagus | ESCC | regulation of hemopoiesis | 201/8552 | 367/18723 | 2.60e-04 | 1.58e-03 | 201 |
| GO:19021076 | Esophagus | ESCC | positive regulation of leukocyte differentiation | 93/8552 | 157/18723 | 4.20e-04 | 2.39e-03 | 93 |
| GO:19037086 | Esophagus | ESCC | positive regulation of hemopoiesis | 93/8552 | 157/18723 | 4.20e-04 | 2.39e-03 | 93 |
| GO:19031317 | Esophagus | ESCC | mononuclear cell differentiation | 226/8552 | 426/18723 | 1.20e-03 | 5.88e-03 | 226 |
| GO:190210510 | Esophagus | ESCC | regulation of leukocyte differentiation | 152/8552 | 279/18723 | 1.82e-03 | 8.35e-03 | 152 |
| GO:00456213 | Esophagus | ESCC | positive regulation of lymphocyte differentiation | 61/8552 | 104/18723 | 5.22e-03 | 1.97e-02 | 61 |
| GO:00300984 | Esophagus | ESCC | lymphocyte differentiation | 192/8552 | 374/18723 | 1.52e-02 | 4.93e-02 | 192 |
| GO:00308656 | Liver | Cirrhotic | cortical cytoskeleton organization | 30/4634 | 61/18723 | 3.16e-05 | 3.93e-04 | 30 |
| GO:001631111 | Liver | Cirrhotic | dephosphorylation | 130/4634 | 417/18723 | 1.58e-03 | 1.03e-02 | 130 |
| GO:004887212 | Liver | Cirrhotic | homeostasis of number of cells | 89/4634 | 272/18723 | 1.76e-03 | 1.12e-02 | 89 |
| GO:00518815 | Liver | Cirrhotic | regulation of mitochondrial membrane potential | 30/4634 | 74/18723 | 1.97e-03 | 1.23e-02 | 30 |
| GO:00028311 | Liver | Cirrhotic | regulation of response to biotic stimulus | 101/4634 | 327/18723 | 6.58e-03 | 3.25e-02 | 101 |
| Pathway ID | Tissue | Disease Stage | Description | Gene Ratio | Bg Ratio | pvalue | p.adjust | qvalue | Count |
| hsa0516510 | Esophagus | ESCC | Human papillomavirus infection | 215/4205 | 331/8465 | 7.86e-09 | 7.12e-08 | 3.65e-08 | 215 |
| hsa0301524 | Esophagus | ESCC | mRNA surveillance pathway | 72/4205 | 97/8465 | 6.12e-07 | 4.10e-06 | 2.10e-06 | 72 |
| hsa0407116 | Esophagus | ESCC | Sphingolipid signaling pathway | 85/4205 | 121/8465 | 3.04e-06 | 1.73e-05 | 8.84e-06 | 85 |
| hsa0415210 | Esophagus | ESCC | AMPK signaling pathway | 80/4205 | 121/8465 | 1.73e-04 | 6.67e-04 | 3.42e-04 | 80 |
| hsa041517 | Esophagus | ESCC | PI3K-Akt signaling pathway | 197/4205 | 354/8465 | 1.24e-02 | 2.83e-02 | 1.45e-02 | 197 |
| hsa0516515 | Esophagus | ESCC | Human papillomavirus infection | 215/4205 | 331/8465 | 7.86e-09 | 7.12e-08 | 3.65e-08 | 215 |
| hsa0301534 | Esophagus | ESCC | mRNA surveillance pathway | 72/4205 | 97/8465 | 6.12e-07 | 4.10e-06 | 2.10e-06 | 72 |
| hsa0407117 | Esophagus | ESCC | Sphingolipid signaling pathway | 85/4205 | 121/8465 | 3.04e-06 | 1.73e-05 | 8.84e-06 | 85 |
| hsa0415213 | Esophagus | ESCC | AMPK signaling pathway | 80/4205 | 121/8465 | 1.73e-04 | 6.67e-04 | 3.42e-04 | 80 |
| hsa0415114 | Esophagus | ESCC | PI3K-Akt signaling pathway | 197/4205 | 354/8465 | 1.24e-02 | 2.83e-02 | 1.45e-02 | 197 |
| hsa030154 | Liver | Cirrhotic | mRNA surveillance pathway | 46/2530 | 97/8465 | 1.92e-04 | 1.30e-03 | 8.03e-04 | 46 |
| hsa05165 | Liver | Cirrhotic | Human papillomavirus infection | 124/2530 | 331/8465 | 1.55e-03 | 7.83e-03 | 4.83e-03 | 124 |
| hsa0415221 | Liver | Cirrhotic | AMPK signaling pathway | 49/2530 | 121/8465 | 7.90e-03 | 2.74e-02 | 1.69e-02 | 49 |
| hsa0301511 | Liver | Cirrhotic | mRNA surveillance pathway | 46/2530 | 97/8465 | 1.92e-04 | 1.30e-03 | 8.03e-04 | 46 |
| hsa051651 | Liver | Cirrhotic | Human papillomavirus infection | 124/2530 | 331/8465 | 1.55e-03 | 7.83e-03 | 4.83e-03 | 124 |
| hsa0415231 | Liver | Cirrhotic | AMPK signaling pathway | 49/2530 | 121/8465 | 7.90e-03 | 2.74e-02 | 1.69e-02 | 49 |
| hsa0301521 | Liver | HCC | mRNA surveillance pathway | 66/4020 | 97/8465 | 3.16e-05 | 1.88e-04 | 1.04e-04 | 66 |
| hsa0415241 | Liver | HCC | AMPK signaling pathway | 77/4020 | 121/8465 | 2.32e-04 | 1.11e-03 | 6.18e-04 | 77 |
| hsa051652 | Liver | HCC | Human papillomavirus infection | 188/4020 | 331/8465 | 3.34e-04 | 1.49e-03 | 8.29e-04 | 188 |
| hsa040718 | Liver | HCC | Sphingolipid signaling pathway | 72/4020 | 121/8465 | 5.01e-03 | 1.47e-02 | 8.18e-03 | 72 |
| Hugo Symbol | Variant Class | Variant Classification | dbSNP RS | HGVSc | HGVSp | HGVSp Short | SWISSPROT | BIOTYPE | SIFT | PolyPhen | Tumor Sample Barcode | Tissue | Histology | Sex | Age | Stage | Therapy Types | Drugs | Outcome |
| PPP2R3C | SNV | Missense_Mutation | | c.455N>G | p.Tyr152Cys | p.Y152C | Q969Q6 | protein_coding | deleterious(0.01) | possibly_damaging(0.849) | TCGA-A8-A08P-01 | Breast | breast invasive carcinoma | Female | >=65 | III/IV | Chemotherapy | 5-fluorouracil | CR |
| PPP2R3C | SNV | Missense_Mutation | | c.521N>T | p.Arg174Ile | p.R174I | Q969Q6 | protein_coding | deleterious(0) | probably_damaging(0.996) | TCGA-AN-A046-01 | Breast | breast invasive carcinoma | Female | >=65 | I/II | Unknown | Unknown | SD |
| PPP2R3C | SNV | Missense_Mutation | | c.1136N>C | p.Ile379Thr | p.I379T | Q969Q6 | protein_coding | tolerated(0.64) | benign(0.018) | TCGA-AO-A128-01 | Breast | breast invasive carcinoma | Female | <65 | I/II | Chemotherapy | doxorubicin | SD |
| PPP2R3C | SNV | Missense_Mutation | | c.1222N>G | p.Leu408Val | p.L408V | Q969Q6 | protein_coding | deleterious(0) | possibly_damaging(0.895) | TCGA-AR-A0TX-01 | Breast | breast invasive carcinoma | Female | <65 | I/II | Unknown | Unknown | SD |
| PPP2R3C | SNV | Missense_Mutation | | c.684N>G | p.Phe228Leu | p.F228L | Q969Q6 | protein_coding | deleterious(0.01) | probably_damaging(1) | TCGA-AR-A0TX-01 | Breast | breast invasive carcinoma | Female | <65 | I/II | Unknown | Unknown | SD |
| PPP2R3C | SNV | Missense_Mutation | | c.220T>G | p.Leu74Val | p.L74V | Q969Q6 | protein_coding | tolerated(0.15) | possibly_damaging(0.723) | TCGA-C8-A275-01 | Breast | breast invasive carcinoma | Female | <65 | I/II | Unknown | Unknown | SD |
| PPP2R3C | SNV | Missense_Mutation | | c.605N>A | p.Pro202His | p.P202H | Q969Q6 | protein_coding | deleterious(0) | probably_damaging(0.998) | TCGA-D8-A1Y1-01 | Breast | breast invasive carcinoma | Female | >=65 | III/IV | Hormone Therapy | tamoxiphen | PD |
| PPP2R3C | SNV | Missense_Mutation | rs762781414 | c.347N>T | p.Ala116Val | p.A116V | Q969Q6 | protein_coding | tolerated(0.25) | benign(0.08) | TCGA-2W-A8YY-01 | Cervix | cervical & endocervical cancer | Female | <65 | I/II | Chemotherapy | cisplatin | CR |
| PPP2R3C | SNV | Missense_Mutation | | c.1327G>T | p.Asp443Tyr | p.D443Y | Q969Q6 | protein_coding | deleterious(0.02) | possibly_damaging(0.563) | TCGA-C5-A905-01 | Cervix | cervical & endocervical cancer | Female | <65 | I/II | Unknown | Unknown | SD |
| PPP2R3C | SNV | Missense_Mutation | novel | c.1027N>T | p.Pro343Ser | p.P343S | Q969Q6 | protein_coding | deleterious(0.04) | possibly_damaging(0.508) | TCGA-VS-A9UB-01 | Cervix | cervical & endocervical cancer | Female | <65 | I/II | Chemotherapy | cisplatin | CR |


