
|
|||||
|
 | |
| |
| |
| |
| |
| |
|
Gene: PPP2R2D |
Gene summary for PPP2R2D |
| Gene information | Species | Human | Gene symbol | PPP2R2D | Gene ID | 55844 |
| Gene name | protein phosphatase 2 regulatory subunit Bdelta | |
| Gene Alias | B55D | |
| Cytomap | 10q26.3 | |
| Gene Type | protein-coding | GO ID | GO:0000278 | UniProtAcc | Q66LE6 |
Top |
Malignant transformation analysis |
| Identification of the aberrant gene expression in precancerous and cancerous lesions by comparing the gene expression of stem-like cells in diseased tissues with normal stem cells |
| Entrez ID | Symbol | Replicates | Species | Organ | Tissue | Adj P-value | Log2FC | Malignancy |
| 55844 | PPP2R2D | CA_HPV_1 | Human | Cervix | CC | 4.99e-02 | -9.57e-02 | 0.0264 |
| 55844 | PPP2R2D | CCI_2 | Human | Cervix | CC | 2.74e-02 | 6.15e-01 | 0.5249 |
| 55844 | PPP2R2D | CCI_3 | Human | Cervix | CC | 1.08e-04 | 5.20e-01 | 0.516 |
| 55844 | PPP2R2D | LZE8T | Human | Esophagus | ESCC | 4.17e-02 | -8.79e-03 | 0.067 |
| 55844 | PPP2R2D | LZE24T | Human | Esophagus | ESCC | 2.20e-06 | 4.77e-02 | 0.0596 |
| 55844 | PPP2R2D | P1T-E | Human | Esophagus | ESCC | 2.55e-04 | 2.18e-01 | 0.0875 |
| 55844 | PPP2R2D | P2T-E | Human | Esophagus | ESCC | 2.12e-17 | 2.95e-01 | 0.1177 |
| 55844 | PPP2R2D | P4T-E | Human | Esophagus | ESCC | 3.18e-19 | 3.46e-01 | 0.1323 |
| 55844 | PPP2R2D | P5T-E | Human | Esophagus | ESCC | 2.64e-16 | 2.84e-01 | 0.1327 |
| 55844 | PPP2R2D | P8T-E | Human | Esophagus | ESCC | 1.34e-15 | 1.61e-01 | 0.0889 |
| 55844 | PPP2R2D | P9T-E | Human | Esophagus | ESCC | 2.68e-06 | 5.88e-02 | 0.1131 |
| 55844 | PPP2R2D | P10T-E | Human | Esophagus | ESCC | 1.31e-03 | 4.51e-03 | 0.116 |
| 55844 | PPP2R2D | P11T-E | Human | Esophagus | ESCC | 1.16e-06 | 1.36e-01 | 0.1426 |
| 55844 | PPP2R2D | P12T-E | Human | Esophagus | ESCC | 2.72e-12 | 1.92e-01 | 0.1122 |
| 55844 | PPP2R2D | P15T-E | Human | Esophagus | ESCC | 6.22e-13 | 2.41e-01 | 0.1149 |
| 55844 | PPP2R2D | P16T-E | Human | Esophagus | ESCC | 3.04e-15 | 6.94e-02 | 0.1153 |
| 55844 | PPP2R2D | P17T-E | Human | Esophagus | ESCC | 1.98e-02 | 2.74e-02 | 0.1278 |
| 55844 | PPP2R2D | P20T-E | Human | Esophagus | ESCC | 2.43e-08 | 9.03e-02 | 0.1124 |
| 55844 | PPP2R2D | P21T-E | Human | Esophagus | ESCC | 8.09e-08 | 1.12e-01 | 0.1617 |
| 55844 | PPP2R2D | P22T-E | Human | Esophagus | ESCC | 8.31e-10 | 1.45e-02 | 0.1236 |
| Page: 1 2 3 4 5 |
| Tissue | Expression Dynamics | Abbreviation |
| Cervix | 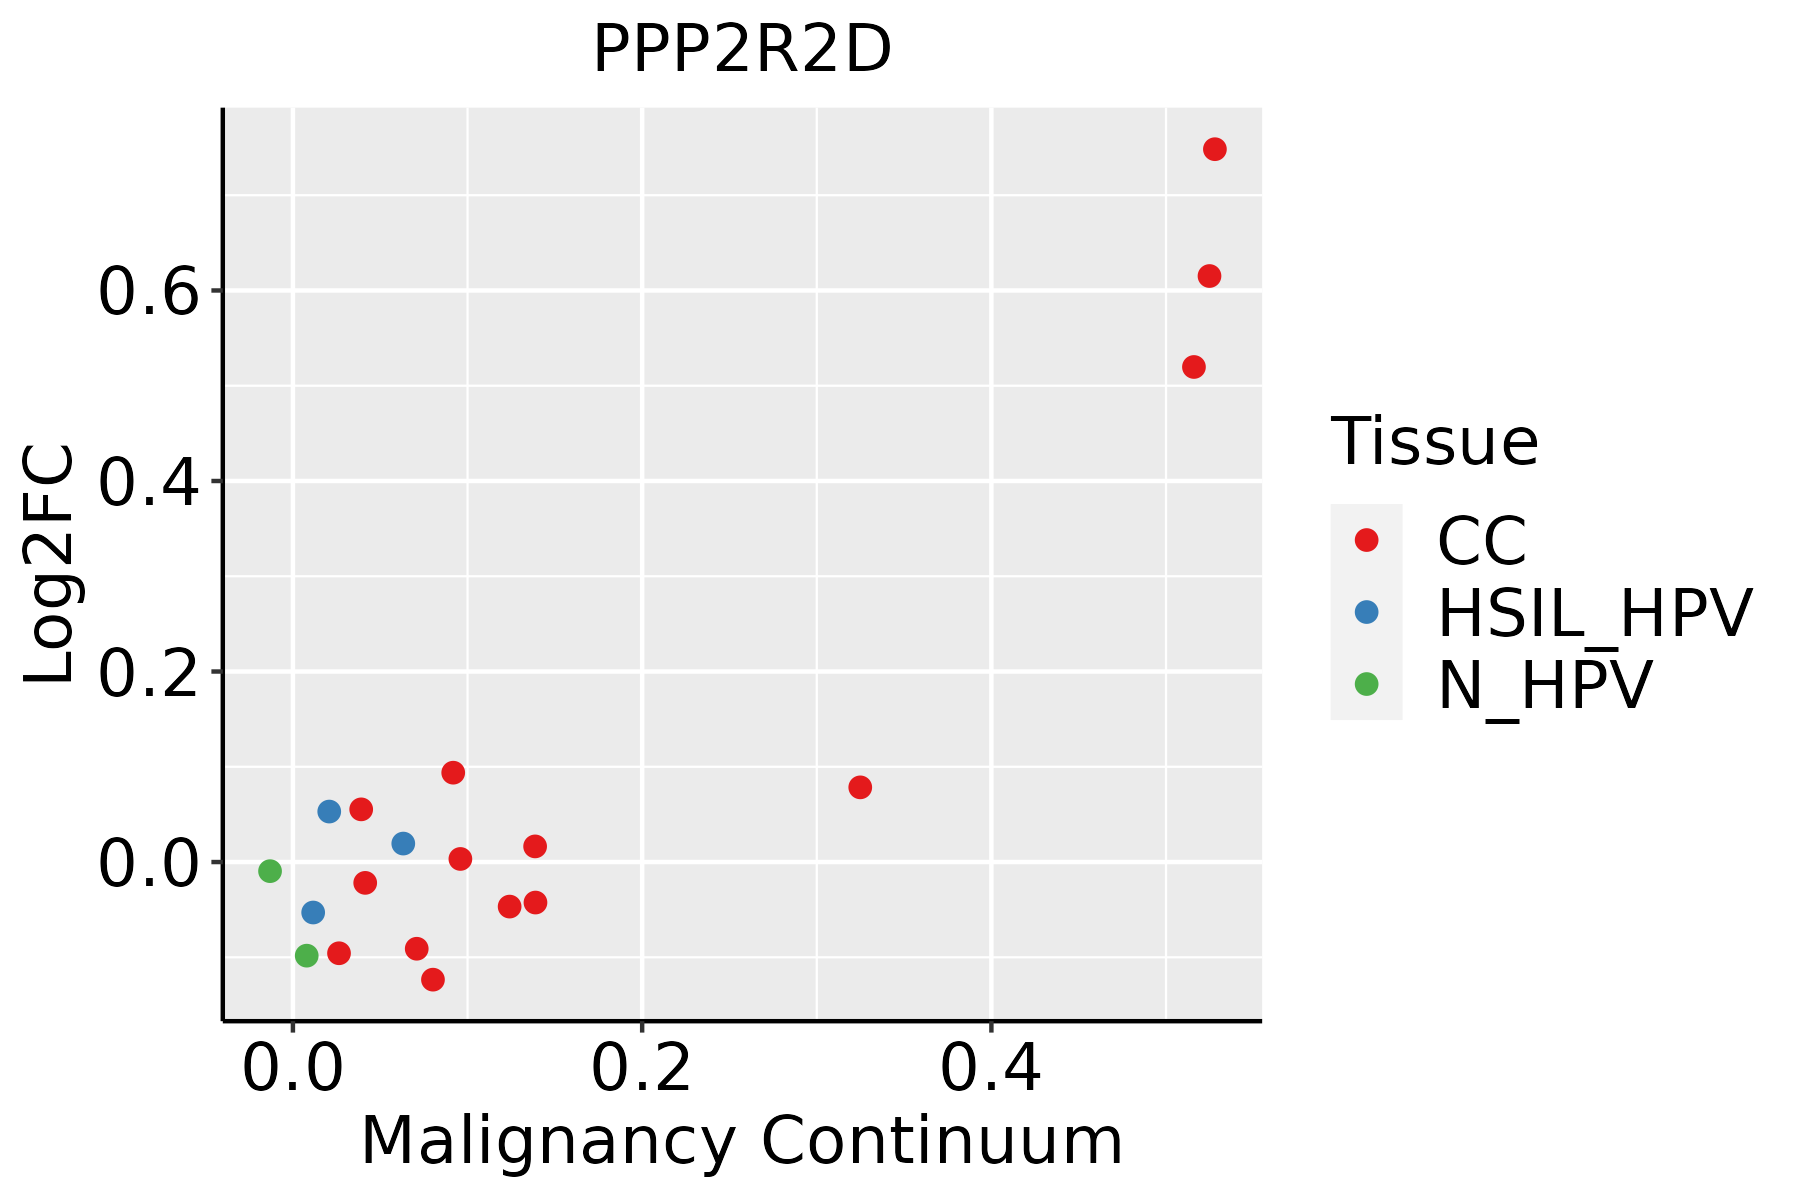 | CC: Cervix cancer |
| HSIL_HPV: HPV-infected high-grade squamous intraepithelial lesions | ||
| N_HPV: HPV-infected normal cervix | ||
| Esophagus |  | ESCC: Esophageal squamous cell carcinoma |
| HGIN: High-grade intraepithelial neoplasias | ||
| LGIN: Low-grade intraepithelial neoplasias | ||
| Oral Cavity |  | EOLP: Erosive Oral lichen planus |
| LP: leukoplakia | ||
| NEOLP: Non-erosive oral lichen planus | ||
| OSCC: Oral squamous cell carcinoma | ||
| Thyroid | 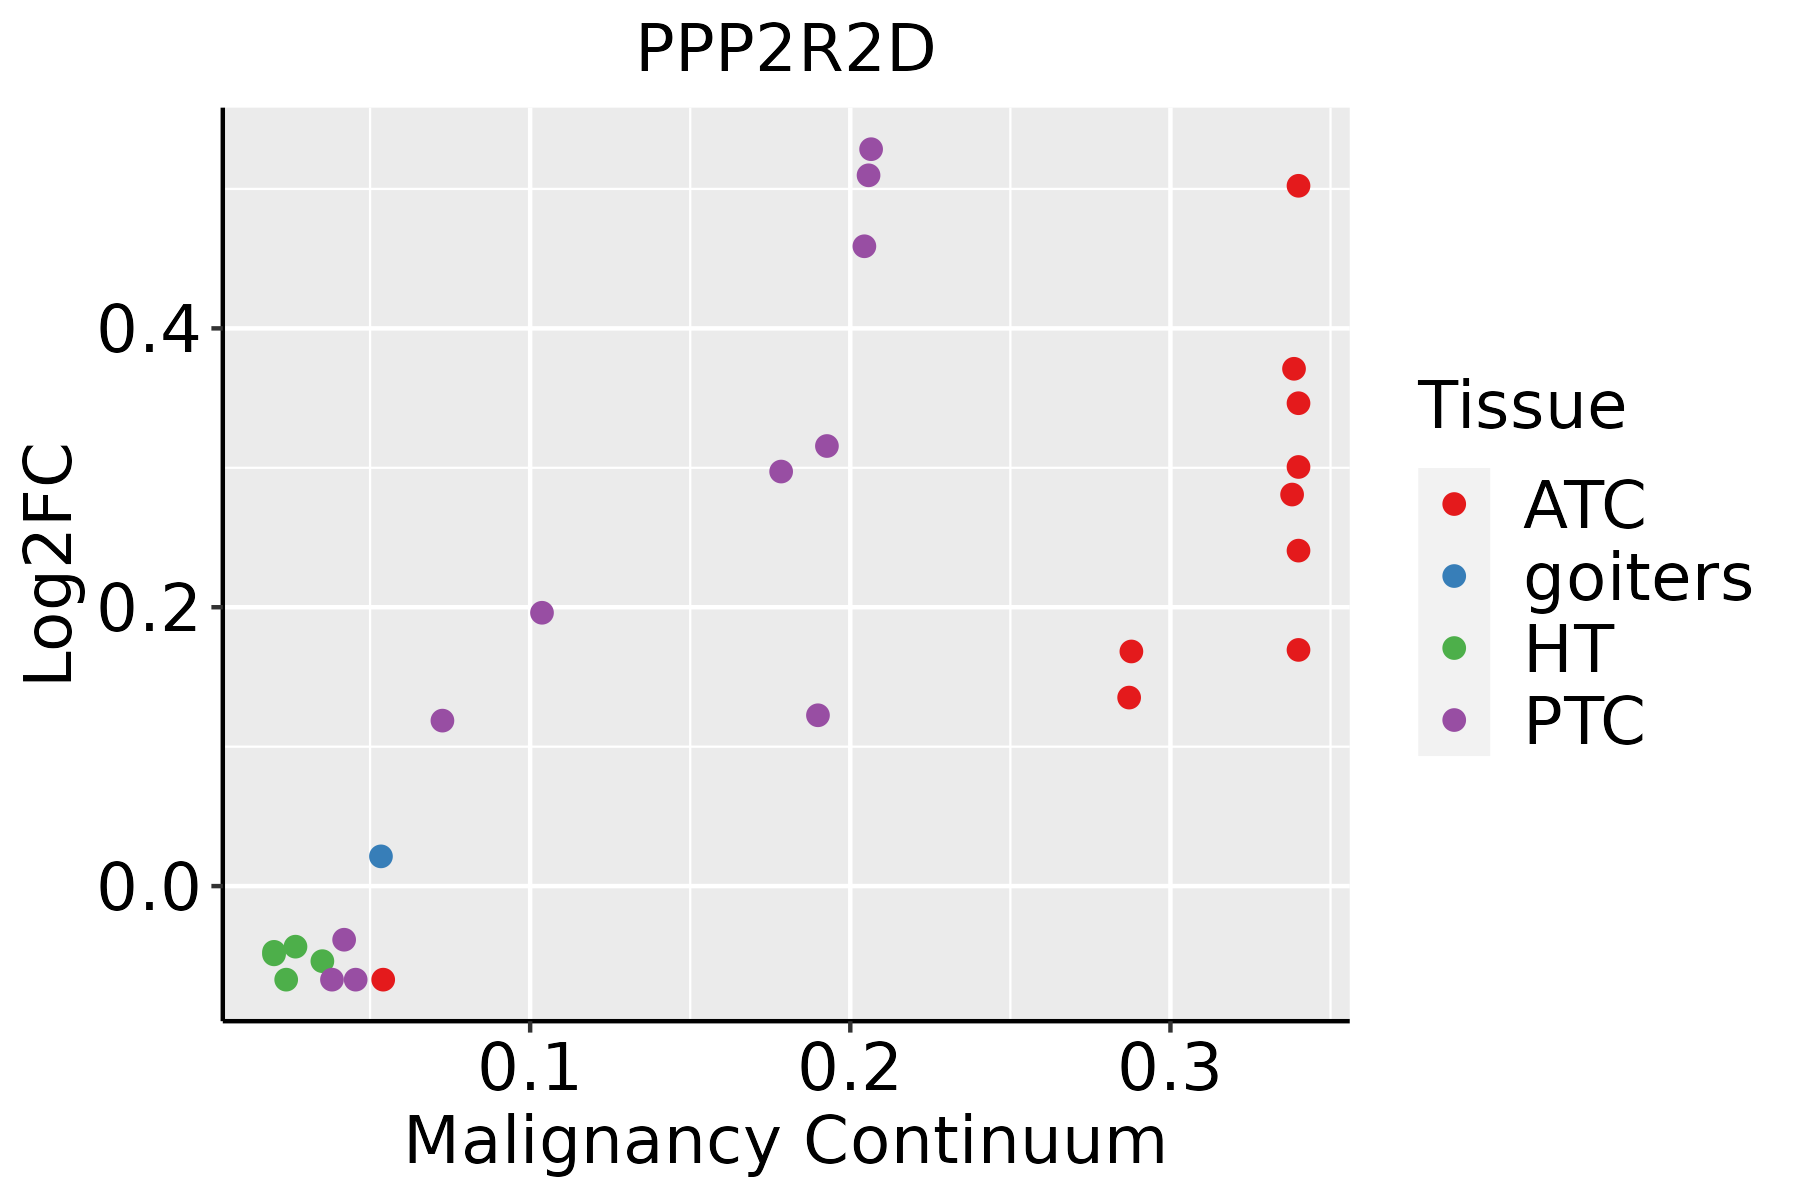 | ATC: Anaplastic thyroid cancer |
| HT: Hashimoto's thyroiditis | ||
| PTC: Papillary thyroid cancer |
| ∗log2FC in expression of this searched gene in stem-like cells from each diseased tissue sample relative to stem-like cells in normal samples in each tissue plotted against the malignancy continuum. Samples are colored based on if they are from different disease stage. |
Top |
Malignant transformation related pathway analysis |
| Find out the enriched GO biological processes and KEGG pathways involved in transition from healthy to precancer to cancer |
| Tissue | Disease Stage | Enriched GO biological Processes |
| Colorectum | AD |  |
| Colorectum | SER |  |
| Colorectum | MSS |  |
| Colorectum | MSI-H |  |
| Colorectum | FAP |  |
| ∗Top 15 enriched GO BP terms are showed in the bar plot of each disease state in each tissue. Each row represents a significant GO biological process which is colored according to the -log10(p.adjust). |
| Page: 1 2 3 4 5 6 7 8 9 |
| GO ID | Tissue | Disease Stage | Description | Gene Ratio | Bg Ratio | pvalue | p.adjust | Count |
| GO:00447725 | Cervix | CC | mitotic cell cycle phase transition | 89/2311 | 424/18723 | 2.70e-07 | 1.12e-05 | 89 |
| GO:00064708 | Cervix | CC | protein dephosphorylation | 60/2311 | 281/18723 | 1.33e-05 | 2.68e-04 | 60 |
| GO:00163117 | Cervix | CC | dephosphorylation | 73/2311 | 417/18723 | 1.23e-03 | 9.87e-03 | 73 |
| GO:01400143 | Cervix | CC | mitotic nuclear division | 50/2311 | 287/18723 | 7.27e-03 | 3.91e-02 | 50 |
| GO:00482851 | Cervix | CC | organelle fission | 78/2311 | 488/18723 | 9.70e-03 | 4.79e-02 | 78 |
| GO:014001414 | Esophagus | ESCC | mitotic nuclear division | 218/8552 | 287/18723 | 6.17e-26 | 1.78e-23 | 218 |
| GO:004477216 | Esophagus | ESCC | mitotic cell cycle phase transition | 281/8552 | 424/18723 | 4.63e-18 | 4.45e-16 | 281 |
| GO:00482853 | Esophagus | ESCC | organelle fission | 301/8552 | 488/18723 | 4.64e-13 | 2.12e-11 | 301 |
| GO:00002802 | Esophagus | ESCC | nuclear division | 270/8552 | 439/18723 | 1.17e-11 | 4.24e-10 | 270 |
| GO:001631110 | Esophagus | ESCC | dephosphorylation | 251/8552 | 417/18723 | 1.26e-09 | 2.99e-08 | 251 |
| GO:000647018 | Esophagus | ESCC | protein dephosphorylation | 177/8552 | 281/18723 | 3.13e-09 | 6.72e-08 | 177 |
| GO:00702624 | Esophagus | ESCC | peptidyl-serine dephosphorylation | 16/8552 | 19/18723 | 6.45e-04 | 3.43e-03 | 16 |
| GO:01400145 | Oral cavity | OSCC | mitotic nuclear division | 191/7305 | 287/18723 | 1.99e-21 | 3.70e-19 | 191 |
| GO:00447728 | Oral cavity | OSCC | mitotic cell cycle phase transition | 255/7305 | 424/18723 | 5.29e-19 | 6.98e-17 | 255 |
| GO:00482852 | Oral cavity | OSCC | organelle fission | 265/7305 | 488/18723 | 3.22e-12 | 1.27e-10 | 265 |
| GO:00002801 | Oral cavity | OSCC | nuclear division | 237/7305 | 439/18723 | 9.62e-11 | 2.90e-09 | 237 |
| GO:000647015 | Oral cavity | OSCC | protein dephosphorylation | 162/7305 | 281/18723 | 1.56e-10 | 4.56e-09 | 162 |
| GO:00163119 | Oral cavity | OSCC | dephosphorylation | 220/7305 | 417/18723 | 6.33e-09 | 1.34e-07 | 220 |
| GO:00702623 | Oral cavity | OSCC | peptidyl-serine dephosphorylation | 16/7305 | 19/18723 | 7.05e-05 | 5.60e-04 | 16 |
| GO:0010458 | Oral cavity | OSCC | exit from mitosis | 21/7305 | 29/18723 | 2.73e-04 | 1.73e-03 | 21 |
| Page: 1 2 3 |
| Pathway ID | Tissue | Disease Stage | Description | Gene Ratio | Bg Ratio | pvalue | p.adjust | qvalue | Count |
| hsa0453020 | Cervix | CC | Tight junction | 49/1267 | 169/8465 | 1.87e-06 | 1.78e-05 | 1.05e-05 | 49 |
| hsa0407110 | Cervix | CC | Sphingolipid signaling pathway | 35/1267 | 121/8465 | 5.70e-05 | 3.93e-04 | 2.32e-04 | 35 |
| hsa051657 | Cervix | CC | Human papillomavirus infection | 74/1267 | 331/8465 | 1.70e-04 | 1.02e-03 | 6.03e-04 | 74 |
| hsa043908 | Cervix | CC | Hippo signaling pathway | 40/1267 | 157/8465 | 3.64e-04 | 1.82e-03 | 1.07e-03 | 40 |
| hsa04530110 | Cervix | CC | Tight junction | 49/1267 | 169/8465 | 1.87e-06 | 1.78e-05 | 1.05e-05 | 49 |
| hsa0407113 | Cervix | CC | Sphingolipid signaling pathway | 35/1267 | 121/8465 | 5.70e-05 | 3.93e-04 | 2.32e-04 | 35 |
| hsa0516512 | Cervix | CC | Human papillomavirus infection | 74/1267 | 331/8465 | 1.70e-04 | 1.02e-03 | 6.03e-04 | 74 |
| hsa0439013 | Cervix | CC | Hippo signaling pathway | 40/1267 | 157/8465 | 3.64e-04 | 1.82e-03 | 1.07e-03 | 40 |
| hsa0516510 | Esophagus | ESCC | Human papillomavirus infection | 215/4205 | 331/8465 | 7.86e-09 | 7.12e-08 | 3.65e-08 | 215 |
| hsa0301524 | Esophagus | ESCC | mRNA surveillance pathway | 72/4205 | 97/8465 | 6.12e-07 | 4.10e-06 | 2.10e-06 | 72 |
| hsa051609 | Esophagus | ESCC | Hepatitis C | 107/4205 | 157/8465 | 1.75e-06 | 1.08e-05 | 5.55e-06 | 107 |
| hsa0407116 | Esophagus | ESCC | Sphingolipid signaling pathway | 85/4205 | 121/8465 | 3.04e-06 | 1.73e-05 | 8.84e-06 | 85 |
| hsa0415210 | Esophagus | ESCC | AMPK signaling pathway | 80/4205 | 121/8465 | 1.73e-04 | 6.67e-04 | 3.42e-04 | 80 |
| hsa04530211 | Esophagus | ESCC | Tight junction | 105/4205 | 169/8465 | 6.73e-04 | 2.23e-03 | 1.14e-03 | 105 |
| hsa051425 | Esophagus | ESCC | Chagas disease | 65/4205 | 102/8465 | 2.81e-03 | 7.59e-03 | 3.89e-03 | 65 |
| hsa041517 | Esophagus | ESCC | PI3K-Akt signaling pathway | 197/4205 | 354/8465 | 1.24e-02 | 2.83e-02 | 1.45e-02 | 197 |
| hsa0439018 | Esophagus | ESCC | Hippo signaling pathway | 92/4205 | 157/8465 | 1.46e-02 | 3.31e-02 | 1.69e-02 | 92 |
| hsa0516515 | Esophagus | ESCC | Human papillomavirus infection | 215/4205 | 331/8465 | 7.86e-09 | 7.12e-08 | 3.65e-08 | 215 |
| hsa0301534 | Esophagus | ESCC | mRNA surveillance pathway | 72/4205 | 97/8465 | 6.12e-07 | 4.10e-06 | 2.10e-06 | 72 |
| hsa0516016 | Esophagus | ESCC | Hepatitis C | 107/4205 | 157/8465 | 1.75e-06 | 1.08e-05 | 5.55e-06 | 107 |
| Page: 1 2 3 4 |
Top |
Cell-cell communication analysis |
| Identification of potential cell-cell interactions between two cell types and their ligand-receptor pairs for different disease states |
| Ligand | Receptor | LRpair | Pathway | Tissue | Disease Stage |
| Page: 1 |
Top |
Single-cell gene regulatory network inference analysis |
| Find out the significant the regulons (TFs) and the target genes of each regulon across cell types for different disease states |
| TF | Cell Type | Tissue | Disease Stage | Target Gene | RSS | Regulon Activity |
| ∗The dot plots of a searched regulon are shown for all cell subpopulations in each disease state of each tissue based on the regulon specific score inferred using pySCENIC and by calculating the average expression. |
| Page: 1 |
Top |
Somatic mutation of malignant transformation related genes |
| Annotation of somatic variants for genes involved in malignant transformation |
| Hugo Symbol | Variant Class | Variant Classification | dbSNP RS | HGVSc | HGVSp | HGVSp Short | SWISSPROT | BIOTYPE | SIFT | PolyPhen | Tumor Sample Barcode | Tissue | Histology | Sex | Age | Stage | Therapy Types | Drugs | Outcome |
| PPP2R2D | SNV | Missense_Mutation | c.192A>T | p.Glu64Asp | p.E64D | Q66LE6 | protein_coding | tolerated(0.36) | benign(0.003) | TCGA-AN-A0XU-01 | Breast | breast invasive carcinoma | Female | <65 | I/II | Unknown | Unknown | SD | |
| PPP2R2D | insertion | Nonsense_Mutation | novel | c.738_739insTAGGAAGCCTCCCTGACCACAGCACTCAACACAGAGATGG | p.Val247Ter | p.V247* | Q66LE6 | protein_coding | TCGA-AN-A0FS-01 | Breast | breast invasive carcinoma | Female | <65 | I/II | Unknown | Unknown | SD | ||
| PPP2R2D | insertion | In_Frame_Ins | novel | c.1073_1074insCCACTTCCTACTTGAACTTGAAAA | p.Gly358_Ser359insHisPheLeuLeuGluLeuGluAsn | p.G358_S359insHFLLELEN | Q66LE6 | protein_coding | TCGA-AN-A0FX-01 | Breast | breast invasive carcinoma | Female | <65 | I/II | Unknown | Unknown | SD | ||
| PPP2R2D | insertion | Nonsense_Mutation | novel | c.1052_1053insAGAACAGTAGGCCTTTACTAGGCCCAGTCTTG | p.Phe352GlufsTer3 | p.F352Efs*3 | Q66LE6 | protein_coding | TCGA-BH-A0HQ-01 | Breast | breast invasive carcinoma | Female | <65 | I/II | Hormone Therapy | arimidex | SD | ||
| PPP2R2D | SNV | Missense_Mutation | c.1156G>A | p.Glu386Lys | p.E386K | Q66LE6 | protein_coding | deleterious(0) | probably_damaging(0.944) | TCGA-C5-A1BE-01 | Cervix | cervical & endocervical cancer | Female | <65 | I/II | Chemotherapy | cisplatin | PD | |
| PPP2R2D | SNV | Missense_Mutation | c.489G>C | p.Leu163Phe | p.L163F | Q66LE6 | protein_coding | tolerated(0.15) | benign(0.012) | TCGA-EK-A2PM-01 | Cervix | cervical & endocervical cancer | Female | >=65 | I/II | Unknown | Unknown | SD | |
| PPP2R2D | SNV | Missense_Mutation | rs193198132 | c.1007N>A | p.Arg336His | p.R336H | Q66LE6 | protein_coding | deleterious(0.01) | probably_damaging(0.968) | TCGA-AA-A010-01 | Colorectum | colon adenocarcinoma | Female | <65 | I/II | Chemotherapy | folinic | CR |
| PPP2R2D | SNV | Missense_Mutation | novel | c.562N>G | p.Ser188Ala | p.S188A | Q66LE6 | protein_coding | deleterious(0.02) | probably_damaging(1) | TCGA-AA-A01D-01 | Colorectum | colon adenocarcinoma | Female | <65 | III/IV | Chemotherapy | capecitabine | PD |
| PPP2R2D | SNV | Missense_Mutation | c.527G>A | p.Arg176Gln | p.R176Q | Q66LE6 | protein_coding | deleterious(0.05) | probably_damaging(0.969) | TCGA-AZ-4315-01 | Colorectum | colon adenocarcinoma | Male | <65 | I/II | Unknown | Unknown | SD | |
| PPP2R2D | SNV | Missense_Mutation | novel | c.1307T>C | p.Val436Ala | p.V436A | Q66LE6 | protein_coding | deleterious(0.02) | benign(0.096) | TCGA-AZ-4315-01 | Colorectum | colon adenocarcinoma | Male | <65 | I/II | Unknown | Unknown | SD |
| Page: 1 2 3 4 5 |
Top |
Related drugs of malignant transformation related genes |
| Identification of chemicals and drugs interact with genes involved in malignant transfromation |
| (DGIdb 4.0) |
| Entrez ID | Symbol | Category | Interaction Types | Drug Claim Name | Drug Name | PMIDs |
| Page: 1 |

Copyright 2023-Present -The University of Texas Health Science Center at Houston |