
|
|||||
|
 | |
| |
| |
| |
| |
| |
|
Gene: PPP2R2C |
Gene summary for PPP2R2C |
| Gene information | Species | Human | Gene symbol | PPP2R2C | Gene ID | 5522 |
| Gene name | protein phosphatase 2 regulatory subunit Bgamma | |
| Gene Alias | B55-GAMMA | |
| Cytomap | 4p16.1 | |
| Gene Type | protein-coding | GO ID | GO:0006464 | UniProtAcc | Q9Y2T4 |
Top |
Malignant transformation analysis |
| Identification of the aberrant gene expression in precancerous and cancerous lesions by comparing the gene expression of stem-like cells in diseased tissues with normal stem cells |
| Entrez ID | Symbol | Replicates | Species | Organ | Tissue | Adj P-value | Log2FC | Malignancy |
| 5522 | PPP2R2C | P5T-E | Human | Esophagus | ESCC | 2.72e-02 | 2.06e-02 | 0.1327 |
| 5522 | PPP2R2C | P11T-E | Human | Esophagus | ESCC | 2.99e-03 | 2.17e-01 | 0.1426 |
| 5522 | PPP2R2C | P20T-E | Human | Esophagus | ESCC | 2.79e-02 | 3.90e-02 | 0.1124 |
| 5522 | PPP2R2C | P21T-E | Human | Esophagus | ESCC | 1.01e-05 | 2.04e-02 | 0.1617 |
| 5522 | PPP2R2C | P22T-E | Human | Esophagus | ESCC | 2.96e-02 | 5.73e-02 | 0.1236 |
| 5522 | PPP2R2C | P30T-E | Human | Esophagus | ESCC | 1.23e-02 | 2.57e-01 | 0.137 |
| 5522 | PPP2R2C | P37T-E | Human | Esophagus | ESCC | 4.66e-03 | 1.59e-01 | 0.1371 |
| 5522 | PPP2R2C | P47T-E | Human | Esophagus | ESCC | 1.70e-05 | 5.42e-02 | 0.1067 |
| 5522 | PPP2R2C | P52T-E | Human | Esophagus | ESCC | 8.74e-04 | 1.79e-01 | 0.1555 |
| 5522 | PPP2R2C | P56T-E | Human | Esophagus | ESCC | 2.84e-02 | 5.18e-01 | 0.1613 |
| 5522 | PPP2R2C | P91T-E | Human | Esophagus | ESCC | 2.28e-06 | 7.28e-01 | 0.1828 |
| 5522 | PPP2R2C | P107T-E | Human | Esophagus | ESCC | 3.93e-08 | 2.99e-01 | 0.171 |
| 5522 | PPP2R2C | P130T-E | Human | Esophagus | ESCC | 1.90e-05 | 2.12e-01 | 0.1676 |
| 5522 | PPP2R2C | C04 | Human | Oral cavity | OSCC | 9.33e-08 | 5.35e-01 | 0.2633 |
| 5522 | PPP2R2C | C30 | Human | Oral cavity | OSCC | 1.60e-27 | 1.31e+00 | 0.3055 |
| 5522 | PPP2R2C | C51 | Human | Oral cavity | OSCC | 3.88e-27 | 1.05e+00 | 0.2674 |
| 5522 | PPP2R2C | C06 | Human | Oral cavity | OSCC | 1.68e-05 | 1.12e+00 | 0.2699 |
| 5522 | PPP2R2C | C09 | Human | Oral cavity | OSCC | 1.34e-04 | 2.43e-01 | 0.1431 |
| 5522 | PPP2R2C | SYSMH1 | Human | Oral cavity | OSCC | 5.24e-28 | 5.88e-01 | 0.1127 |
| 5522 | PPP2R2C | SYSMH2 | Human | Oral cavity | OSCC | 1.99e-13 | 4.91e-01 | 0.2326 |
| Page: 1 2 |
| Tissue | Expression Dynamics | Abbreviation |
| Esophagus |  | ESCC: Esophageal squamous cell carcinoma |
| HGIN: High-grade intraepithelial neoplasias | ||
| LGIN: Low-grade intraepithelial neoplasias | ||
| Oral Cavity | 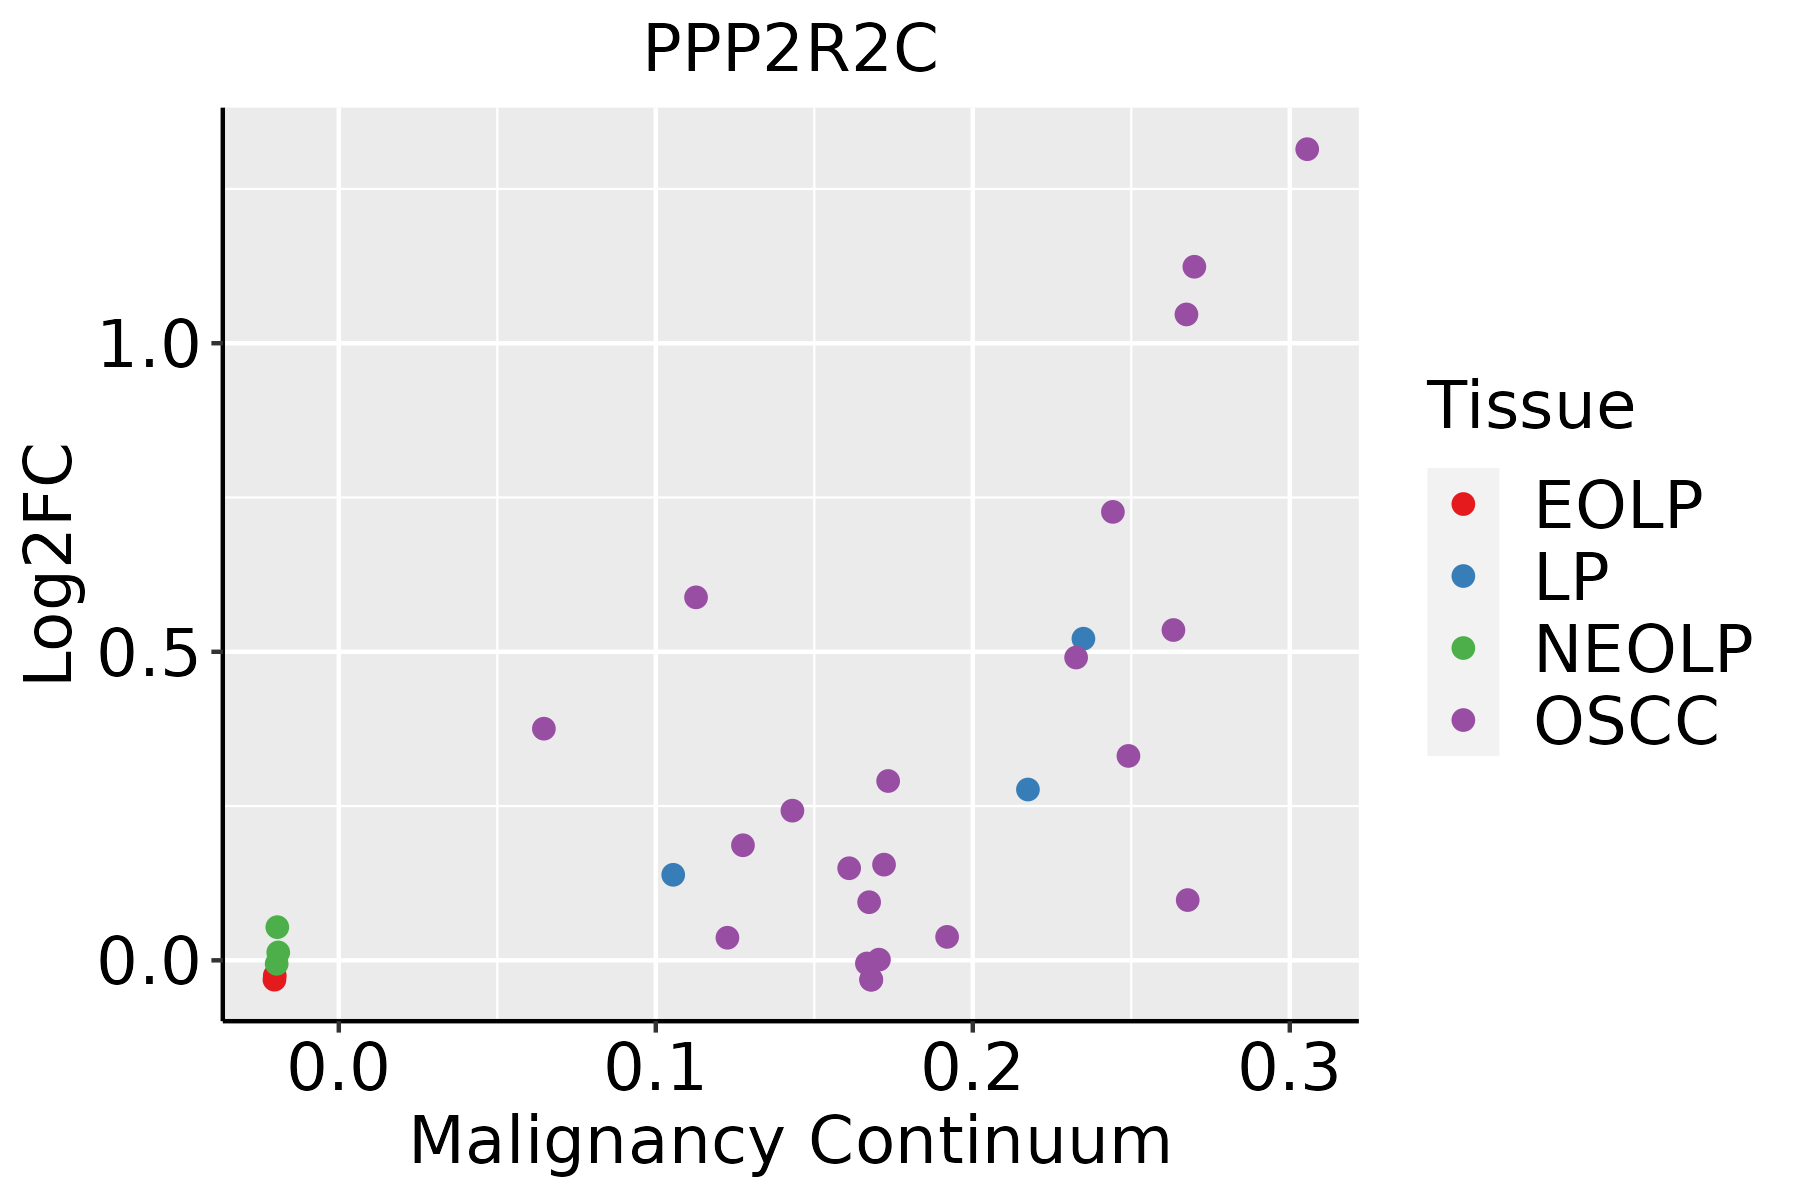 | EOLP: Erosive Oral lichen planus |
| LP: leukoplakia | ||
| NEOLP: Non-erosive oral lichen planus | ||
| OSCC: Oral squamous cell carcinoma | ||
| Skin | 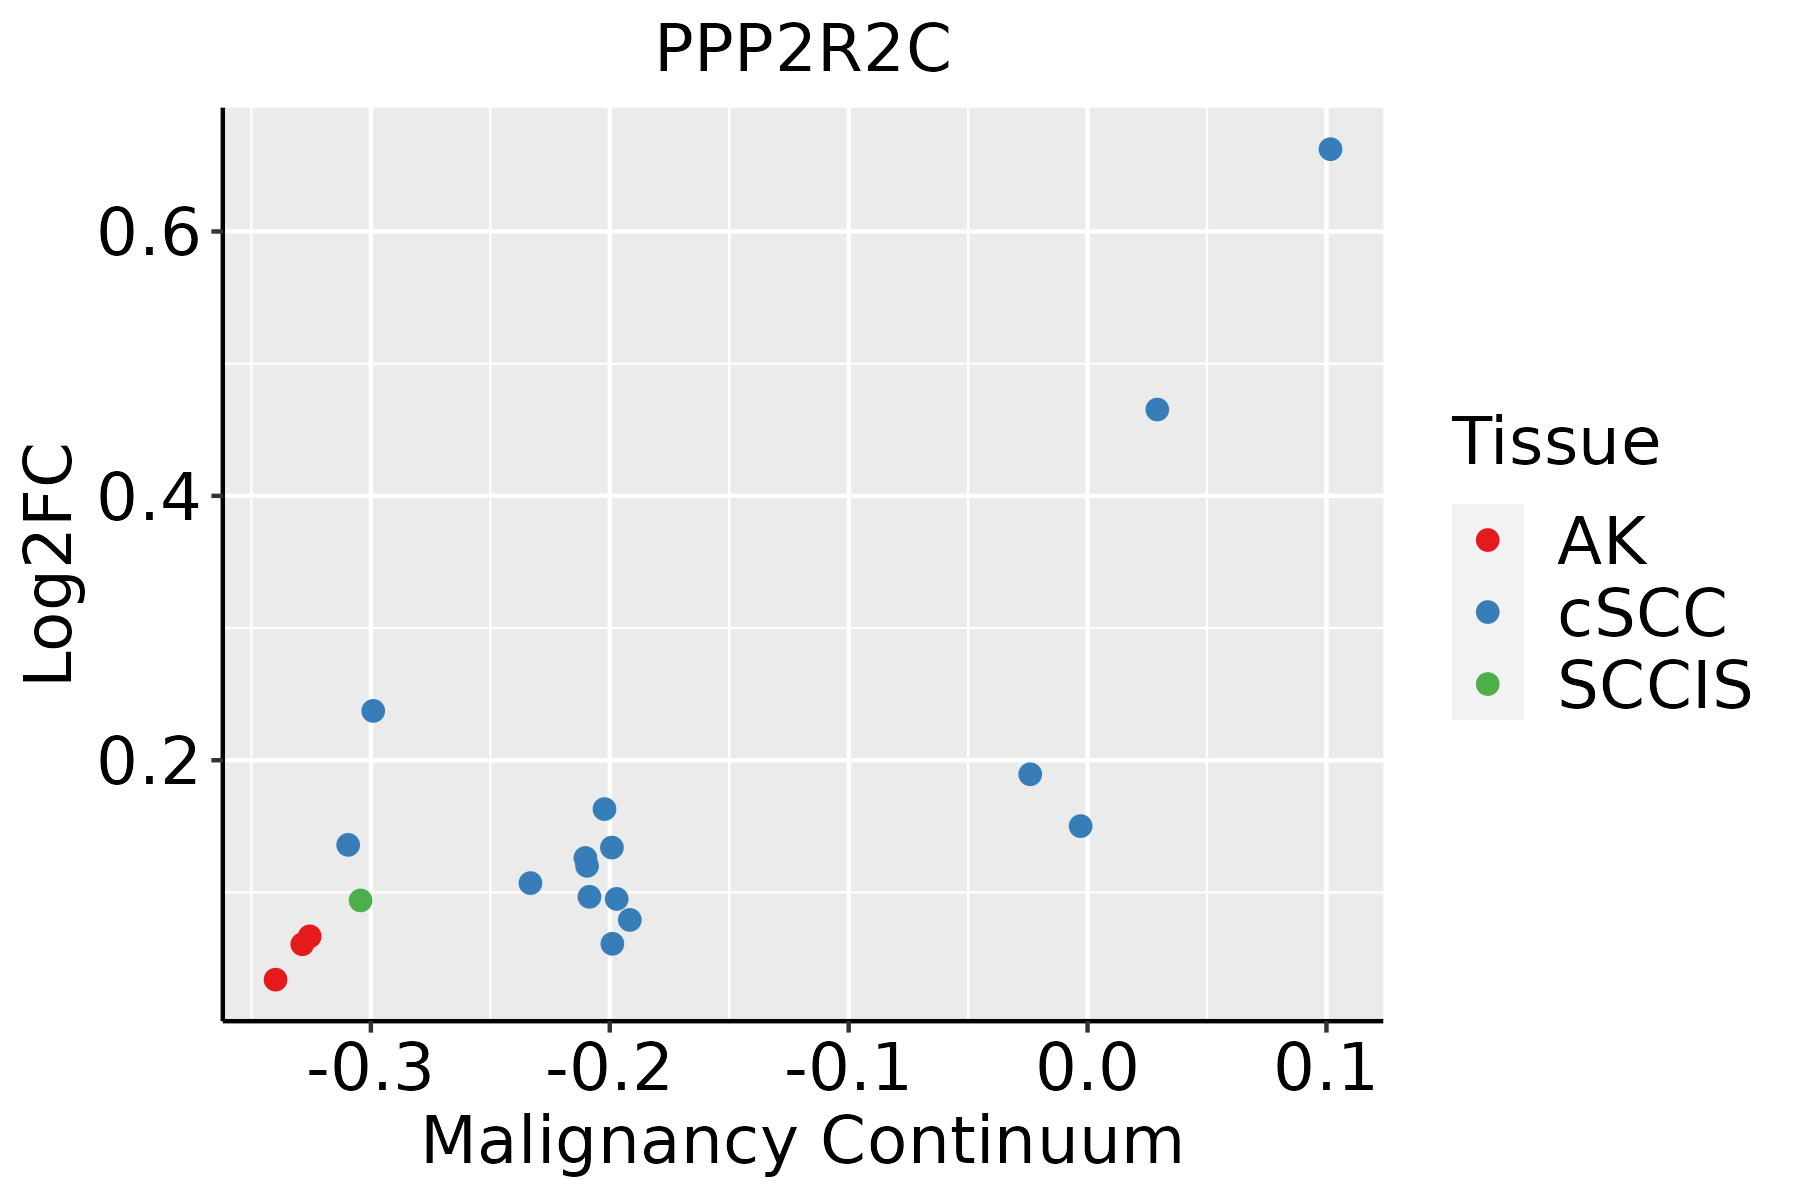 | AK: Actinic keratosis |
| cSCC: Cutaneous squamous cell carcinoma | ||
| SCCIS:squamous cell carcinoma in situ |
| ∗log2FC in expression of this searched gene in stem-like cells from each diseased tissue sample relative to stem-like cells in normal samples in each tissue plotted against the malignancy continuum. Samples are colored based on if they are from different disease stage. |
Top |
Malignant transformation related pathway analysis |
| Find out the enriched GO biological processes and KEGG pathways involved in transition from healthy to precancer to cancer |
| Tissue | Disease Stage | Enriched GO biological Processes |
| Colorectum | AD |  |
| Colorectum | SER |  |
| Colorectum | MSS |  |
| Colorectum | MSI-H |  |
| Colorectum | FAP |  |
| ∗Top 15 enriched GO BP terms are showed in the bar plot of each disease state in each tissue. Each row represents a significant GO biological process which is colored according to the -log10(p.adjust). |
| Page: 1 2 3 4 5 6 7 8 9 |
| GO ID | Tissue | Disease Stage | Description | Gene Ratio | Bg Ratio | pvalue | p.adjust | Count |
| GO:001631110 | Esophagus | ESCC | dephosphorylation | 251/8552 | 417/18723 | 1.26e-09 | 2.99e-08 | 251 |
| GO:000647018 | Esophagus | ESCC | protein dephosphorylation | 177/8552 | 281/18723 | 3.13e-09 | 6.72e-08 | 177 |
| GO:00702624 | Esophagus | ESCC | peptidyl-serine dephosphorylation | 16/8552 | 19/18723 | 6.45e-04 | 3.43e-03 | 16 |
| GO:000647015 | Oral cavity | OSCC | protein dephosphorylation | 162/7305 | 281/18723 | 1.56e-10 | 4.56e-09 | 162 |
| GO:00163119 | Oral cavity | OSCC | dephosphorylation | 220/7305 | 417/18723 | 6.33e-09 | 1.34e-07 | 220 |
| GO:00702623 | Oral cavity | OSCC | peptidyl-serine dephosphorylation | 16/7305 | 19/18723 | 7.05e-05 | 5.60e-04 | 16 |
| GO:000647024 | Skin | cSCC | protein dephosphorylation | 111/4864 | 281/18723 | 4.10e-07 | 7.96e-06 | 111 |
| GO:007026212 | Skin | cSCC | peptidyl-serine dephosphorylation | 12/4864 | 19/18723 | 7.03e-04 | 4.98e-03 | 12 |
| GO:001631115 | Skin | cSCC | dephosphorylation | 134/4864 | 417/18723 | 2.65e-03 | 1.50e-02 | 134 |
| Page: 1 |
| Pathway ID | Tissue | Disease Stage | Description | Gene Ratio | Bg Ratio | pvalue | p.adjust | qvalue | Count |
| hsa0516510 | Esophagus | ESCC | Human papillomavirus infection | 215/4205 | 331/8465 | 7.86e-09 | 7.12e-08 | 3.65e-08 | 215 |
| hsa0407116 | Esophagus | ESCC | Sphingolipid signaling pathway | 85/4205 | 121/8465 | 3.04e-06 | 1.73e-05 | 8.84e-06 | 85 |
| hsa051425 | Esophagus | ESCC | Chagas disease | 65/4205 | 102/8465 | 2.81e-03 | 7.59e-03 | 3.89e-03 | 65 |
| hsa041517 | Esophagus | ESCC | PI3K-Akt signaling pathway | 197/4205 | 354/8465 | 1.24e-02 | 2.83e-02 | 1.45e-02 | 197 |
| hsa0439018 | Esophagus | ESCC | Hippo signaling pathway | 92/4205 | 157/8465 | 1.46e-02 | 3.31e-02 | 1.69e-02 | 92 |
| hsa0516515 | Esophagus | ESCC | Human papillomavirus infection | 215/4205 | 331/8465 | 7.86e-09 | 7.12e-08 | 3.65e-08 | 215 |
| hsa0407117 | Esophagus | ESCC | Sphingolipid signaling pathway | 85/4205 | 121/8465 | 3.04e-06 | 1.73e-05 | 8.84e-06 | 85 |
| hsa0514213 | Esophagus | ESCC | Chagas disease | 65/4205 | 102/8465 | 2.81e-03 | 7.59e-03 | 3.89e-03 | 65 |
| hsa0415114 | Esophagus | ESCC | PI3K-Akt signaling pathway | 197/4205 | 354/8465 | 1.24e-02 | 2.83e-02 | 1.45e-02 | 197 |
| hsa0439019 | Esophagus | ESCC | Hippo signaling pathway | 92/4205 | 157/8465 | 1.46e-02 | 3.31e-02 | 1.69e-02 | 92 |
| hsa030158 | Oral cavity | OSCC | mRNA surveillance pathway | 75/3704 | 97/8465 | 1.30e-11 | 2.01e-10 | 1.02e-10 | 75 |
| hsa051659 | Oral cavity | OSCC | Human papillomavirus infection | 200/3704 | 331/8465 | 3.83e-10 | 4.93e-09 | 2.51e-09 | 200 |
| hsa051608 | Oral cavity | OSCC | Hepatitis C | 103/3704 | 157/8465 | 2.17e-08 | 1.96e-07 | 9.99e-08 | 103 |
| hsa0407114 | Oral cavity | OSCC | Sphingolipid signaling pathway | 82/3704 | 121/8465 | 6.97e-08 | 5.08e-07 | 2.58e-07 | 82 |
| hsa0453030 | Oral cavity | OSCC | Tight junction | 102/3704 | 169/8465 | 8.68e-06 | 3.93e-05 | 2.00e-05 | 102 |
| hsa051424 | Oral cavity | OSCC | Chagas disease | 64/3704 | 102/8465 | 8.00e-05 | 2.95e-04 | 1.50e-04 | 64 |
| hsa041516 | Oral cavity | OSCC | PI3K-Akt signaling pathway | 185/3704 | 354/8465 | 6.26e-04 | 1.86e-03 | 9.49e-04 | 185 |
| hsa041529 | Oral cavity | OSCC | AMPK signaling pathway | 71/3704 | 121/8465 | 6.29e-04 | 1.86e-03 | 9.49e-04 | 71 |
| hsa0439016 | Oral cavity | OSCC | Hippo signaling pathway | 86/3704 | 157/8465 | 3.30e-03 | 8.24e-03 | 4.20e-03 | 86 |
| hsa0301513 | Oral cavity | OSCC | mRNA surveillance pathway | 75/3704 | 97/8465 | 1.30e-11 | 2.01e-10 | 1.02e-10 | 75 |
| Page: 1 2 |
Top |
Cell-cell communication analysis |
| Identification of potential cell-cell interactions between two cell types and their ligand-receptor pairs for different disease states |
| Ligand | Receptor | LRpair | Pathway | Tissue | Disease Stage |
| Page: 1 |
Top |
Single-cell gene regulatory network inference analysis |
| Find out the significant the regulons (TFs) and the target genes of each regulon across cell types for different disease states |
| TF | Cell Type | Tissue | Disease Stage | Target Gene | RSS | Regulon Activity |
| ∗The dot plots of a searched regulon are shown for all cell subpopulations in each disease state of each tissue based on the regulon specific score inferred using pySCENIC and by calculating the average expression. |
| Page: 1 |
Top |
Somatic mutation of malignant transformation related genes |
| Annotation of somatic variants for genes involved in malignant transformation |
| Hugo Symbol | Variant Class | Variant Classification | dbSNP RS | HGVSc | HGVSp | HGVSp Short | SWISSPROT | BIOTYPE | SIFT | PolyPhen | Tumor Sample Barcode | Tissue | Histology | Sex | Age | Stage | Therapy Types | Drugs | Outcome |
| PPP2R2C | insertion | Frame_Shift_Ins | novel | c.353_354insCCCCTTGCCTCAGTTTCCTCACCAGCAGCATACA | p.Trp118CysfsTer19 | p.W118Cfs*19 | Q9Y2T4 | protein_coding | TCGA-BH-A0EB-01 | Breast | breast invasive carcinoma | Female | >=65 | I/II | Hormone Therapy | arimidex | SD | ||
| PPP2R2C | SNV | Missense_Mutation | c.1299N>G | p.Asn433Lys | p.N433K | Q9Y2T4 | protein_coding | deleterious(0) | probably_damaging(0.974) | TCGA-EK-A2PL-01 | Cervix | cervical & endocervical cancer | Female | <65 | III/IV | Unknown | Unknown | SD | |
| PPP2R2C | SNV | Missense_Mutation | novel | c.83N>G | p.Ser28Cys | p.S28C | Q9Y2T4 | protein_coding | deleterious(0) | probably_damaging(1) | TCGA-JW-A5VL-01 | Cervix | cervical & endocervical cancer | Female | <65 | I/II | Unknown | Unknown | SD |
| PPP2R2C | SNV | Missense_Mutation | rs754747800 | c.1139N>G | p.Glu380Gly | p.E380G | Q9Y2T4 | protein_coding | deleterious(0.03) | possibly_damaging(0.618) | TCGA-A6-5661-01 | Colorectum | colon adenocarcinoma | Female | >=65 | I/II | Unknown | Unknown | SD |
| PPP2R2C | SNV | Missense_Mutation | rs375066274 | c.1183N>A | p.Val395Met | p.V395M | Q9Y2T4 | protein_coding | tolerated(0.25) | benign(0.04) | TCGA-AA-3994-01 | Colorectum | colon adenocarcinoma | Male | >=65 | III/IV | Chemotherapy | capecitabine | CR |
| PPP2R2C | SNV | Missense_Mutation | rs747639231 | c.850G>A | p.Val284Met | p.V284M | Q9Y2T4 | protein_coding | deleterious(0.02) | possibly_damaging(0.537) | TCGA-AA-A02E-01 | Colorectum | colon adenocarcinoma | Female | >=65 | III/IV | Unknown | Unknown | PD |
| PPP2R2C | SNV | Missense_Mutation | novel | c.1336N>G | p.Met446Val | p.M446V | Q9Y2T4 | protein_coding | tolerated_low_confidence(0.49) | benign(0) | TCGA-AD-5900-01 | Colorectum | colon adenocarcinoma | Male | >=65 | I/II | Unknown | Unknown | SD |
| PPP2R2C | SNV | Missense_Mutation | rs371827360 | c.631G>A | p.Val211Met | p.V211M | Q9Y2T4 | protein_coding | deleterious(0.02) | probably_damaging(0.965) | TCGA-CA-5255-01 | Colorectum | colon adenocarcinoma | Male | <65 | I/II | Chemotherapy | oxaliplatin | CR |
| PPP2R2C | SNV | Missense_Mutation | rs776449314 | c.821N>A | p.Arg274His | p.R274H | Q9Y2T4 | protein_coding | tolerated(0.1) | benign(0.013) | TCGA-CA-6717-01 | Colorectum | colon adenocarcinoma | Male | <65 | I/II | Chemotherapy | oxaliplatin | CR |
| PPP2R2C | SNV | Missense_Mutation | c.224G>A | p.Ser75Asn | p.S75N | Q9Y2T4 | protein_coding | deleterious(0) | probably_damaging(0.974) | TCGA-CA-6718-01 | Colorectum | colon adenocarcinoma | Male | <65 | I/II | Unknown | Unknown | PD |
| Page: 1 2 3 4 5 6 7 |
Top |
Related drugs of malignant transformation related genes |
| Identification of chemicals and drugs interact with genes involved in malignant transfromation |
| (DGIdb 4.0) |
| Entrez ID | Symbol | Category | Interaction Types | Drug Claim Name | Drug Name | PMIDs |
| Page: 1 |

Copyright 2023-Present -The University of Texas Health Science Center at Houston |