
|
|||||
|
 | |
| |
| |
| |
| |
| |
|
Gene: PPP2R1B |
Gene summary for PPP2R1B |
| Gene information | Species | Human | Gene symbol | PPP2R1B | Gene ID | 5519 |
| Gene name | protein phosphatase 2 scaffold subunit Abeta | |
| Gene Alias | PP2A-Abeta | |
| Cytomap | 11q23.1 | |
| Gene Type | protein-coding | GO ID | GO:0006464 | UniProtAcc | P30154 |
Top |
Malignant transformation analysis |
| Identification of the aberrant gene expression in precancerous and cancerous lesions by comparing the gene expression of stem-like cells in diseased tissues with normal stem cells |
| Entrez ID | Symbol | Replicates | Species | Organ | Tissue | Adj P-value | Log2FC | Malignancy |
| 5519 | PPP2R1B | NAFLD1 | Human | Liver | NAFLD | 3.54e-09 | 9.00e-01 | -0.04 |
| 5519 | PPP2R1B | S43 | Human | Liver | Cirrhotic | 2.57e-05 | -2.11e-01 | -0.0187 |
| 5519 | PPP2R1B | HCC1_Meng | Human | Liver | HCC | 5.84e-51 | -1.32e-01 | 0.0246 |
| 5519 | PPP2R1B | HCC2_Meng | Human | Liver | HCC | 1.46e-07 | -2.06e-01 | 0.0107 |
| 5519 | PPP2R1B | cirrhotic1 | Human | Liver | Cirrhotic | 3.32e-02 | -1.90e-01 | 0.0202 |
| 5519 | PPP2R1B | HCC1 | Human | Liver | HCC | 2.50e-12 | 4.17e+00 | 0.5336 |
| 5519 | PPP2R1B | HCC2 | Human | Liver | HCC | 3.98e-20 | 4.13e+00 | 0.5341 |
| 5519 | PPP2R1B | HCC5 | Human | Liver | HCC | 2.84e-03 | 2.56e+00 | 0.4932 |
| 5519 | PPP2R1B | Pt13.b | Human | Liver | HCC | 7.28e-05 | -7.96e-02 | 0.0251 |
| 5519 | PPP2R1B | Pt14.d | Human | Liver | HCC | 2.13e-02 | -2.08e-01 | 0.0143 |
| 5519 | PPP2R1B | P2_S3_AK | Human | Skin | AK | 2.88e-05 | 1.74e-01 | -0.3287 |
| 5519 | PPP2R1B | P1_cSCC | Human | Skin | cSCC | 4.85e-03 | 2.11e-01 | 0.0292 |
| 5519 | PPP2R1B | P2_cSCC | Human | Skin | cSCC | 4.10e-02 | 1.65e-01 | -0.024 |
| 5519 | PPP2R1B | P4_cSCC | Human | Skin | cSCC | 1.94e-05 | 2.11e-01 | -0.00290000000000005 |
| 5519 | PPP2R1B | P10_cSCC | Human | Skin | cSCC | 1.32e-10 | 3.22e-01 | 0.1017 |
| Page: 1 |
| Tissue | Expression Dynamics | Abbreviation |
| Liver |  | HCC: Hepatocellular carcinoma |
| NAFLD: Non-alcoholic fatty liver disease | ||
| Skin | 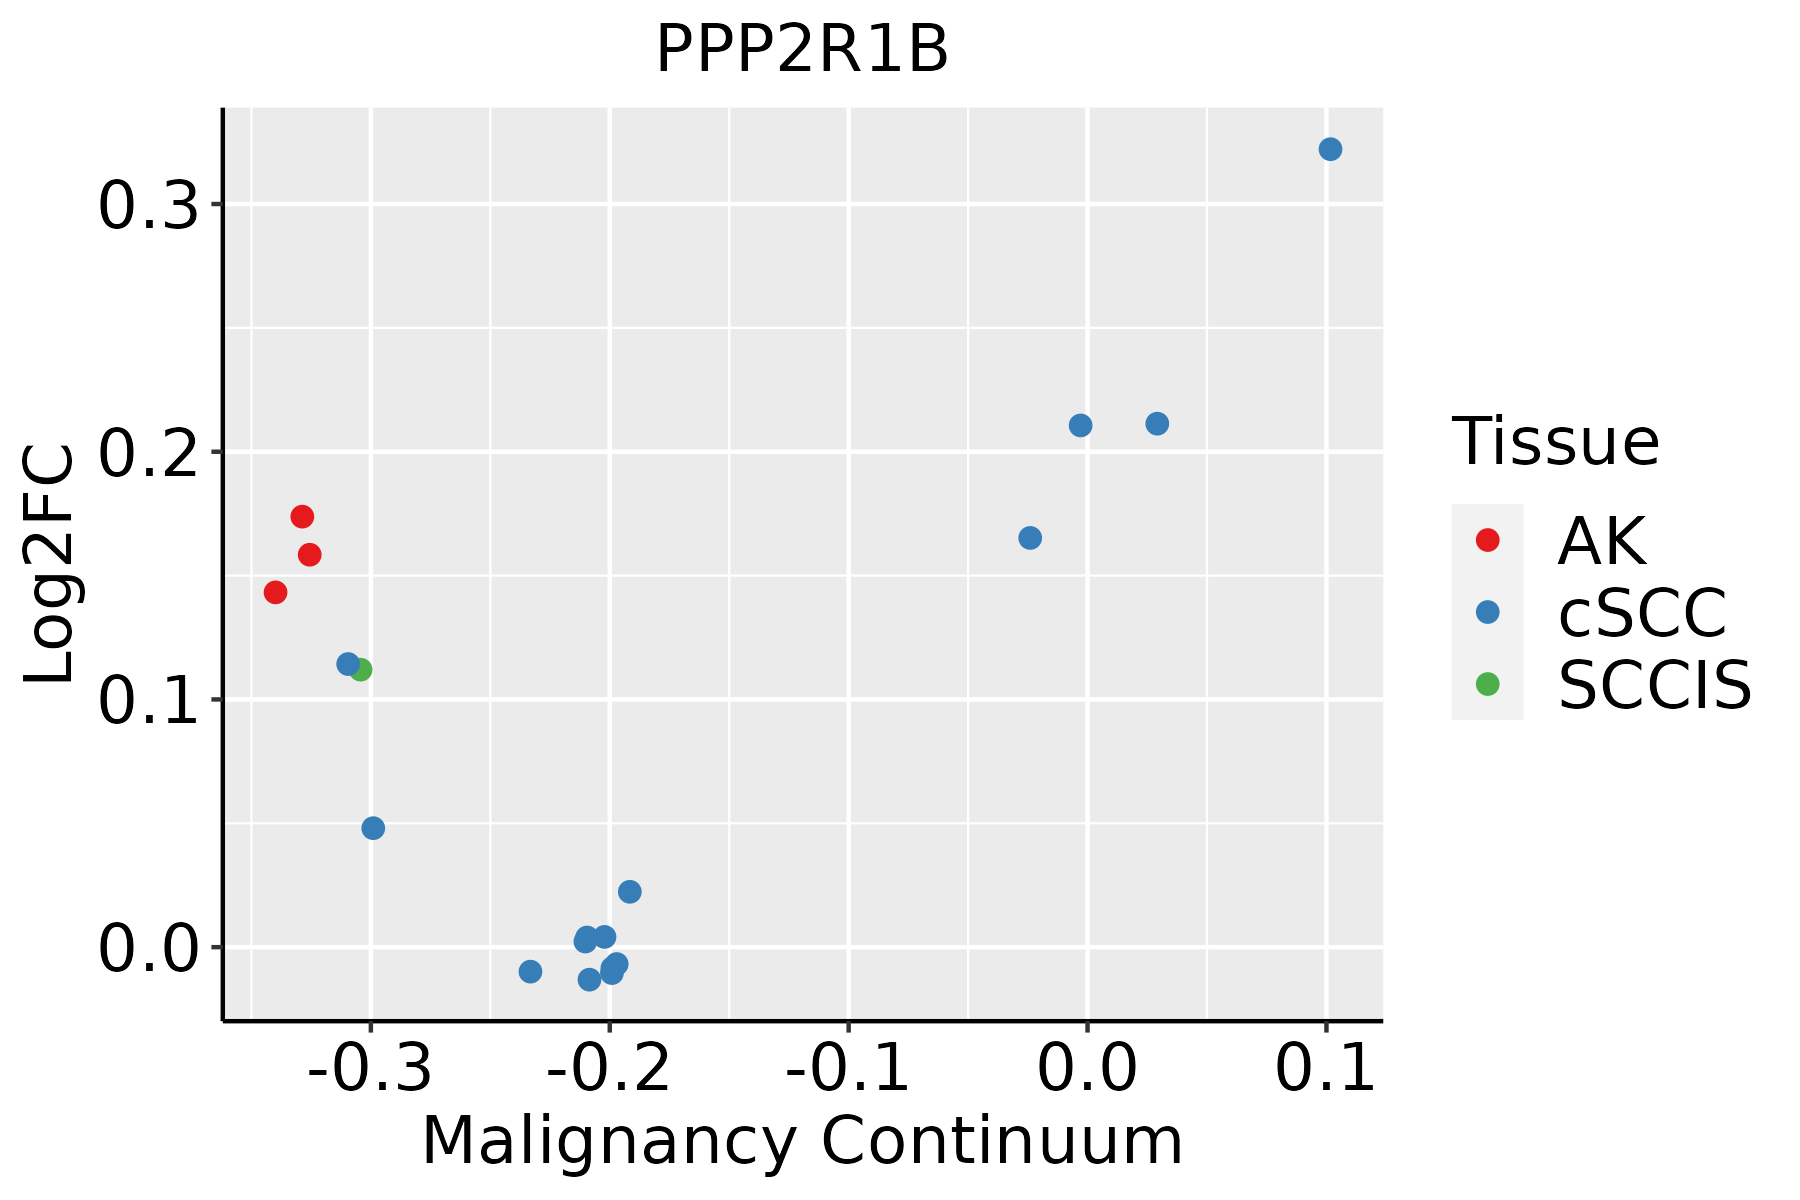 | AK: Actinic keratosis |
| cSCC: Cutaneous squamous cell carcinoma | ||
| SCCIS:squamous cell carcinoma in situ |
| ∗log2FC in expression of this searched gene in stem-like cells from each diseased tissue sample relative to stem-like cells in normal samples in each tissue plotted against the malignancy continuum. Samples are colored based on if they are from different disease stage. |
Top |
Malignant transformation related pathway analysis |
| Find out the enriched GO biological processes and KEGG pathways involved in transition from healthy to precancer to cancer |
| Tissue | Disease Stage | Enriched GO biological Processes |
| Colorectum | AD |  |
| Colorectum | SER |  |
| Colorectum | MSS |  |
| Colorectum | MSI-H |  |
| Colorectum | FAP |  |
| ∗Top 15 enriched GO BP terms are showed in the bar plot of each disease state in each tissue. Each row represents a significant GO biological process which is colored according to the -log10(p.adjust). |
| Page: 1 2 3 4 5 6 7 8 9 |
| GO ID | Tissue | Disease Stage | Description | Gene Ratio | Bg Ratio | pvalue | p.adjust | Count |
| GO:00163115 | Liver | NAFLD | dephosphorylation | 69/1882 | 417/18723 | 2.27e-05 | 6.23e-04 | 69 |
| GO:00064706 | Liver | NAFLD | protein dephosphorylation | 50/1882 | 281/18723 | 4.53e-05 | 1.09e-03 | 50 |
| GO:20012337 | Liver | NAFLD | regulation of apoptotic signaling pathway | 57/1882 | 356/18723 | 2.73e-04 | 4.41e-03 | 57 |
| GO:20012354 | Liver | NAFLD | positive regulation of apoptotic signaling pathway | 26/1882 | 126/18723 | 2.87e-04 | 4.57e-03 | 26 |
| GO:00971917 | Liver | NAFLD | extrinsic apoptotic signaling pathway | 36/1882 | 219/18723 | 2.14e-03 | 2.08e-02 | 36 |
| GO:20012367 | Liver | NAFLD | regulation of extrinsic apoptotic signaling pathway | 26/1882 | 151/18723 | 4.43e-03 | 3.59e-02 | 26 |
| GO:200123312 | Liver | Cirrhotic | regulation of apoptotic signaling pathway | 163/4634 | 356/18723 | 2.62e-18 | 4.43e-16 | 163 |
| GO:009719112 | Liver | Cirrhotic | extrinsic apoptotic signaling pathway | 97/4634 | 219/18723 | 1.82e-10 | 9.11e-09 | 97 |
| GO:200123612 | Liver | Cirrhotic | regulation of extrinsic apoptotic signaling pathway | 72/4634 | 151/18723 | 7.80e-10 | 3.62e-08 | 72 |
| GO:200123512 | Liver | Cirrhotic | positive regulation of apoptotic signaling pathway | 60/4634 | 126/18723 | 2.08e-08 | 7.47e-07 | 60 |
| GO:20012383 | Liver | Cirrhotic | positive regulation of extrinsic apoptotic signaling pathway | 27/4634 | 48/18723 | 3.07e-06 | 5.41e-05 | 27 |
| GO:000647011 | Liver | Cirrhotic | protein dephosphorylation | 96/4634 | 281/18723 | 2.32e-04 | 2.11e-03 | 96 |
| GO:001631111 | Liver | Cirrhotic | dephosphorylation | 130/4634 | 417/18723 | 1.58e-03 | 1.03e-02 | 130 |
| GO:200123322 | Liver | HCC | regulation of apoptotic signaling pathway | 226/7958 | 356/18723 | 7.26e-16 | 5.68e-14 | 226 |
| GO:009719122 | Liver | HCC | extrinsic apoptotic signaling pathway | 143/7958 | 219/18723 | 6.99e-12 | 2.97e-10 | 143 |
| GO:200123621 | Liver | HCC | regulation of extrinsic apoptotic signaling pathway | 98/7958 | 151/18723 | 2.17e-08 | 5.08e-07 | 98 |
| GO:001631121 | Liver | HCC | dephosphorylation | 230/7958 | 417/18723 | 1.00e-07 | 1.96e-06 | 230 |
| GO:000647021 | Liver | HCC | protein dephosphorylation | 162/7958 | 281/18723 | 1.91e-07 | 3.46e-06 | 162 |
| GO:200123522 | Liver | HCC | positive regulation of apoptotic signaling pathway | 79/7958 | 126/18723 | 3.70e-06 | 4.82e-05 | 79 |
| GO:200123811 | Liver | HCC | positive regulation of extrinsic apoptotic signaling pathway | 33/7958 | 48/18723 | 2.12e-04 | 1.63e-03 | 33 |
| Page: 1 2 |
| Pathway ID | Tissue | Disease Stage | Description | Gene Ratio | Bg Ratio | pvalue | p.adjust | qvalue | Count |
| hsa041528 | Liver | NAFLD | AMPK signaling pathway | 28/1043 | 121/8465 | 6.26e-04 | 9.78e-03 | 7.88e-03 | 28 |
| hsa0453014 | Liver | NAFLD | Tight junction | 33/1043 | 169/8465 | 4.52e-03 | 4.12e-02 | 3.32e-02 | 33 |
| hsa0415211 | Liver | NAFLD | AMPK signaling pathway | 28/1043 | 121/8465 | 6.26e-04 | 9.78e-03 | 7.88e-03 | 28 |
| hsa0453015 | Liver | NAFLD | Tight junction | 33/1043 | 169/8465 | 4.52e-03 | 4.12e-02 | 3.32e-02 | 33 |
| hsa0453022 | Liver | Cirrhotic | Tight junction | 82/2530 | 169/8465 | 2.14e-07 | 2.85e-06 | 1.76e-06 | 82 |
| hsa030154 | Liver | Cirrhotic | mRNA surveillance pathway | 46/2530 | 97/8465 | 1.92e-04 | 1.30e-03 | 8.03e-04 | 46 |
| hsa05165 | Liver | Cirrhotic | Human papillomavirus infection | 124/2530 | 331/8465 | 1.55e-03 | 7.83e-03 | 4.83e-03 | 124 |
| hsa051605 | Liver | Cirrhotic | Hepatitis C | 63/2530 | 157/8465 | 3.67e-03 | 1.49e-02 | 9.20e-03 | 63 |
| hsa0415221 | Liver | Cirrhotic | AMPK signaling pathway | 49/2530 | 121/8465 | 7.90e-03 | 2.74e-02 | 1.69e-02 | 49 |
| hsa041104 | Liver | Cirrhotic | Cell cycle | 61/2530 | 157/8465 | 9.53e-03 | 3.21e-02 | 1.98e-02 | 61 |
| hsa0453032 | Liver | Cirrhotic | Tight junction | 82/2530 | 169/8465 | 2.14e-07 | 2.85e-06 | 1.76e-06 | 82 |
| hsa0301511 | Liver | Cirrhotic | mRNA surveillance pathway | 46/2530 | 97/8465 | 1.92e-04 | 1.30e-03 | 8.03e-04 | 46 |
| hsa051651 | Liver | Cirrhotic | Human papillomavirus infection | 124/2530 | 331/8465 | 1.55e-03 | 7.83e-03 | 4.83e-03 | 124 |
| hsa0516012 | Liver | Cirrhotic | Hepatitis C | 63/2530 | 157/8465 | 3.67e-03 | 1.49e-02 | 9.20e-03 | 63 |
| hsa0415231 | Liver | Cirrhotic | AMPK signaling pathway | 49/2530 | 121/8465 | 7.90e-03 | 2.74e-02 | 1.69e-02 | 49 |
| hsa0411011 | Liver | Cirrhotic | Cell cycle | 61/2530 | 157/8465 | 9.53e-03 | 3.21e-02 | 1.98e-02 | 61 |
| hsa041102 | Liver | HCC | Cell cycle | 106/4020 | 157/8465 | 2.54e-07 | 3.04e-06 | 1.69e-06 | 106 |
| hsa0453042 | Liver | HCC | Tight junction | 110/4020 | 169/8465 | 2.45e-06 | 2.28e-05 | 1.27e-05 | 110 |
| hsa0301521 | Liver | HCC | mRNA surveillance pathway | 66/4020 | 97/8465 | 3.16e-05 | 1.88e-04 | 1.04e-04 | 66 |
| hsa0415241 | Liver | HCC | AMPK signaling pathway | 77/4020 | 121/8465 | 2.32e-04 | 1.11e-03 | 6.18e-04 | 77 |
| Page: 1 2 |
Top |
Cell-cell communication analysis |
| Identification of potential cell-cell interactions between two cell types and their ligand-receptor pairs for different disease states |
| Ligand | Receptor | LRpair | Pathway | Tissue | Disease Stage |
| Page: 1 |
Top |
Single-cell gene regulatory network inference analysis |
| Find out the significant the regulons (TFs) and the target genes of each regulon across cell types for different disease states |
| TF | Cell Type | Tissue | Disease Stage | Target Gene | RSS | Regulon Activity |
| ∗The dot plots of a searched regulon are shown for all cell subpopulations in each disease state of each tissue based on the regulon specific score inferred using pySCENIC and by calculating the average expression. |
| Page: 1 |
Top |
Somatic mutation of malignant transformation related genes |
| Annotation of somatic variants for genes involved in malignant transformation |
| Hugo Symbol | Variant Class | Variant Classification | dbSNP RS | HGVSc | HGVSp | HGVSp Short | SWISSPROT | BIOTYPE | SIFT | PolyPhen | Tumor Sample Barcode | Tissue | Histology | Sex | Age | Stage | Therapy Types | Drugs | Outcome |
| PPP2R1B | SNV | Missense_Mutation | novel | c.1999N>C | p.Asp667His | p.D667H | P30154 | protein_coding | deleterious_low_confidence(0) | benign(0.001) | TCGA-BH-A2L8-01 | Breast | breast invasive carcinoma | Female | <65 | I/II | Chemotherapy | cytoxan | CR |
| PPP2R1B | SNV | Missense_Mutation | novel | c.1036G>T | p.Val346Leu | p.V346L | P30154 | protein_coding | deleterious(0.01) | benign(0.012) | TCGA-E9-A1NH-01 | Breast | breast invasive carcinoma | Female | >=65 | I/II | Hormone Therapy | tamoxiphen | SD |
| PPP2R1B | deletion | Frame_Shift_Del | novel | c.1853delC | p.Pro618LeufsTer42 | p.P618Lfs*42 | P30154 | protein_coding | TCGA-EW-A2FV-01 | Breast | breast invasive carcinoma | Female | <65 | III/IV | Chemotherapy | docetaxel | SD | ||
| PPP2R1B | SNV | Missense_Mutation | novel | c.264N>A | p.Phe88Leu | p.F88L | P30154 | protein_coding | tolerated(0.17) | benign(0.013) | TCGA-2W-A8YY-01 | Cervix | cervical & endocervical cancer | Female | <65 | I/II | Chemotherapy | cisplatin | CR |
| PPP2R1B | SNV | Missense_Mutation | novel | c.94N>T | p.Leu32Phe | p.L32F | P30154 | protein_coding | deleterious(0) | probably_damaging(0.973) | TCGA-2W-A8YY-01 | Cervix | cervical & endocervical cancer | Female | <65 | I/II | Chemotherapy | cisplatin | CR |
| PPP2R1B | SNV | Missense_Mutation | c.1467G>T | p.Trp489Cys | p.W489C | P30154 | protein_coding | deleterious(0) | probably_damaging(1) | TCGA-A6-2686-01 | Colorectum | colon adenocarcinoma | Female | >=65 | I/II | Unknown | Unknown | SD | |
| PPP2R1B | SNV | Missense_Mutation | c.1370N>T | p.Ser457Phe | p.S457F | P30154 | protein_coding | deleterious(0.02) | benign(0.087) | TCGA-AA-A010-01 | Colorectum | colon adenocarcinoma | Female | <65 | I/II | Chemotherapy | folinic | CR | |
| PPP2R1B | SNV | Missense_Mutation | rs781839059 | c.809G>A | p.Arg270His | p.R270H | P30154 | protein_coding | deleterious(0.01) | probably_damaging(0.976) | TCGA-AZ-4315-01 | Colorectum | colon adenocarcinoma | Male | <65 | I/II | Unknown | Unknown | SD |
| PPP2R1B | SNV | Missense_Mutation | c.1012N>T | p.Ile338Phe | p.I338F | P30154 | protein_coding | deleterious(0.01) | benign(0.318) | TCGA-G4-6588-01 | Colorectum | colon adenocarcinoma | Female | <65 | I/II | Unknown | Unknown | SD | |
| PPP2R1B | SNV | Missense_Mutation | c.1290G>T | p.Arg430Ser | p.R430S | P30154 | protein_coding | deleterious(0) | probably_damaging(0.984) | TCGA-G4-6628-01 | Colorectum | colon adenocarcinoma | Male | >=65 | I/II | Unknown | Unknown | SD |
| Page: 1 2 3 4 5 6 7 |
Top |
Related drugs of malignant transformation related genes |
| Identification of chemicals and drugs interact with genes involved in malignant transfromation |
| (DGIdb 4.0) |
| Entrez ID | Symbol | Category | Interaction Types | Drug Claim Name | Drug Name | PMIDs |
| Page: 1 |

Copyright 2023-Present -The University of Texas Health Science Center at Houston |