
|
|||||
|
 | |
| |
| |
| |
| |
| |
|
Gene: PPP2CB |
Gene summary for PPP2CB |
| Gene information | Species | Human | Gene symbol | PPP2CB | Gene ID | 5516 |
| Gene name | protein phosphatase 2 catalytic subunit beta | |
| Gene Alias | PP2Abeta | |
| Cytomap | 8p12 | |
| Gene Type | protein-coding | GO ID | GO:0000302 | UniProtAcc | A0A140VJS0 |
Top |
Malignant transformation analysis |
| Identification of the aberrant gene expression in precancerous and cancerous lesions by comparing the gene expression of stem-like cells in diseased tissues with normal stem cells |
| Entrez ID | Symbol | Replicates | Species | Organ | Tissue | Adj P-value | Log2FC | Malignancy |
| 5516 | PPP2CB | HTA11_2487_2000001011 | Human | Colorectum | SER | 1.51e-08 | 5.11e-01 | -0.1808 |
| 5516 | PPP2CB | HTA11_1938_2000001011 | Human | Colorectum | AD | 1.01e-05 | 4.08e-01 | -0.0811 |
| 5516 | PPP2CB | HTA11_78_2000001011 | Human | Colorectum | AD | 1.21e-13 | 5.66e-01 | -0.1088 |
| 5516 | PPP2CB | HTA11_347_2000001011 | Human | Colorectum | AD | 5.05e-22 | 6.16e-01 | -0.1954 |
| 5516 | PPP2CB | HTA11_411_2000001011 | Human | Colorectum | SER | 3.36e-04 | 8.09e-01 | -0.2602 |
| 5516 | PPP2CB | HTA11_83_2000001011 | Human | Colorectum | SER | 1.83e-06 | 5.28e-01 | -0.1526 |
| 5516 | PPP2CB | HTA11_1391_2000001011 | Human | Colorectum | AD | 9.58e-06 | 3.24e-01 | -0.059 |
| 5516 | PPP2CB | A015-C-203 | Human | Colorectum | FAP | 4.11e-11 | -1.54e-01 | -0.1294 |
| 5516 | PPP2CB | A002-C-203 | Human | Colorectum | FAP | 1.20e-02 | -7.39e-02 | 0.2786 |
| 5516 | PPP2CB | A001-C-108 | Human | Colorectum | FAP | 2.08e-06 | -1.70e-01 | -0.0272 |
| 5516 | PPP2CB | A002-C-205 | Human | Colorectum | FAP | 8.46e-04 | -2.27e-01 | -0.1236 |
| 5516 | PPP2CB | A015-C-106 | Human | Colorectum | FAP | 1.14e-03 | -9.05e-02 | -0.0511 |
| 5516 | PPP2CB | A002-C-114 | Human | Colorectum | FAP | 1.34e-03 | -2.72e-01 | -0.1561 |
| 5516 | PPP2CB | A015-C-104 | Human | Colorectum | FAP | 1.33e-13 | -1.50e-01 | -0.1899 |
| 5516 | PPP2CB | A001-C-014 | Human | Colorectum | FAP | 9.58e-04 | -1.47e-01 | 0.0135 |
| 5516 | PPP2CB | A002-C-016 | Human | Colorectum | FAP | 6.73e-06 | -1.46e-01 | 0.0521 |
| 5516 | PPP2CB | A001-C-203 | Human | Colorectum | FAP | 1.22e-10 | -1.72e-01 | -0.0481 |
| 5516 | PPP2CB | A002-C-116 | Human | Colorectum | FAP | 2.71e-13 | -2.33e-01 | -0.0452 |
| 5516 | PPP2CB | F034 | Human | Colorectum | FAP | 2.33e-10 | -1.84e-01 | -0.0665 |
| 5516 | PPP2CB | CRC-1-8810 | Human | Colorectum | CRC | 5.41e-04 | -9.90e-02 | 0.6257 |
| Page: 1 2 3 4 5 |
| Tissue | Expression Dynamics | Abbreviation |
| Colorectum (GSE201348) |  | FAP: Familial adenomatous polyposis |
| CRC: Colorectal cancer | ||
| Colorectum (HTA11) |  | AD: Adenomas |
| SER: Sessile serrated lesions | ||
| MSI-H: Microsatellite-high colorectal cancer | ||
| MSS: Microsatellite stable colorectal cancer | ||
| Liver | 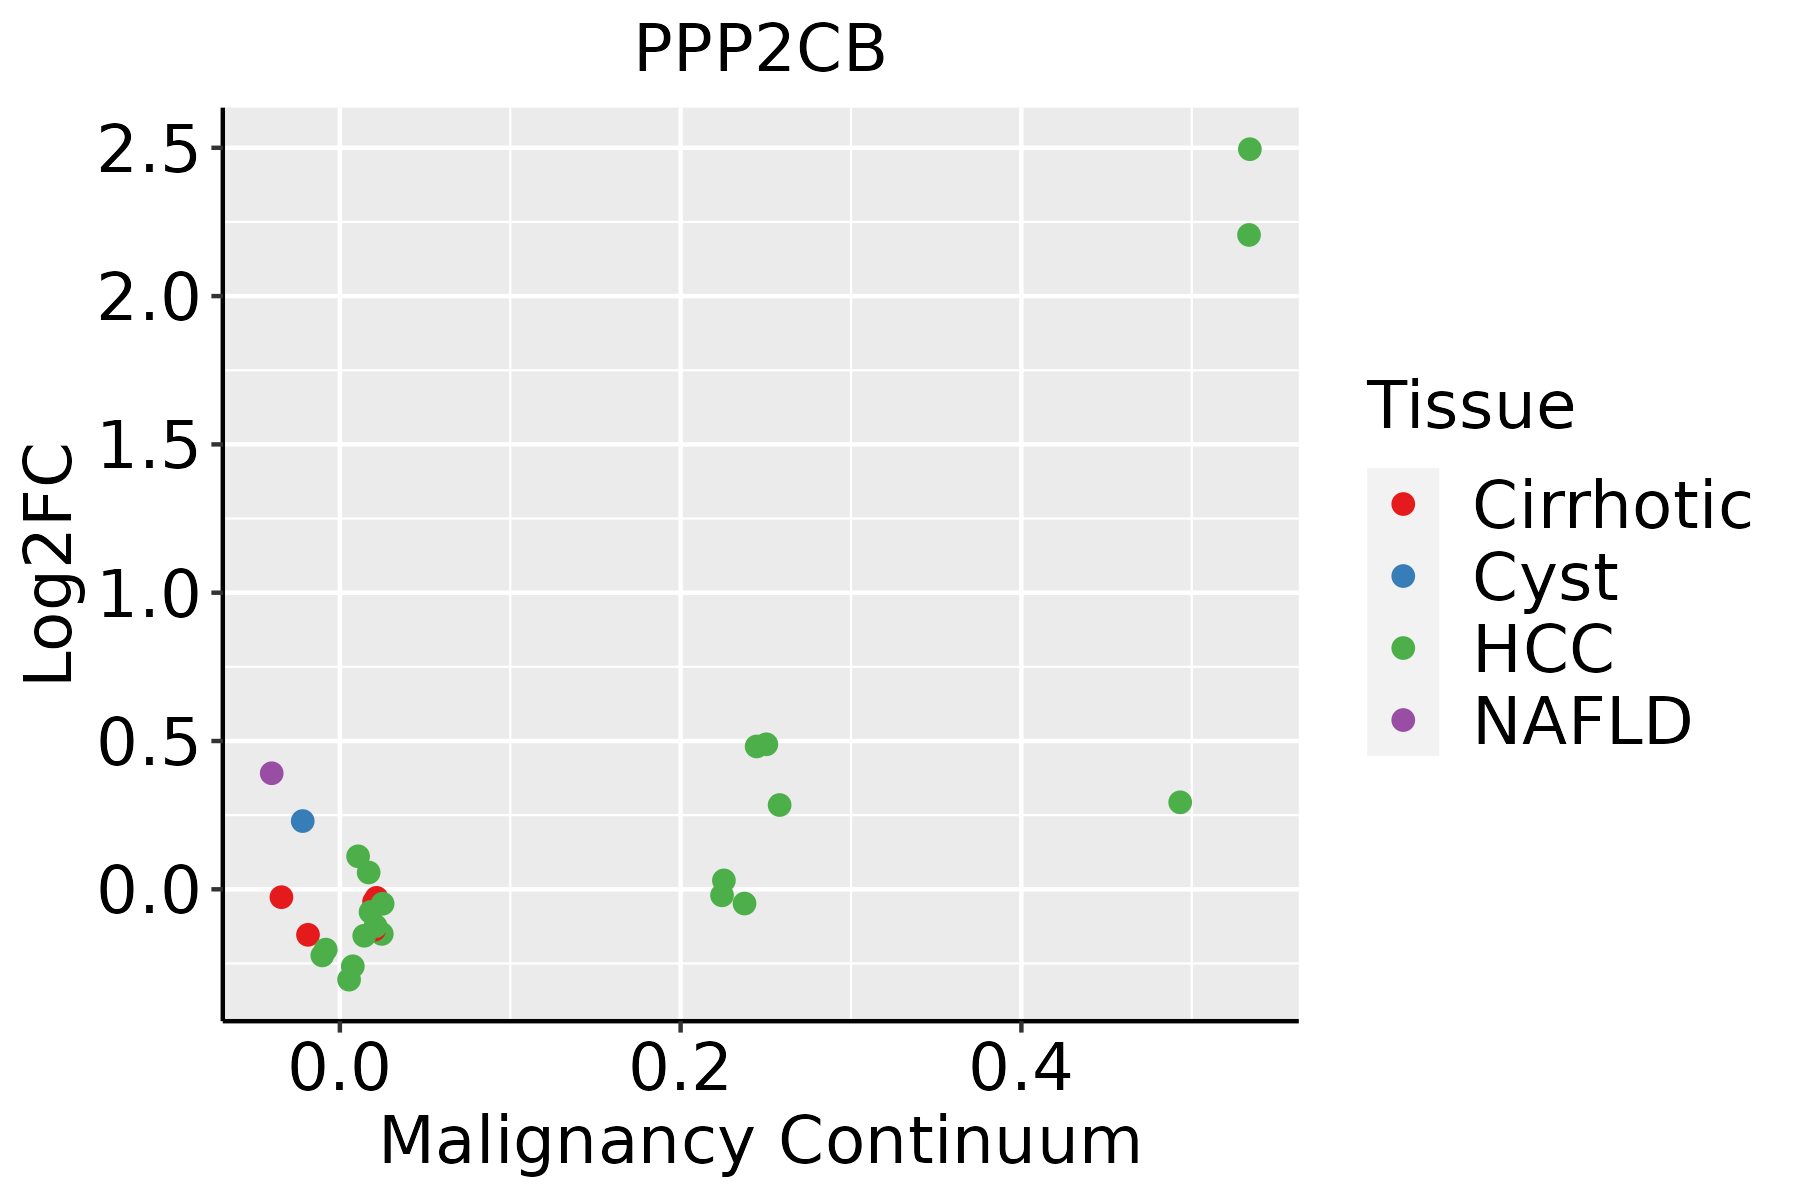 | HCC: Hepatocellular carcinoma |
| NAFLD: Non-alcoholic fatty liver disease | ||
| Oral Cavity |  | EOLP: Erosive Oral lichen planus |
| LP: leukoplakia | ||
| NEOLP: Non-erosive oral lichen planus | ||
| OSCC: Oral squamous cell carcinoma | ||
| Prostate |  | BPH: Benign Prostatic Hyperplasia |
| Skin | 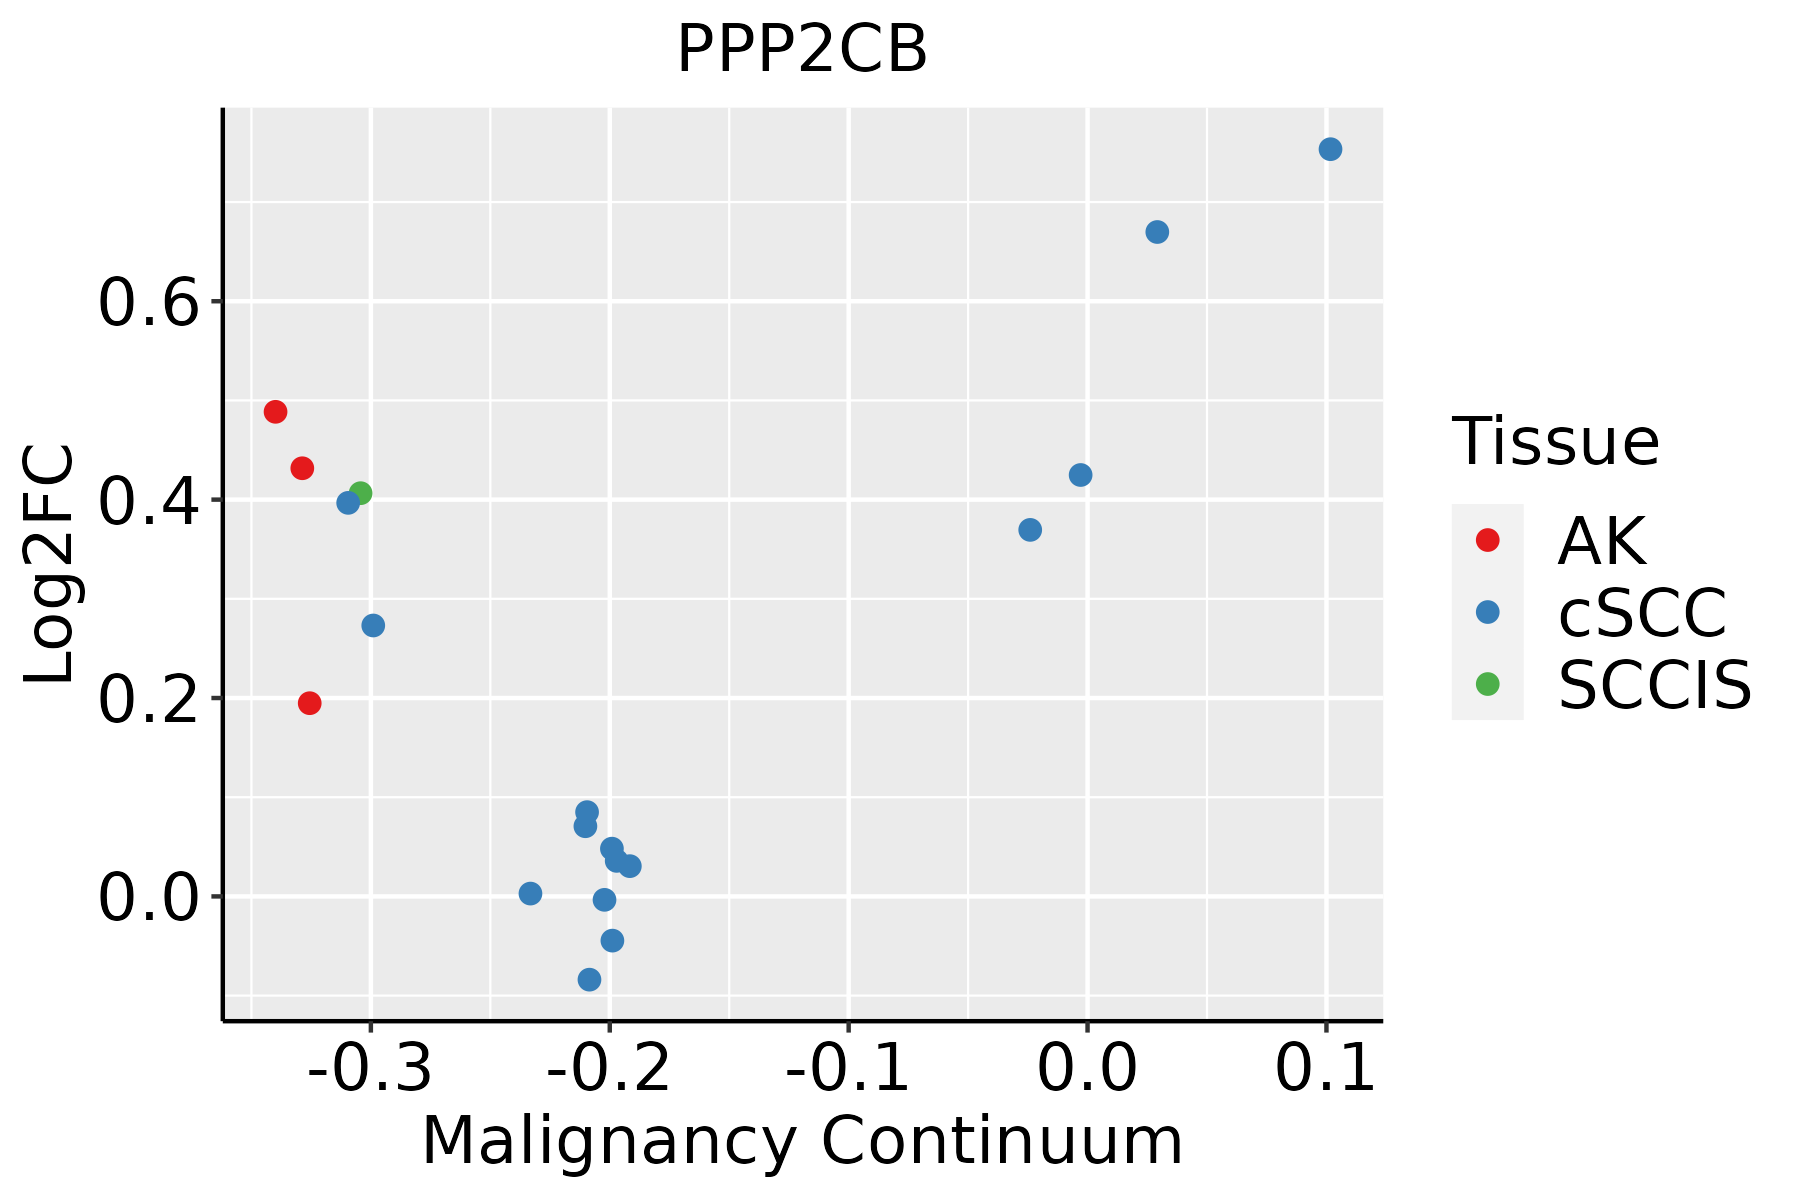 | AK: Actinic keratosis |
| cSCC: Cutaneous squamous cell carcinoma | ||
| SCCIS:squamous cell carcinoma in situ | ||
| Thyroid | 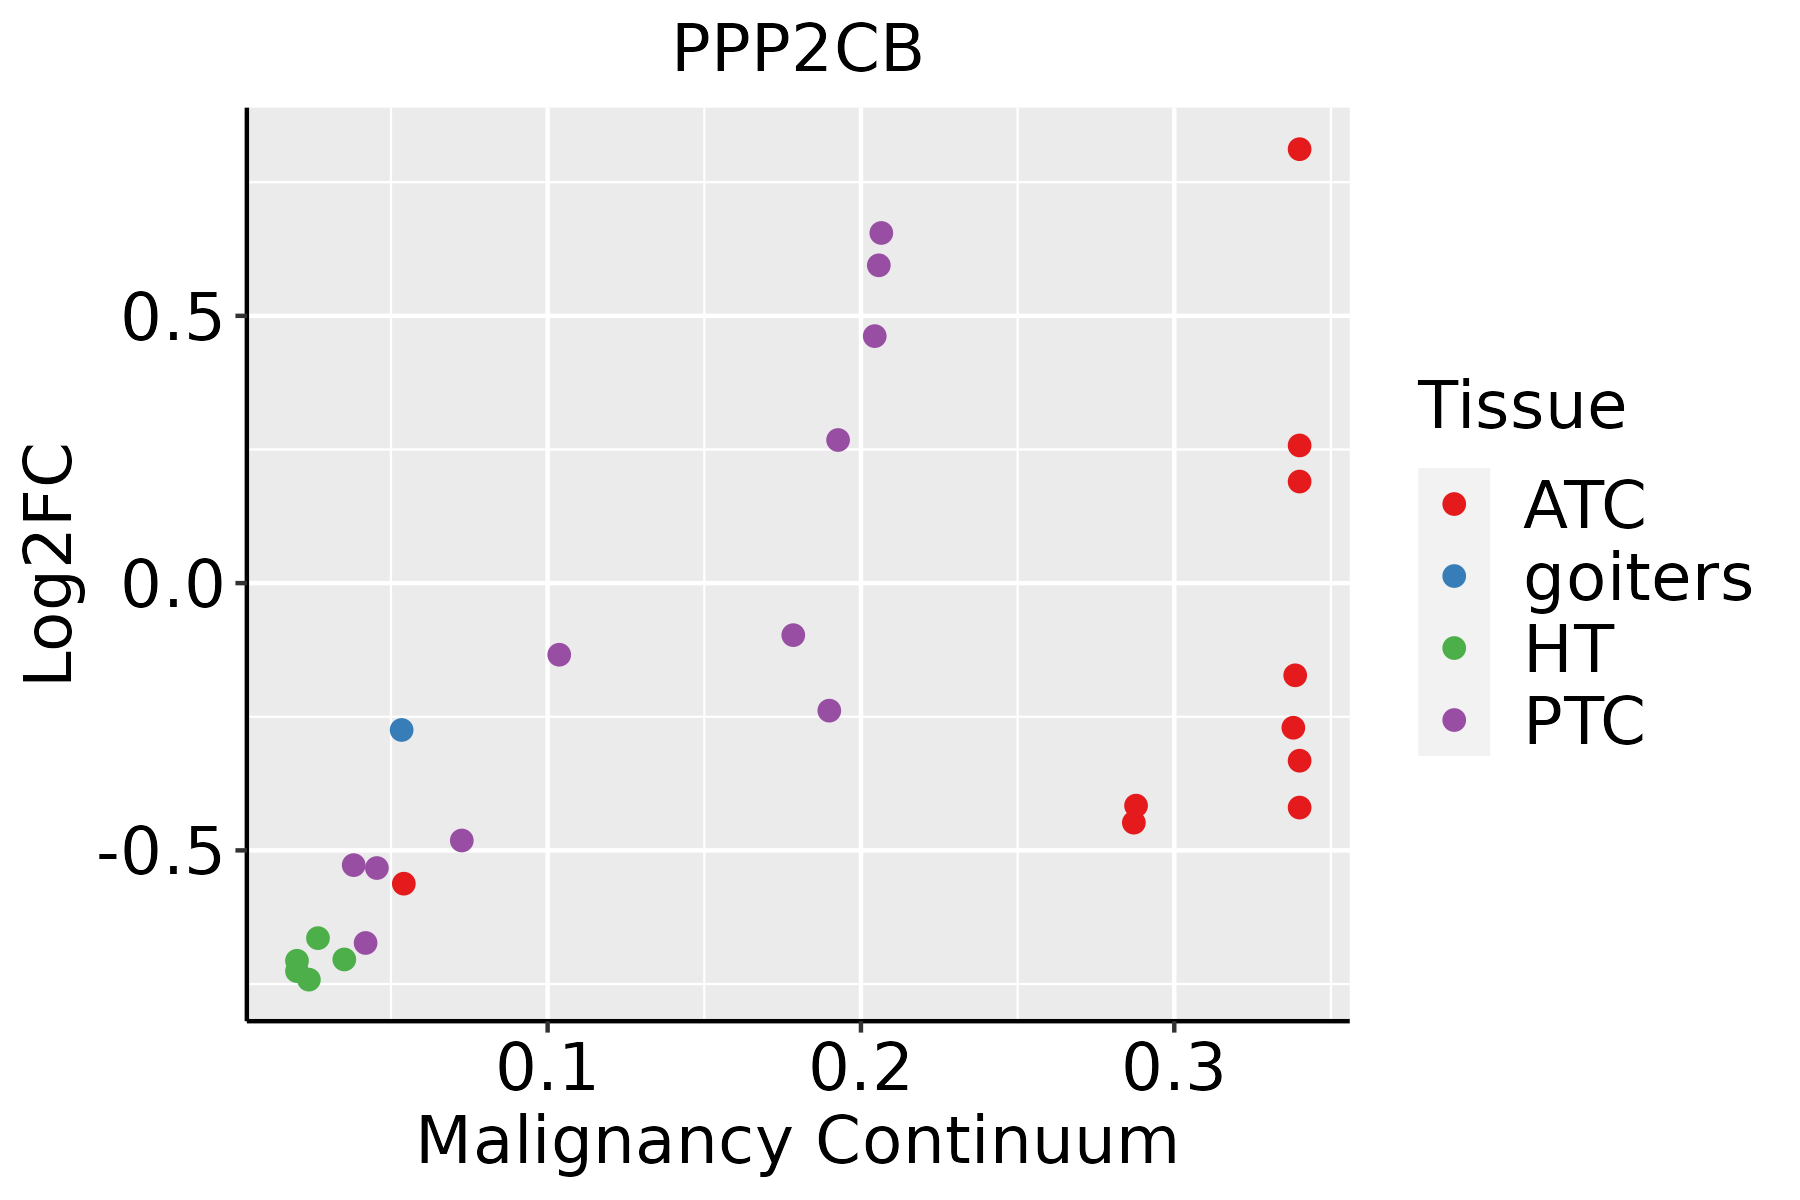 | ATC: Anaplastic thyroid cancer |
| HT: Hashimoto's thyroiditis | ||
| PTC: Papillary thyroid cancer |
| ∗log2FC in expression of this searched gene in stem-like cells from each diseased tissue sample relative to stem-like cells in normal samples in each tissue plotted against the malignancy continuum. Samples are colored based on if they are from different disease stage. |
Top |
Malignant transformation related pathway analysis |
| Find out the enriched GO biological processes and KEGG pathways involved in transition from healthy to precancer to cancer |
| Tissue | Disease Stage | Enriched GO biological Processes |
| Colorectum | AD |  |
| Colorectum | SER |  |
| Colorectum | MSS |  |
| Colorectum | MSI-H |  |
| Colorectum | FAP |  |
| ∗Top 15 enriched GO BP terms are showed in the bar plot of each disease state in each tissue. Each row represents a significant GO biological process which is colored according to the -log10(p.adjust). |
| Page: 1 2 3 4 5 6 7 8 9 |
| GO ID | Tissue | Disease Stage | Description | Gene Ratio | Bg Ratio | pvalue | p.adjust | Count |
| GO:0010498 | Colorectum | AD | proteasomal protein catabolic process | 174/3918 | 490/18723 | 3.18e-14 | 7.66e-12 | 174 |
| GO:0043161 | Colorectum | AD | proteasome-mediated ubiquitin-dependent protein catabolic process | 141/3918 | 412/18723 | 1.77e-10 | 1.68e-08 | 141 |
| GO:0051098 | Colorectum | AD | regulation of binding | 126/3918 | 363/18723 | 6.01e-10 | 4.88e-08 | 126 |
| GO:0006979 | Colorectum | AD | response to oxidative stress | 145/3918 | 446/18723 | 5.16e-09 | 3.23e-07 | 145 |
| GO:0034976 | Colorectum | AD | response to endoplasmic reticulum stress | 90/3918 | 256/18723 | 8.48e-08 | 4.28e-06 | 90 |
| GO:0051099 | Colorectum | AD | positive regulation of binding | 66/3918 | 173/18723 | 1.47e-07 | 6.64e-06 | 66 |
| GO:0000302 | Colorectum | AD | response to reactive oxygen species | 78/3918 | 222/18723 | 6.17e-07 | 2.21e-05 | 78 |
| GO:0043393 | Colorectum | AD | regulation of protein binding | 68/3918 | 196/18723 | 5.17e-06 | 1.34e-04 | 68 |
| GO:0007265 | Colorectum | AD | Ras protein signal transduction | 104/3918 | 337/18723 | 1.01e-05 | 2.35e-04 | 104 |
| GO:0008637 | Colorectum | AD | apoptotic mitochondrial changes | 42/3918 | 107/18723 | 1.13e-05 | 2.56e-04 | 42 |
| GO:0051056 | Colorectum | AD | regulation of small GTPase mediated signal transduction | 94/3918 | 302/18723 | 1.81e-05 | 3.76e-04 | 94 |
| GO:0016311 | Colorectum | AD | dephosphorylation | 123/3918 | 417/18723 | 1.84e-05 | 3.82e-04 | 123 |
| GO:0006470 | Colorectum | AD | protein dephosphorylation | 88/3918 | 281/18723 | 2.56e-05 | 4.89e-04 | 88 |
| GO:0042542 | Colorectum | AD | response to hydrogen peroxide | 52/3918 | 146/18723 | 2.83e-05 | 5.30e-04 | 52 |
| GO:0032092 | Colorectum | AD | positive regulation of protein binding | 33/3918 | 85/18723 | 1.22e-04 | 1.78e-03 | 33 |
| GO:0010038 | Colorectum | AD | response to metal ion | 106/3918 | 373/18723 | 3.22e-04 | 3.83e-03 | 106 |
| GO:0046578 | Colorectum | AD | regulation of Ras protein signal transduction | 56/3918 | 189/18723 | 2.85e-03 | 2.14e-02 | 56 |
| GO:0051058 | Colorectum | AD | negative regulation of small GTPase mediated signal transduction | 21/3918 | 56/18723 | 3.26e-03 | 2.39e-02 | 21 |
| GO:00104981 | Colorectum | SER | proteasomal protein catabolic process | 132/2897 | 490/18723 | 3.08e-11 | 5.55e-09 | 132 |
| GO:00069791 | Colorectum | SER | response to oxidative stress | 114/2897 | 446/18723 | 1.75e-08 | 1.28e-06 | 114 |
| Page: 1 2 3 4 5 6 7 8 9 10 11 12 13 14 15 16 |
| Pathway ID | Tissue | Disease Stage | Description | Gene Ratio | Bg Ratio | pvalue | p.adjust | qvalue | Count |
| hsa04530 | Colorectum | AD | Tight junction | 76/2092 | 169/8465 | 5.49e-09 | 9.69e-08 | 6.18e-08 | 76 |
| hsa04152 | Colorectum | AD | AMPK signaling pathway | 47/2092 | 121/8465 | 3.74e-04 | 2.82e-03 | 1.80e-03 | 47 |
| hsa05160 | Colorectum | AD | Hepatitis C | 54/2092 | 157/8465 | 3.87e-03 | 1.96e-02 | 1.25e-02 | 54 |
| hsa04140 | Colorectum | AD | Autophagy - animal | 49/2092 | 141/8465 | 4.58e-03 | 2.20e-02 | 1.40e-02 | 49 |
| hsa04071 | Colorectum | AD | Sphingolipid signaling pathway | 43/2092 | 121/8465 | 4.83e-03 | 2.28e-02 | 1.45e-02 | 43 |
| hsa04728 | Colorectum | AD | Dopaminergic synapse | 46/2092 | 132/8465 | 5.55e-03 | 2.48e-02 | 1.58e-02 | 46 |
| hsa03015 | Colorectum | AD | mRNA surveillance pathway | 35/2092 | 97/8465 | 7.95e-03 | 3.13e-02 | 2.00e-02 | 35 |
| hsa045301 | Colorectum | AD | Tight junction | 76/2092 | 169/8465 | 5.49e-09 | 9.69e-08 | 6.18e-08 | 76 |
| hsa041521 | Colorectum | AD | AMPK signaling pathway | 47/2092 | 121/8465 | 3.74e-04 | 2.82e-03 | 1.80e-03 | 47 |
| hsa051601 | Colorectum | AD | Hepatitis C | 54/2092 | 157/8465 | 3.87e-03 | 1.96e-02 | 1.25e-02 | 54 |
| hsa041401 | Colorectum | AD | Autophagy - animal | 49/2092 | 141/8465 | 4.58e-03 | 2.20e-02 | 1.40e-02 | 49 |
| hsa040711 | Colorectum | AD | Sphingolipid signaling pathway | 43/2092 | 121/8465 | 4.83e-03 | 2.28e-02 | 1.45e-02 | 43 |
| hsa047281 | Colorectum | AD | Dopaminergic synapse | 46/2092 | 132/8465 | 5.55e-03 | 2.48e-02 | 1.58e-02 | 46 |
| hsa030151 | Colorectum | AD | mRNA surveillance pathway | 35/2092 | 97/8465 | 7.95e-03 | 3.13e-02 | 2.00e-02 | 35 |
| hsa045302 | Colorectum | SER | Tight junction | 59/1580 | 169/8465 | 3.24e-07 | 5.98e-06 | 4.34e-06 | 59 |
| hsa047282 | Colorectum | SER | Dopaminergic synapse | 37/1580 | 132/8465 | 5.27e-03 | 3.28e-02 | 2.38e-02 | 37 |
| hsa041402 | Colorectum | SER | Autophagy - animal | 39/1580 | 141/8465 | 5.43e-03 | 3.28e-02 | 2.38e-02 | 39 |
| hsa04350 | Colorectum | SER | TGF-beta signaling pathway | 31/1580 | 108/8465 | 7.00e-03 | 3.77e-02 | 2.74e-02 | 31 |
| hsa045303 | Colorectum | SER | Tight junction | 59/1580 | 169/8465 | 3.24e-07 | 5.98e-06 | 4.34e-06 | 59 |
| hsa047283 | Colorectum | SER | Dopaminergic synapse | 37/1580 | 132/8465 | 5.27e-03 | 3.28e-02 | 2.38e-02 | 37 |
| Page: 1 2 3 4 5 6 7 8 9 10 |
Top |
Cell-cell communication analysis |
| Identification of potential cell-cell interactions between two cell types and their ligand-receptor pairs for different disease states |
| Ligand | Receptor | LRpair | Pathway | Tissue | Disease Stage |
| Page: 1 |
Top |
Single-cell gene regulatory network inference analysis |
| Find out the significant the regulons (TFs) and the target genes of each regulon across cell types for different disease states |
| TF | Cell Type | Tissue | Disease Stage | Target Gene | RSS | Regulon Activity |
| ∗The dot plots of a searched regulon are shown for all cell subpopulations in each disease state of each tissue based on the regulon specific score inferred using pySCENIC and by calculating the average expression. |
| Page: 1 |
Top |
Somatic mutation of malignant transformation related genes |
| Annotation of somatic variants for genes involved in malignant transformation |
| Hugo Symbol | Variant Class | Variant Classification | dbSNP RS | HGVSc | HGVSp | HGVSp Short | SWISSPROT | BIOTYPE | SIFT | PolyPhen | Tumor Sample Barcode | Tissue | Histology | Sex | Age | Stage | Therapy Types | Drugs | Outcome |
| PPP2CB | SNV | Missense_Mutation | novel | c.926T>G | p.Leu309Arg | p.L309R | P62714 | protein_coding | deleterious(0) | possibly_damaging(0.853) | TCGA-AC-A6IW-01 | Breast | breast invasive carcinoma | Female | >=65 | I/II | Unknown | Unknown | SD |
| PPP2CB | SNV | Missense_Mutation | c.687N>A | p.Asn229Lys | p.N229K | P62714 | protein_coding | tolerated(0.06) | possibly_damaging(0.803) | TCGA-B6-A0IJ-01 | Breast | breast invasive carcinoma | Female | <65 | I/II | Unknown | Unknown | SD | |
| PPP2CB | SNV | Missense_Mutation | c.715C>T | p.Arg239Cys | p.R239C | P62714 | protein_coding | deleterious(0) | probably_damaging(1) | TCGA-BH-A0DS-01 | Breast | breast invasive carcinoma | Female | >=65 | III/IV | Chemotherapy | cyclophosphamide | SD | |
| PPP2CB | SNV | Missense_Mutation | c.229N>T | p.Asp77Tyr | p.D77Y | P62714 | protein_coding | tolerated(0.05) | benign(0.235) | TCGA-D8-A147-01 | Breast | breast invasive carcinoma | Female | <65 | I/II | Chemotherapy | doxorubicine | SD | |
| PPP2CB | SNV | Missense_Mutation | c.803N>A | p.Arg268His | p.R268H | P62714 | protein_coding | tolerated(0.06) | possibly_damaging(0.85) | TCGA-D8-A1Y1-01 | Breast | breast invasive carcinoma | Female | >=65 | III/IV | Hormone Therapy | tamoxiphen | PD | |
| PPP2CB | insertion | Frame_Shift_Ins | novel | c.459_460insAA | p.Pro154AsnfsTer6 | p.P154Nfs*6 | P62714 | protein_coding | TCGA-BH-A0B4-01 | Breast | breast invasive carcinoma | Male | >=65 | III/IV | Hormone Therapy | tamoxiphen | SD | ||
| PPP2CB | insertion | Nonsense_Mutation | novel | c.458_459insGTAATGACAGCTGGGTACAGTGGCATGCACCTG | p.Leu153_Pro154insTer | p.L153_P154ins* | P62714 | protein_coding | TCGA-BH-A0B4-01 | Breast | breast invasive carcinoma | Male | >=65 | III/IV | Hormone Therapy | tamoxiphen | SD | ||
| PPP2CB | SNV | Missense_Mutation | c.733N>G | p.Met245Val | p.M245V | P62714 | protein_coding | deleterious(0.01) | benign(0.048) | TCGA-A6-5665-01 | Colorectum | colon adenocarcinoma | Female | >=65 | I/II | Unknown | Unknown | PD | |
| PPP2CB | SNV | Missense_Mutation | rs771311551 | c.145N>T | p.Arg49Cys | p.R49C | P62714 | protein_coding | deleterious(0.03) | benign(0.238) | TCGA-AA-3984-01 | Colorectum | colon adenocarcinoma | Female | <65 | I/II | Unknown | Unknown | SD |
| PPP2CB | SNV | Missense_Mutation | c.467N>T | p.Thr156Ile | p.T156I | P62714 | protein_coding | deleterious(0) | probably_damaging(0.955) | TCGA-AY-6197-01 | Colorectum | colon adenocarcinoma | Male | <65 | I/II | Unknown | Unknown | SD |
| Page: 1 2 3 |
Top |
Related drugs of malignant transformation related genes |
| Identification of chemicals and drugs interact with genes involved in malignant transfromation |
| (DGIdb 4.0) |
| Entrez ID | Symbol | Category | Interaction Types | Drug Claim Name | Drug Name | PMIDs |
| Page: 1 |

Copyright 2023-Present -The University of Texas Health Science Center at Houston |