
|
|||||
|
 | |
| |
| |
| |
| |
| |
|
Gene: PPP1R9B |
Gene summary for PPP1R9B |
| Gene information | Species | Human | Gene symbol | PPP1R9B | Gene ID | 84687 |
| Gene name | protein phosphatase 1 regulatory subunit 9B | |
| Gene Alias | PPP1R6 | |
| Cytomap | 17q21.33 | |
| Gene Type | protein-coding | GO ID | GO:0000003 | UniProtAcc | D3DTX6 |
Top |
Malignant transformation analysis |
| Identification of the aberrant gene expression in precancerous and cancerous lesions by comparing the gene expression of stem-like cells in diseased tissues with normal stem cells |
| Entrez ID | Symbol | Replicates | Species | Organ | Tissue | Adj P-value | Log2FC | Malignancy |
| 84687 | PPP1R9B | HCC1_Meng | Human | Liver | HCC | 2.31e-24 | 2.71e-02 | 0.0246 |
| 84687 | PPP1R9B | HCC2_Meng | Human | Liver | HCC | 4.01e-10 | 9.40e-02 | 0.0107 |
| 84687 | PPP1R9B | HCC2 | Human | Liver | HCC | 1.23e-06 | 1.26e+00 | 0.5341 |
| 84687 | PPP1R9B | S014 | Human | Liver | HCC | 4.72e-09 | 3.55e-01 | 0.2254 |
| 84687 | PPP1R9B | S015 | Human | Liver | HCC | 8.41e-13 | 5.14e-01 | 0.2375 |
| 84687 | PPP1R9B | S016 | Human | Liver | HCC | 1.43e-13 | 4.04e-01 | 0.2243 |
| 84687 | PPP1R9B | S027 | Human | Liver | HCC | 2.66e-06 | 4.72e-01 | 0.2446 |
| 84687 | PPP1R9B | S028 | Human | Liver | HCC | 3.75e-19 | 5.64e-01 | 0.2503 |
| 84687 | PPP1R9B | S029 | Human | Liver | HCC | 5.55e-15 | 5.42e-01 | 0.2581 |
| 84687 | PPP1R9B | C04 | Human | Oral cavity | OSCC | 1.27e-11 | 4.83e-01 | 0.2633 |
| 84687 | PPP1R9B | C21 | Human | Oral cavity | OSCC | 3.67e-02 | 1.57e-01 | 0.2678 |
| 84687 | PPP1R9B | C30 | Human | Oral cavity | OSCC | 3.71e-29 | 1.09e+00 | 0.3055 |
| 84687 | PPP1R9B | C38 | Human | Oral cavity | OSCC | 6.91e-04 | 5.55e-01 | 0.172 |
| 84687 | PPP1R9B | C43 | Human | Oral cavity | OSCC | 8.03e-03 | 1.28e-01 | 0.1704 |
| 84687 | PPP1R9B | C46 | Human | Oral cavity | OSCC | 6.35e-05 | 1.28e-01 | 0.1673 |
| 84687 | PPP1R9B | C51 | Human | Oral cavity | OSCC | 1.98e-10 | 4.70e-01 | 0.2674 |
| 84687 | PPP1R9B | C08 | Human | Oral cavity | OSCC | 1.55e-02 | 1.37e-01 | 0.1919 |
| 84687 | PPP1R9B | SYSMH1 | Human | Oral cavity | OSCC | 2.09e-03 | 1.64e-01 | 0.1127 |
| 84687 | PPP1R9B | SYSMH3 | Human | Oral cavity | OSCC | 1.90e-12 | 4.00e-01 | 0.2442 |
| 84687 | PPP1R9B | SYSMH5 | Human | Oral cavity | OSCC | 9.86e-03 | 1.78e-01 | 0.0647 |
| Page: 1 2 |
| Tissue | Expression Dynamics | Abbreviation |
| Liver | 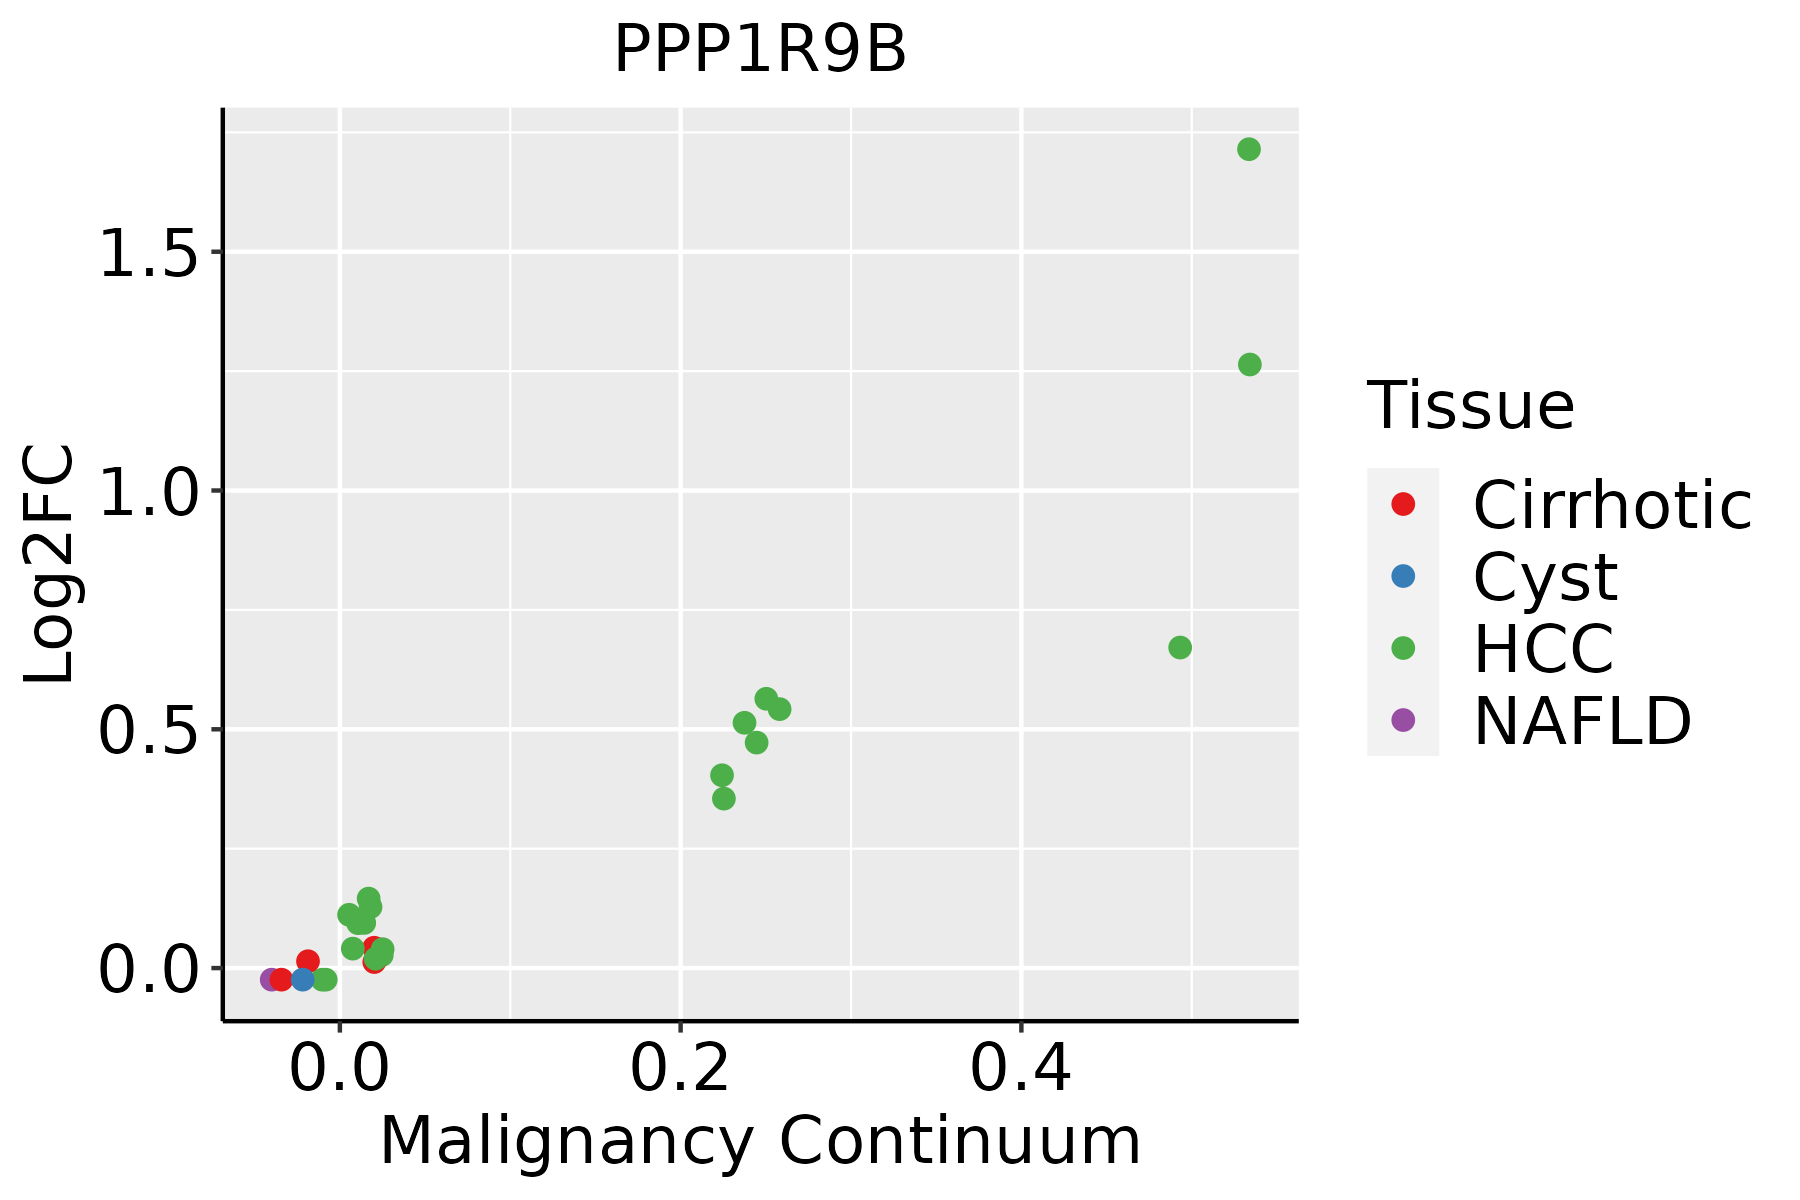 | HCC: Hepatocellular carcinoma |
| NAFLD: Non-alcoholic fatty liver disease | ||
| Oral Cavity | 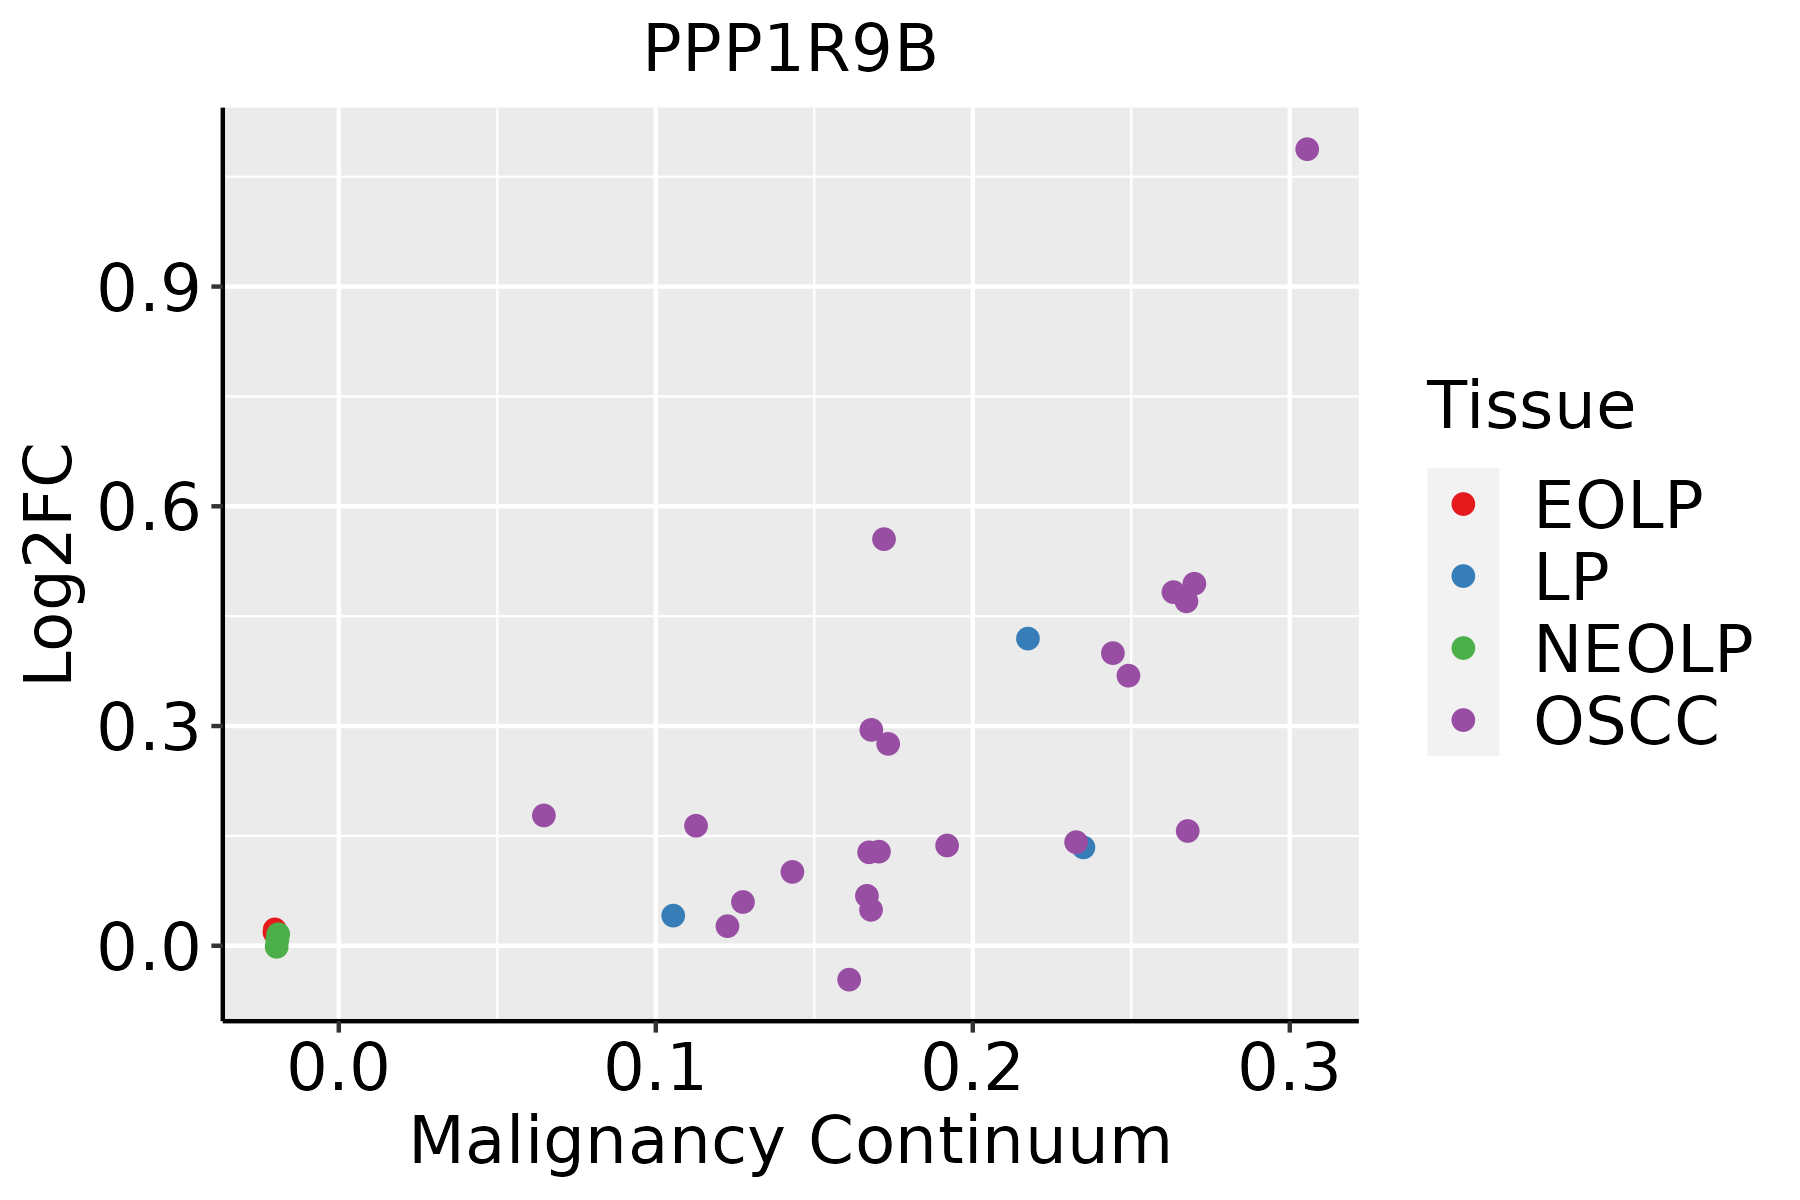 | EOLP: Erosive Oral lichen planus |
| LP: leukoplakia | ||
| NEOLP: Non-erosive oral lichen planus | ||
| OSCC: Oral squamous cell carcinoma | ||
| Thyroid |  | ATC: Anaplastic thyroid cancer |
| HT: Hashimoto's thyroiditis | ||
| PTC: Papillary thyroid cancer |
| ∗log2FC in expression of this searched gene in stem-like cells from each diseased tissue sample relative to stem-like cells in normal samples in each tissue plotted against the malignancy continuum. Samples are colored based on if they are from different disease stage. |
Top |
Malignant transformation related pathway analysis |
| Find out the enriched GO biological processes and KEGG pathways involved in transition from healthy to precancer to cancer |
| Tissue | Disease Stage | Enriched GO biological Processes |
| Colorectum | AD |  |
| Colorectum | SER |  |
| Colorectum | MSS |  |
| Colorectum | MSI-H |  |
| Colorectum | FAP |  |
| ∗Top 15 enriched GO BP terms are showed in the bar plot of each disease state in each tissue. Each row represents a significant GO biological process which is colored according to the -log10(p.adjust). |
| Page: 1 2 3 4 5 6 7 8 9 |
| GO ID | Tissue | Disease Stage | Description | Gene Ratio | Bg Ratio | pvalue | p.adjust | Count |
| GO:000838022 | Liver | HCC | RNA splicing | 313/7958 | 434/18723 | 1.36e-36 | 1.73e-33 | 313 |
| GO:190382922 | Liver | HCC | positive regulation of cellular protein localization | 199/7958 | 276/18723 | 1.15e-23 | 2.62e-21 | 199 |
| GO:002241112 | Liver | HCC | cellular component disassembly | 282/7958 | 443/18723 | 1.02e-19 | 1.38e-17 | 282 |
| GO:001056322 | Liver | HCC | negative regulation of phosphorus metabolic process | 259/7958 | 442/18723 | 4.29e-12 | 1.92e-10 | 259 |
| GO:004593622 | Liver | HCC | negative regulation of phosphate metabolic process | 258/7958 | 441/18723 | 6.00e-12 | 2.60e-10 | 258 |
| GO:004854522 | Liver | HCC | response to steroid hormone | 206/7958 | 339/18723 | 6.81e-12 | 2.92e-10 | 206 |
| GO:007265921 | Liver | HCC | protein localization to plasma membrane | 177/7958 | 284/18723 | 1.02e-11 | 4.18e-10 | 177 |
| GO:199077821 | Liver | HCC | protein localization to cell periphery | 200/7958 | 333/18723 | 6.07e-11 | 2.23e-09 | 200 |
| GO:190165321 | Liver | HCC | cellular response to peptide | 211/7958 | 359/18723 | 2.86e-10 | 9.63e-09 | 211 |
| GO:007149622 | Liver | HCC | cellular response to external stimulus | 191/7958 | 320/18723 | 3.40e-10 | 1.13e-08 | 191 |
| GO:014001411 | Liver | HCC | mitotic nuclear division | 174/7958 | 287/18723 | 3.74e-10 | 1.23e-08 | 174 |
| GO:000701522 | Liver | HCC | actin filament organization | 252/7958 | 442/18723 | 3.83e-10 | 1.25e-08 | 252 |
| GO:001604921 | Liver | HCC | cell growth | 269/7958 | 482/18723 | 1.84e-09 | 5.35e-08 | 269 |
| GO:00447722 | Liver | HCC | mitotic cell cycle phase transition | 240/7958 | 424/18723 | 2.47e-09 | 6.84e-08 | 240 |
| GO:190547511 | Liver | HCC | regulation of protein localization to membrane | 113/7958 | 175/18723 | 2.90e-09 | 7.78e-08 | 113 |
| GO:000734611 | Liver | HCC | regulation of mitotic cell cycle | 255/7958 | 457/18723 | 4.96e-09 | 1.30e-07 | 255 |
| GO:003298411 | Liver | HCC | protein-containing complex disassembly | 138/7958 | 224/18723 | 5.59e-09 | 1.46e-07 | 138 |
| GO:003166812 | Liver | HCC | cellular response to extracellular stimulus | 149/7958 | 246/18723 | 7.35e-09 | 1.86e-07 | 149 |
| GO:190437521 | Liver | HCC | regulation of protein localization to cell periphery | 83/7958 | 125/18723 | 5.60e-08 | 1.19e-06 | 83 |
| GO:190165422 | Liver | HCC | response to ketone | 119/7958 | 194/18723 | 8.65e-08 | 1.72e-06 | 119 |
| Page: 1 2 3 4 5 6 7 8 9 10 11 12 |
| Pathway ID | Tissue | Disease Stage | Description | Gene Ratio | Bg Ratio | pvalue | p.adjust | qvalue | Count |
| Page: 1 |
Top |
Cell-cell communication analysis |
| Identification of potential cell-cell interactions between two cell types and their ligand-receptor pairs for different disease states |
| Ligand | Receptor | LRpair | Pathway | Tissue | Disease Stage |
| Page: 1 |
Top |
Single-cell gene regulatory network inference analysis |
| Find out the significant the regulons (TFs) and the target genes of each regulon across cell types for different disease states |
| TF | Cell Type | Tissue | Disease Stage | Target Gene | RSS | Regulon Activity |
| ∗The dot plots of a searched regulon are shown for all cell subpopulations in each disease state of each tissue based on the regulon specific score inferred using pySCENIC and by calculating the average expression. |
| Page: 1 |
Top |
Somatic mutation of malignant transformation related genes |
| Annotation of somatic variants for genes involved in malignant transformation |
| Hugo Symbol | Variant Class | Variant Classification | dbSNP RS | HGVSc | HGVSp | HGVSp Short | SWISSPROT | BIOTYPE | SIFT | PolyPhen | Tumor Sample Barcode | Tissue | Histology | Sex | Age | Stage | Therapy Types | Drugs | Outcome |
| PPP1R9B | SNV | Missense_Mutation | novel | c.1697N>T | p.Ala566Val | p.A566V | protein_coding | deleterious(0.04) | probably_damaging(0.998) | TCGA-AO-A128-01 | Breast | breast invasive carcinoma | Female | <65 | I/II | Chemotherapy | doxorubicin | SD | |
| PPP1R9B | deletion | Frame_Shift_Del | novel | c.1136delT | p.Val379GlufsTer17 | p.V379Efs*17 | protein_coding | TCGA-EW-A2FV-01 | Breast | breast invasive carcinoma | Female | <65 | III/IV | Chemotherapy | docetaxel | SD | |||
| PPP1R9B | SNV | Missense_Mutation | novel | c.144G>C | p.Lys48Asn | p.K48N | protein_coding | deleterious(0) | benign(0.362) | TCGA-EK-A3GK-01 | Cervix | cervical & endocervical cancer | Female | <65 | I/II | Unknown | Unknown | SD | |
| PPP1R9B | SNV | Missense_Mutation | novel | c.1526N>A | p.Ser509Asn | p.S509N | protein_coding | deleterious(0) | possibly_damaging(0.726) | TCGA-GH-A9DA-01 | Cervix | cervical & endocervical cancer | Female | <65 | I/II | Unknown | Unknown | SD | |
| PPP1R9B | SNV | Missense_Mutation | novel | c.1439C>G | p.Ser480Cys | p.S480C | protein_coding | deleterious(0) | probably_damaging(0.997) | TCGA-IR-A3LK-01 | Cervix | cervical & endocervical cancer | Female | >=65 | I/II | Chemotherapy | cisplatin | PD | |
| PPP1R9B | SNV | Missense_Mutation | novel | c.1552N>C | p.Asp518His | p.D518H | protein_coding | deleterious(0) | probably_damaging(0.955) | TCGA-Q1-A73O-01 | Cervix | cervical & endocervical cancer | Female | <65 | I/II | Chemotherapy | cisplatin | CR | |
| PPP1R9B | SNV | Missense_Mutation | novel | c.1282N>C | p.Glu428Gln | p.E428Q | protein_coding | deleterious(0.03) | possibly_damaging(0.543) | TCGA-VS-A9UI-01 | Cervix | cervical & endocervical cancer | Female | >=65 | I/II | Unknown | Unknown | SD | |
| PPP1R9B | insertion | Frame_Shift_Ins | novel | c.1096_1097insG | p.Val366GlyfsTer12 | p.V366Gfs*12 | protein_coding | TCGA-VS-A94Z-01 | Cervix | cervical & endocervical cancer | Female | <65 | I/II | Chemotherapy | cisplatin | CR | |||
| PPP1R9B | SNV | Missense_Mutation | novel | c.2221N>A | p.Leu741Met | p.L741M | protein_coding | deleterious(0) | probably_damaging(0.999) | TCGA-AA-3950-01 | Colorectum | colon adenocarcinoma | Female | >=65 | I/II | Unknown | Unknown | SD | |
| PPP1R9B | SNV | Missense_Mutation | novel | c.1930G>T | p.Ala644Ser | p.A644S | protein_coding | tolerated(0.34) | benign(0.057) | TCGA-CK-4951-01 | Colorectum | colon adenocarcinoma | Female | >=65 | I/II | Unknown | Unknown | PD |
| Page: 1 2 3 |
Top |
Related drugs of malignant transformation related genes |
| Identification of chemicals and drugs interact with genes involved in malignant transfromation |
| (DGIdb 4.0) |
| Entrez ID | Symbol | Category | Interaction Types | Drug Claim Name | Drug Name | PMIDs |
| Page: 1 |

Copyright 2023-Present -The University of Texas Health Science Center at Houston |