
|
|||||
|
 | |
| |
| |
| |
| |
| |
|
Gene: PPP1R8 |
Gene summary for PPP1R8 |
| Gene information | Species | Human | Gene symbol | PPP1R8 | Gene ID | 5511 |
| Gene name | protein phosphatase 1 regulatory subunit 8 | |
| Gene Alias | ARD-1 | |
| Cytomap | 1p35.3 | |
| Gene Type | protein-coding | GO ID | GO:0006139 | UniProtAcc | Q12972 |
Top |
Malignant transformation analysis |
| Identification of the aberrant gene expression in precancerous and cancerous lesions by comparing the gene expression of stem-like cells in diseased tissues with normal stem cells |
| Entrez ID | Symbol | Replicates | Species | Organ | Tissue | Adj P-value | Log2FC | Malignancy |
| 5511 | PPP1R8 | LZE7T | Human | Esophagus | ESCC | 2.40e-09 | 2.32e-01 | 0.0667 |
| 5511 | PPP1R8 | LZE20T | Human | Esophagus | ESCC | 1.87e-05 | 1.37e-01 | 0.0662 |
| 5511 | PPP1R8 | LZE22T | Human | Esophagus | ESCC | 2.14e-02 | 1.20e-01 | 0.068 |
| 5511 | PPP1R8 | LZE24T | Human | Esophagus | ESCC | 2.90e-11 | 1.43e-01 | 0.0596 |
| 5511 | PPP1R8 | P1T-E | Human | Esophagus | ESCC | 4.96e-05 | 1.57e-01 | 0.0875 |
| 5511 | PPP1R8 | P2T-E | Human | Esophagus | ESCC | 4.42e-17 | 2.16e-01 | 0.1177 |
| 5511 | PPP1R8 | P4T-E | Human | Esophagus | ESCC | 3.78e-16 | 2.78e-01 | 0.1323 |
| 5511 | PPP1R8 | P5T-E | Human | Esophagus | ESCC | 7.68e-11 | 1.88e-01 | 0.1327 |
| 5511 | PPP1R8 | P8T-E | Human | Esophagus | ESCC | 3.34e-17 | 1.97e-01 | 0.0889 |
| 5511 | PPP1R8 | P9T-E | Human | Esophagus | ESCC | 9.38e-10 | 1.50e-01 | 0.1131 |
| 5511 | PPP1R8 | P10T-E | Human | Esophagus | ESCC | 2.32e-35 | 6.14e-01 | 0.116 |
| 5511 | PPP1R8 | P11T-E | Human | Esophagus | ESCC | 1.57e-02 | 7.48e-02 | 0.1426 |
| 5511 | PPP1R8 | P12T-E | Human | Esophagus | ESCC | 1.34e-09 | 1.39e-01 | 0.1122 |
| 5511 | PPP1R8 | P15T-E | Human | Esophagus | ESCC | 7.22e-14 | 2.48e-01 | 0.1149 |
| 5511 | PPP1R8 | P16T-E | Human | Esophagus | ESCC | 6.70e-13 | 1.10e-01 | 0.1153 |
| 5511 | PPP1R8 | P17T-E | Human | Esophagus | ESCC | 2.15e-04 | 1.51e-01 | 0.1278 |
| 5511 | PPP1R8 | P20T-E | Human | Esophagus | ESCC | 5.42e-16 | 1.94e-01 | 0.1124 |
| 5511 | PPP1R8 | P21T-E | Human | Esophagus | ESCC | 8.41e-19 | 3.16e-01 | 0.1617 |
| 5511 | PPP1R8 | P22T-E | Human | Esophagus | ESCC | 2.11e-10 | 9.51e-02 | 0.1236 |
| 5511 | PPP1R8 | P23T-E | Human | Esophagus | ESCC | 1.17e-08 | 1.74e-01 | 0.108 |
| Page: 1 2 3 4 |
| Tissue | Expression Dynamics | Abbreviation |
| Esophagus | 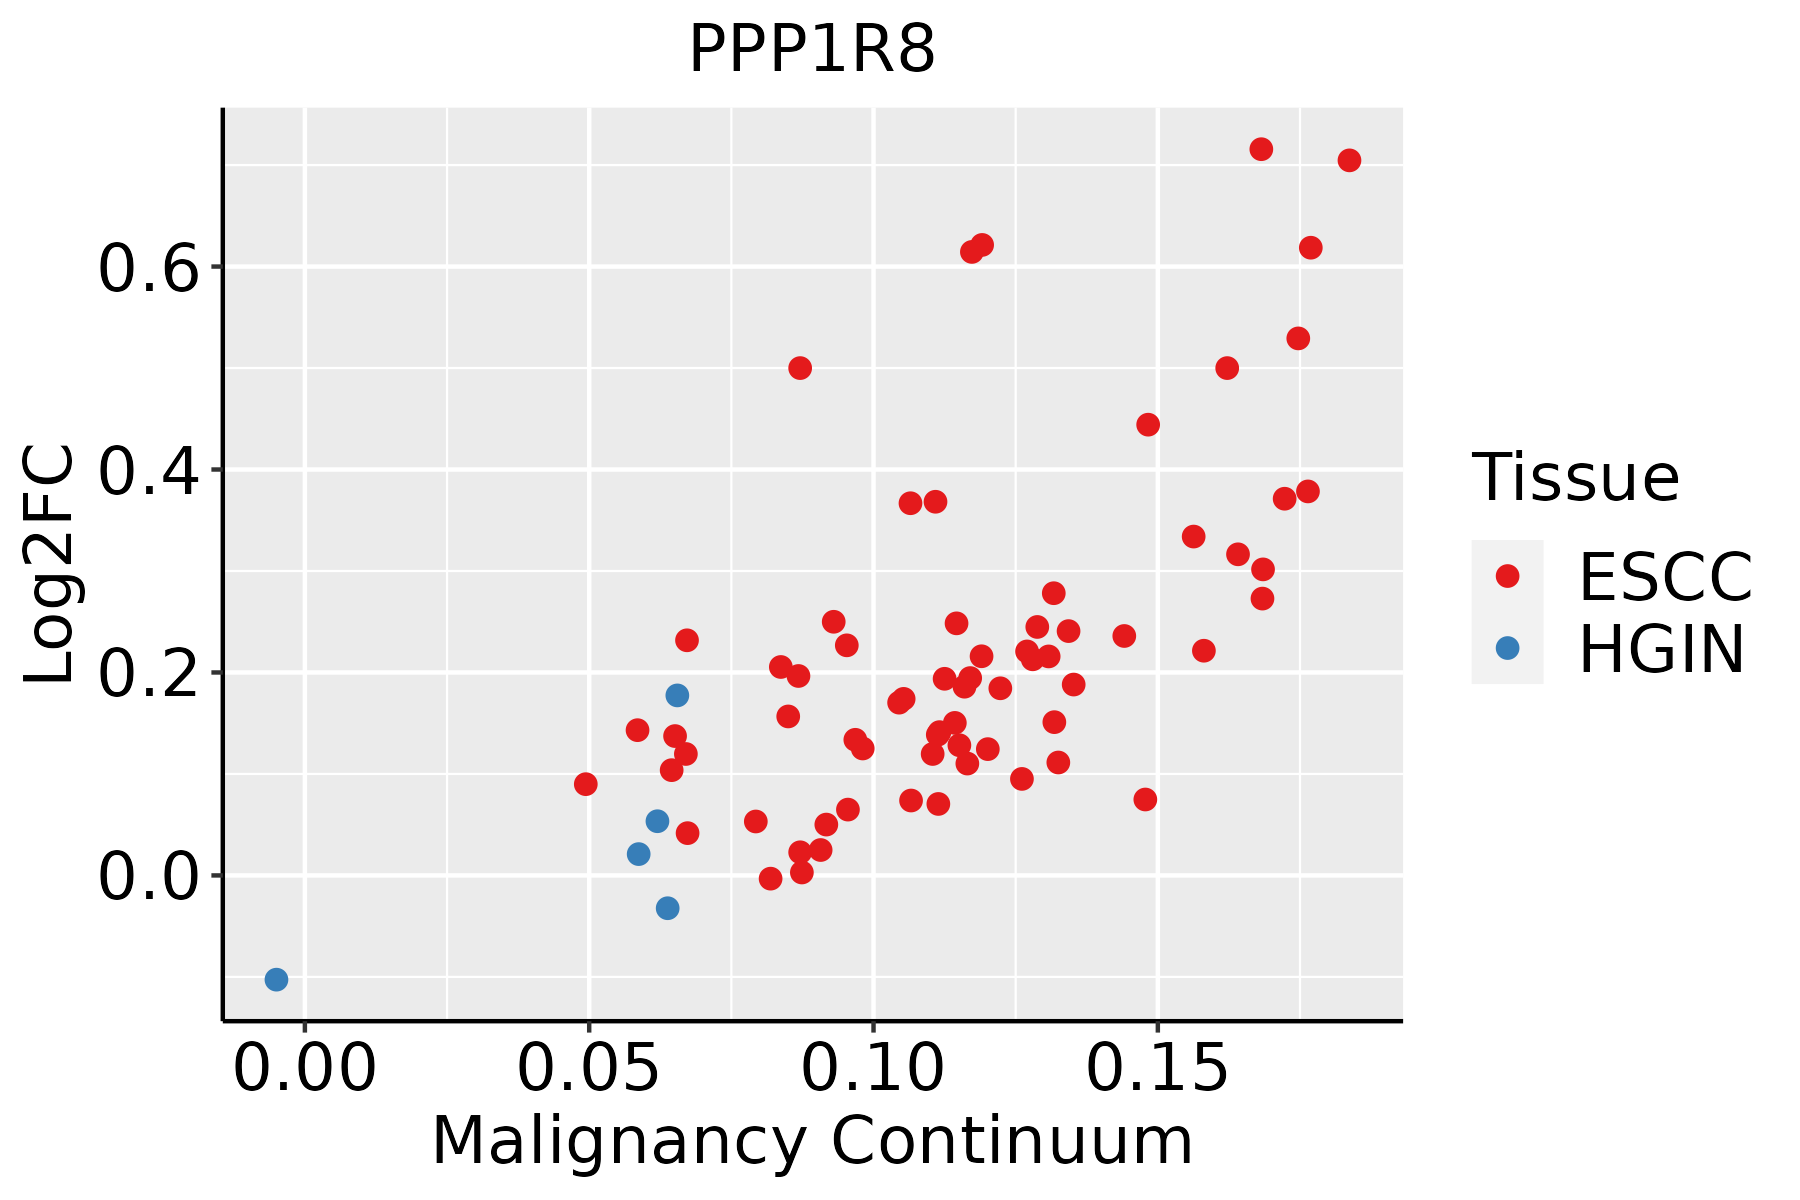 | ESCC: Esophageal squamous cell carcinoma |
| HGIN: High-grade intraepithelial neoplasias | ||
| LGIN: Low-grade intraepithelial neoplasias | ||
| Oral Cavity | 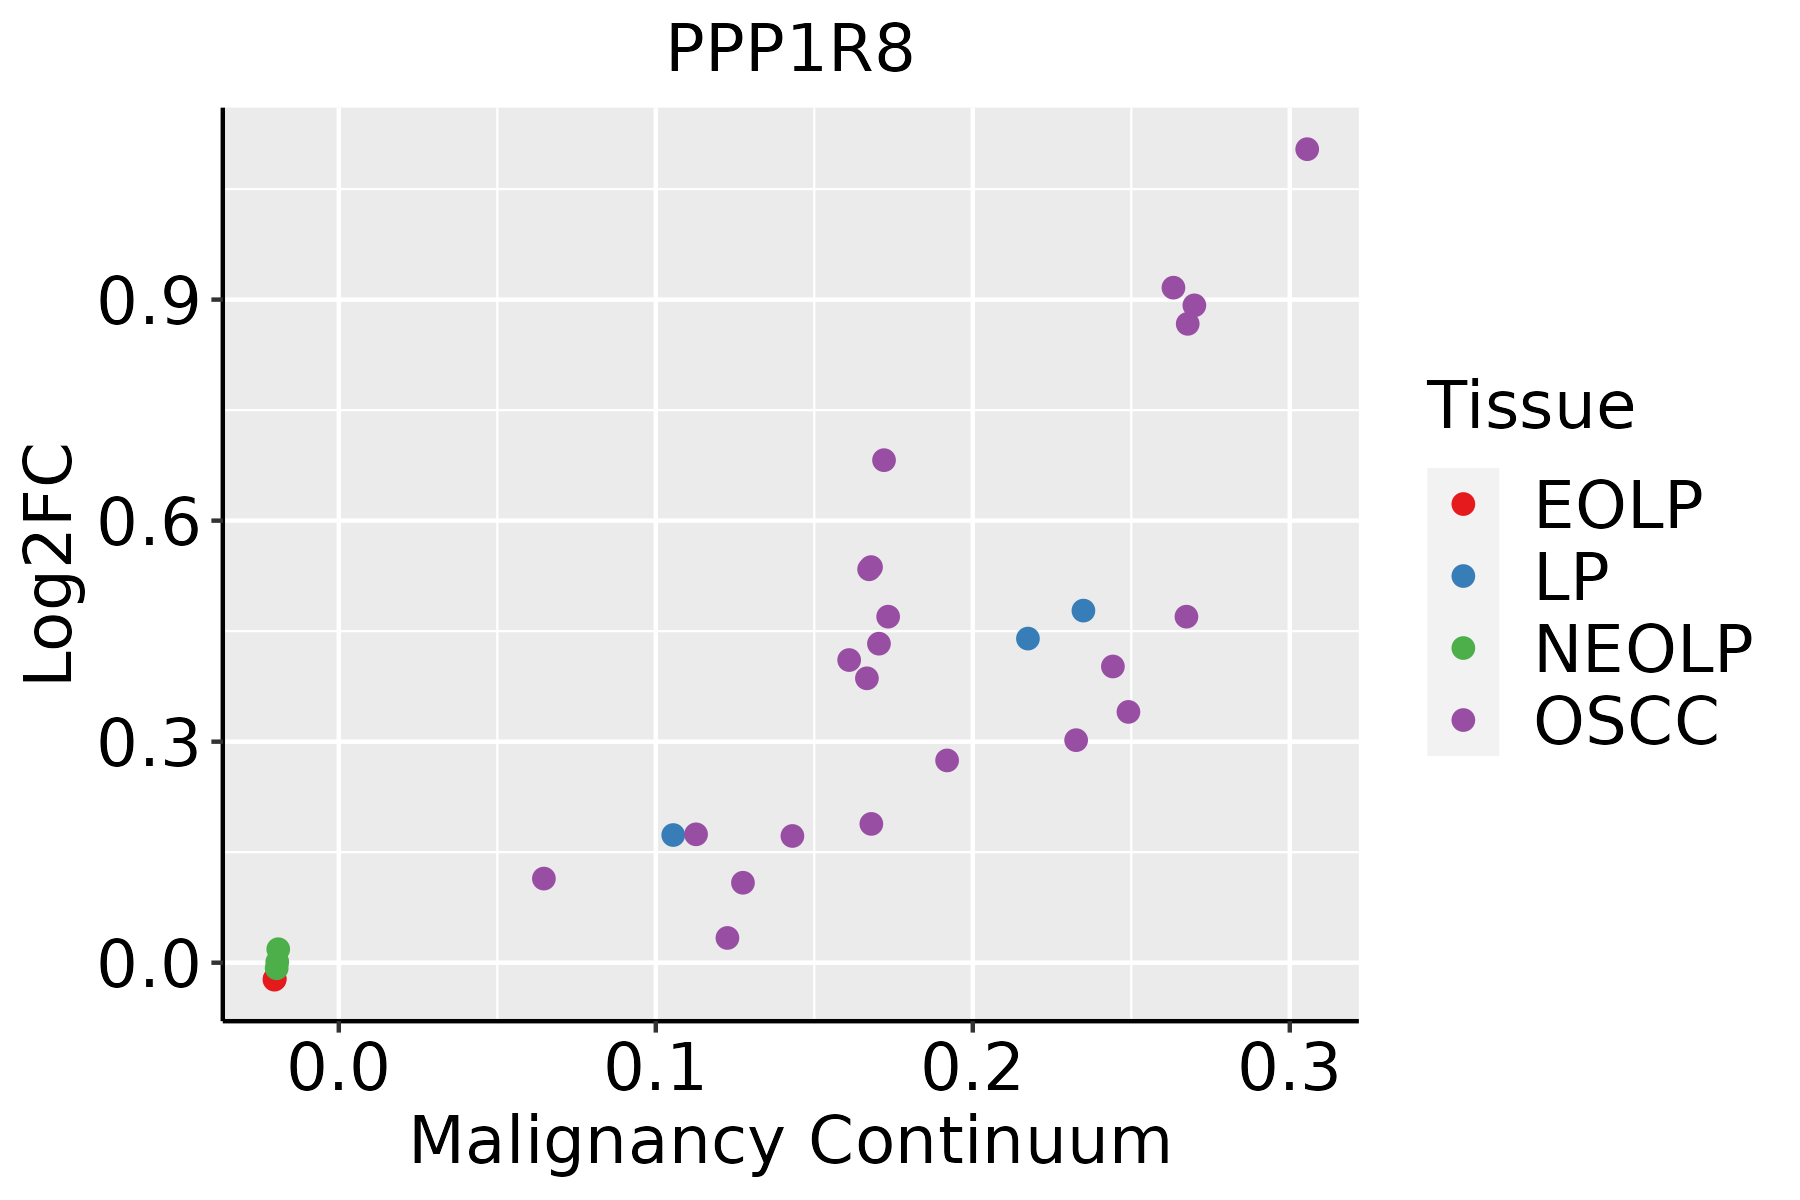 | EOLP: Erosive Oral lichen planus |
| LP: leukoplakia | ||
| NEOLP: Non-erosive oral lichen planus | ||
| OSCC: Oral squamous cell carcinoma | ||
| Skin | 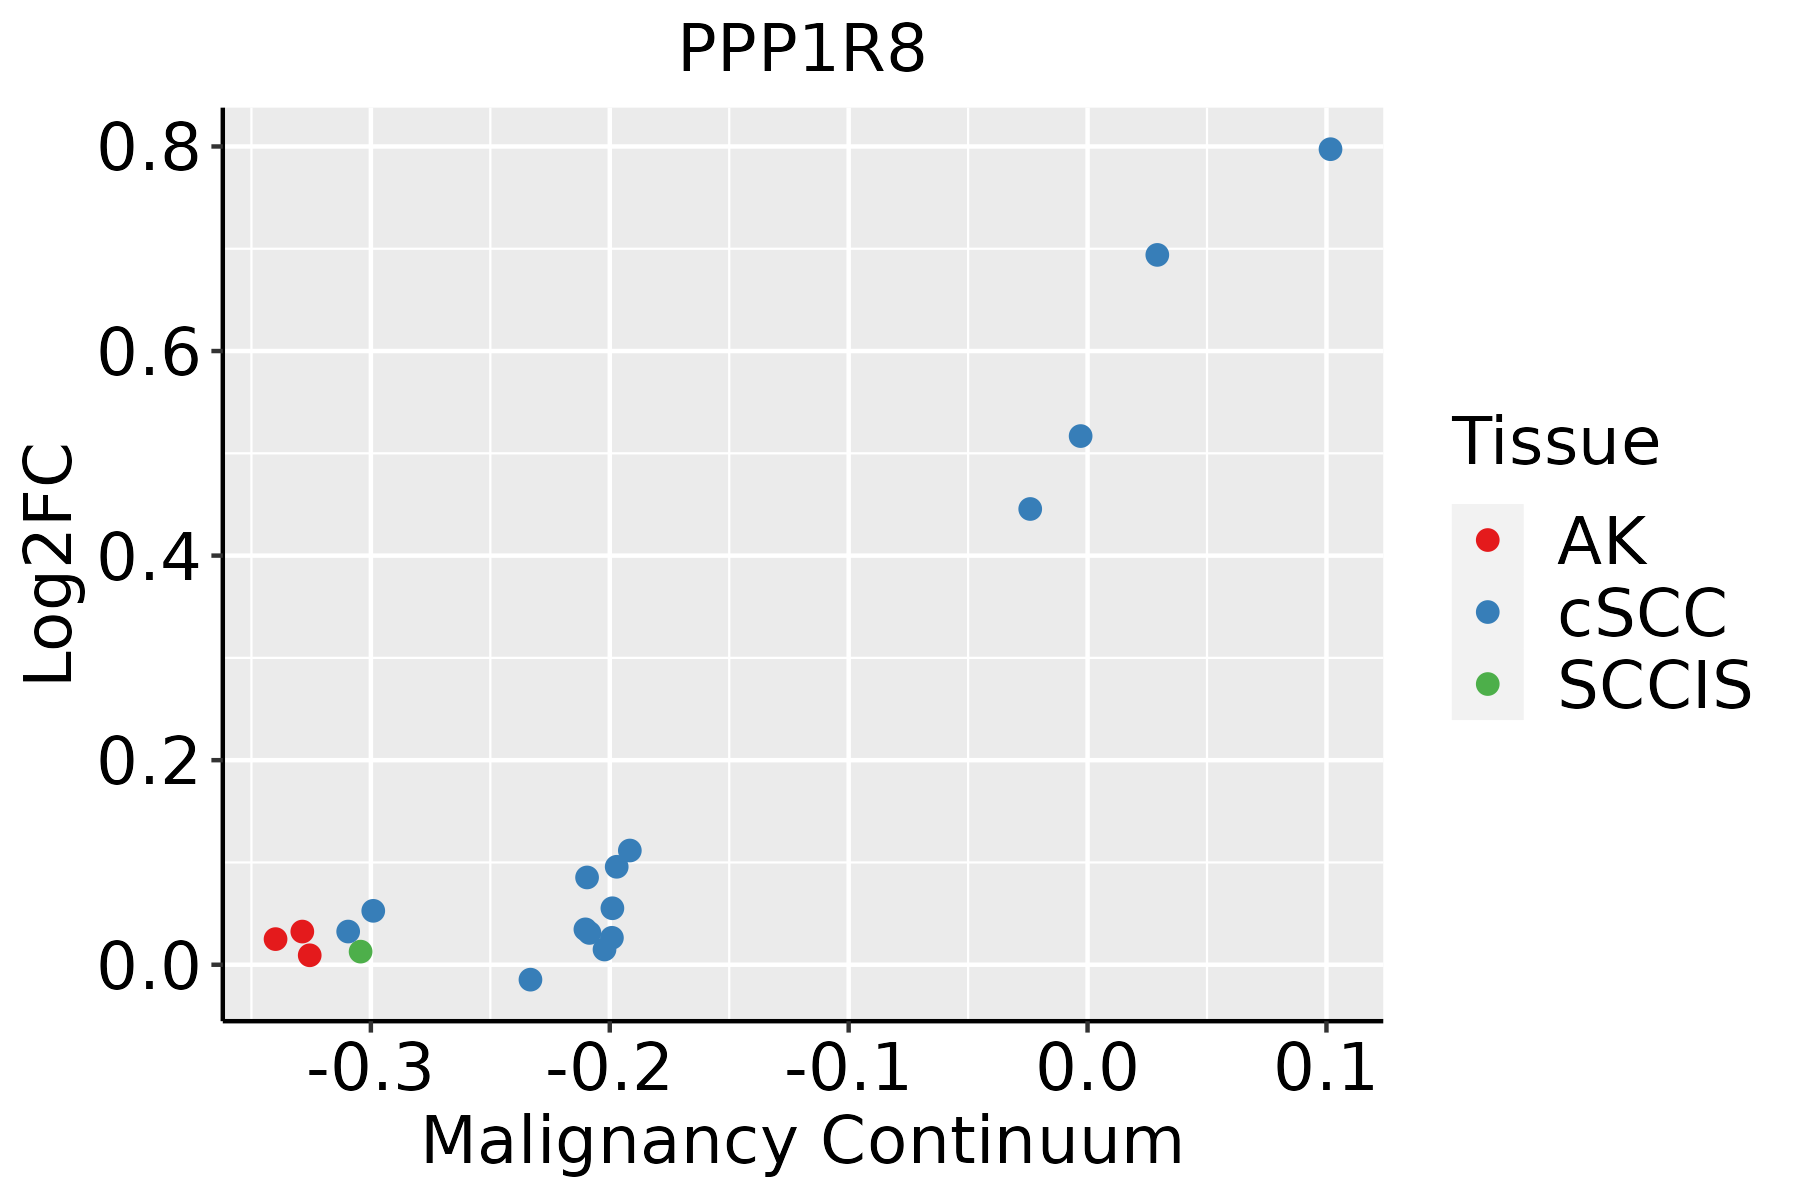 | AK: Actinic keratosis |
| cSCC: Cutaneous squamous cell carcinoma | ||
| SCCIS:squamous cell carcinoma in situ |
| ∗log2FC in expression of this searched gene in stem-like cells from each diseased tissue sample relative to stem-like cells in normal samples in each tissue plotted against the malignancy continuum. Samples are colored based on if they are from different disease stage. |
Top |
Malignant transformation related pathway analysis |
| Find out the enriched GO biological processes and KEGG pathways involved in transition from healthy to precancer to cancer |
| Tissue | Disease Stage | Enriched GO biological Processes |
| Colorectum | AD |  |
| Colorectum | SER |  |
| Colorectum | MSS |  |
| Colorectum | MSI-H |  |
| Colorectum | FAP |  |
| ∗Top 15 enriched GO BP terms are showed in the bar plot of each disease state in each tissue. Each row represents a significant GO biological process which is colored according to the -log10(p.adjust). |
| Page: 1 2 3 4 5 6 7 8 9 |
| GO ID | Tissue | Disease Stage | Description | Gene Ratio | Bg Ratio | pvalue | p.adjust | Count |
| GO:0008380111 | Esophagus | ESCC | RNA splicing | 336/8552 | 434/18723 | 1.74e-42 | 3.67e-39 | 336 |
| GO:0006401110 | Esophagus | ESCC | RNA catabolic process | 204/8552 | 278/18723 | 3.39e-21 | 5.66e-19 | 204 |
| GO:0034655110 | Esophagus | ESCC | nucleobase-containing compound catabolic process | 272/8552 | 407/18723 | 2.92e-18 | 2.90e-16 | 272 |
| GO:004670018 | Esophagus | ESCC | heterocycle catabolic process | 286/8552 | 445/18723 | 1.12e-15 | 7.47e-14 | 286 |
| GO:004427019 | Esophagus | ESCC | cellular nitrogen compound catabolic process | 288/8552 | 451/18723 | 3.03e-15 | 1.79e-13 | 288 |
| GO:001943918 | Esophagus | ESCC | aromatic compound catabolic process | 295/8552 | 467/18723 | 1.09e-14 | 5.98e-13 | 295 |
| GO:190136118 | Esophagus | ESCC | organic cyclic compound catabolic process | 307/8552 | 495/18723 | 9.99e-14 | 4.80e-12 | 307 |
| GO:0010563111 | Esophagus | ESCC | negative regulation of phosphorus metabolic process | 274/8552 | 442/18723 | 2.32e-12 | 9.41e-11 | 274 |
| GO:0045936111 | Esophagus | ESCC | negative regulation of phosphate metabolic process | 273/8552 | 441/18723 | 3.18e-12 | 1.25e-10 | 273 |
| GO:00905013 | Esophagus | ESCC | RNA phosphodiester bond hydrolysis | 110/8552 | 152/18723 | 1.95e-11 | 6.81e-10 | 110 |
| GO:001631110 | Esophagus | ESCC | dephosphorylation | 251/8552 | 417/18723 | 1.26e-09 | 2.99e-08 | 251 |
| GO:000647018 | Esophagus | ESCC | protein dephosphorylation | 177/8552 | 281/18723 | 3.13e-09 | 6.72e-08 | 177 |
| GO:00903053 | Esophagus | ESCC | nucleic acid phosphodiester bond hydrolysis | 163/8552 | 261/18723 | 3.07e-08 | 5.73e-07 | 163 |
| GO:0035304111 | Esophagus | ESCC | regulation of protein dephosphorylation | 66/8552 | 90/18723 | 8.82e-08 | 1.48e-06 | 66 |
| GO:0035303111 | Esophagus | ESCC | regulation of dephosphorylation | 88/8552 | 128/18723 | 1.04e-07 | 1.71e-06 | 88 |
| GO:003530816 | Esophagus | ESCC | negative regulation of protein dephosphorylation | 26/8552 | 34/18723 | 2.53e-04 | 1.55e-03 | 26 |
| GO:00353056 | Esophagus | ESCC | negative regulation of dephosphorylation | 31/8552 | 45/18723 | 1.40e-03 | 6.62e-03 | 31 |
| GO:000838020 | Oral cavity | OSCC | RNA splicing | 308/7305 | 434/18723 | 2.43e-42 | 7.70e-39 | 308 |
| GO:000640118 | Oral cavity | OSCC | RNA catabolic process | 184/7305 | 278/18723 | 2.71e-20 | 4.19e-18 | 184 |
| GO:003465517 | Oral cavity | OSCC | nucleobase-containing compound catabolic process | 244/7305 | 407/18723 | 5.38e-18 | 5.49e-16 | 244 |
| Page: 1 2 3 |
| Pathway ID | Tissue | Disease Stage | Description | Gene Ratio | Bg Ratio | pvalue | p.adjust | qvalue | Count |
| Page: 1 |
Top |
Cell-cell communication analysis |
| Identification of potential cell-cell interactions between two cell types and their ligand-receptor pairs for different disease states |
| Ligand | Receptor | LRpair | Pathway | Tissue | Disease Stage |
| Page: 1 |
Top |
Single-cell gene regulatory network inference analysis |
| Find out the significant the regulons (TFs) and the target genes of each regulon across cell types for different disease states |
| TF | Cell Type | Tissue | Disease Stage | Target Gene | RSS | Regulon Activity |
| ∗The dot plots of a searched regulon are shown for all cell subpopulations in each disease state of each tissue based on the regulon specific score inferred using pySCENIC and by calculating the average expression. |
| Page: 1 |
Top |
Somatic mutation of malignant transformation related genes |
| Annotation of somatic variants for genes involved in malignant transformation |
| Hugo Symbol | Variant Class | Variant Classification | dbSNP RS | HGVSc | HGVSp | HGVSp Short | SWISSPROT | BIOTYPE | SIFT | PolyPhen | Tumor Sample Barcode | Tissue | Histology | Sex | Age | Stage | Therapy Types | Drugs | Outcome |
| PPP1R8 | SNV | Missense_Mutation | c.507N>G | p.Phe169Leu | p.F169L | Q12972 | protein_coding | deleterious(0.01) | benign(0.287) | TCGA-A2-A0YK-01 | Breast | breast invasive carcinoma | Female | <65 | I/II | Chemotherapy | cytoxan | SD | |
| PPP1R8 | insertion | Frame_Shift_Ins | novel | c.597dupA | p.Arg200ThrfsTer6 | p.R200Tfs*6 | Q12972 | protein_coding | TCGA-A2-A0CK-01 | Breast | breast invasive carcinoma | Female | <65 | III/IV | Chemotherapy | taxotere | CR | ||
| PPP1R8 | SNV | Missense_Mutation | c.533N>G | p.Ser178Cys | p.S178C | Q12972 | protein_coding | deleterious(0) | probably_damaging(0.962) | TCGA-DR-A0ZM-01 | Cervix | cervical & endocervical cancer | Female | <65 | III/IV | Unspecific | Cisplatin | SD | |
| PPP1R8 | SNV | Missense_Mutation | c.138G>C | p.Lys46Asn | p.K46N | Q12972 | protein_coding | deleterious(0.04) | probably_damaging(0.977) | TCGA-Q1-A73O-01 | Cervix | cervical & endocervical cancer | Female | <65 | I/II | Chemotherapy | cisplatin | CR | |
| PPP1R8 | SNV | Missense_Mutation | c.802N>T | p.Pro268Ser | p.P268S | Q12972 | protein_coding | tolerated(0.08) | possibly_damaging(0.685) | TCGA-AA-3713-01 | Colorectum | colon adenocarcinoma | Male | >=65 | III/IV | Chemotherapy | 5-fluorouracil | PR | |
| PPP1R8 | SNV | Missense_Mutation | novel | c.23G>A | p.Gly8Asp | p.G8D | Q12972 | protein_coding | tolerated_low_confidence(0.49) | benign(0.005) | TCGA-AJ-A3NE-01 | Endometrium | uterine corpus endometrioid carcinoma | Female | <65 | I/II | Unknown | Unknown | SD |
| PPP1R8 | SNV | Missense_Mutation | novel | c.481N>C | p.Thr161Pro | p.T161P | Q12972 | protein_coding | deleterious(0.02) | possibly_damaging(0.898) | TCGA-AX-A05Z-01 | Endometrium | uterine corpus endometrioid carcinoma | Female | <65 | III/IV | Chemotherapy | adriamycin | SD |
| PPP1R8 | SNV | Missense_Mutation | rs200306314 | c.758N>A | p.Arg253His | p.R253H | Q12972 | protein_coding | tolerated(0.4) | benign(0) | TCGA-AX-A064-01 | Endometrium | uterine corpus endometrioid carcinoma | Female | >=65 | I/II | Unknown | Unknown | SD |
| PPP1R8 | SNV | Missense_Mutation | novel | c.329C>T | p.Pro110Leu | p.P110L | Q12972 | protein_coding | tolerated(0.06) | benign(0.401) | TCGA-B5-A3FC-01 | Endometrium | uterine corpus endometrioid carcinoma | Female | <65 | I/II | Unknown | Unknown | SD |
| PPP1R8 | SNV | Missense_Mutation | c.267N>G | p.Asn89Lys | p.N89K | Q12972 | protein_coding | deleterious(0.01) | benign(0.264) | TCGA-BG-A0MQ-01 | Endometrium | uterine corpus endometrioid carcinoma | Female | >=65 | I/II | Unknown | Unknown | SD |
| Page: 1 2 3 |
Top |
Related drugs of malignant transformation related genes |
| Identification of chemicals and drugs interact with genes involved in malignant transfromation |
| (DGIdb 4.0) |
| Entrez ID | Symbol | Category | Interaction Types | Drug Claim Name | Drug Name | PMIDs |
| Page: 1 |

Copyright 2023-Present -The University of Texas Health Science Center at Houston |