Schematic overview of the cellular and molecular mechanisms involved in the cancer progression, including the proposed cellular and molecular mechanisms in cancer cells trajectory. AT1: alveolar type 1 cells; AT2: alveolar type 2 cells; AAH: atypical adenomatous hyperplasia; AIS: adenocarcinoma in situ; MIA: minimally invasive adenocarcinoma; IA: invasive adenocarcinoma; EMT: epithelial-mesenchymal transition

Home

Download

Statistics

Help

Contact

Center for Computational Systems Medicine
leaf

Gene summary

leaf

Malignant transformation analysis

leaf

Malignant transformation related pathway analysis

leaf

Cell-cell communication analysis

leaf

Single-cell gene regulatory network inference analysis

leaf

Somatic mutation of malignant transformation related genes

leaf

Related drugs of malignant transformation related genes

Gene: PPP1R7

Gene summary for PPP1R7

check button Gene summary.

Gene informationSpeciesHuman
Gene symbol

PPP1R7

Gene ID

5510

Gene nameprotein phosphatase 1 regulatory subunit 7
Gene AliasSDS22
Cytomap2q37.3
Gene Typeprotein-coding
GO ID

GO:0006464

UniProtAcc

Q15435


Top

Malignant transformation analysis

check button Identification of the aberrant gene expression in precancerous and cancerous lesions by comparing the gene expression of stem-like cells in diseased tissues with normal stem cells
check button Malignant transformation involving gene list.
Entrez IDSymbolReplicatesSpeciesOrganTissueAdj P-valueLog2FCMalignancy
5510PPP1R7HTA11_2487_2000001011HumanColorectumSER5.66e-033.33e-01-0.1808
5510PPP1R7HTA11_1938_2000001011HumanColorectumAD2.02e-044.28e-01-0.0811
5510PPP1R7HTA11_347_2000001011HumanColorectumAD5.04e-114.07e-01-0.1954
5510PPP1R7HTA11_3361_2000001011HumanColorectumAD4.32e-023.12e-01-0.1207
5510PPP1R7HTA11_696_2000001011HumanColorectumAD1.81e-063.92e-01-0.1464
5510PPP1R7HTA11_1391_2000001011HumanColorectumAD1.12e-074.39e-01-0.059
5510PPP1R7HTA11_546_2000001011HumanColorectumAD6.55e-044.47e-01-0.0842
5510PPP1R7HTA11_99999965104_69814HumanColorectumMSS9.69e-032.84e-010.281
5510PPP1R7HTA11_99999971662_82457HumanColorectumMSS9.12e-032.92e-010.3859
5510PPP1R7A015-C-203HumanColorectumFAP6.94e-03-1.08e-01-0.1294
5510PPP1R7A002-C-116HumanColorectumFAP1.73e-03-8.85e-02-0.0452
5510PPP1R7A018-E-020HumanColorectumFAP2.03e-02-1.44e-01-0.2034
5510PPP1R7LZE4THumanEsophagusESCC1.81e-174.76e-010.0811
5510PPP1R7LZE7THumanEsophagusESCC5.04e-104.38e-010.0667
5510PPP1R7LZE8THumanEsophagusESCC4.07e-162.99e-010.067
5510PPP1R7LZE20THumanEsophagusESCC4.67e-122.65e-010.0662
5510PPP1R7LZE22THumanEsophagusESCC2.81e-104.31e-010.068
5510PPP1R7LZE24D1HumanEsophagusHGIN3.51e-023.32e-010.054
5510PPP1R7LZE24THumanEsophagusESCC4.53e-227.01e-010.0596
5510PPP1R7LZE21THumanEsophagusESCC4.05e-082.75e-010.0655
Page: 1 2 3 4 5 6 7 

check button Transcriptomic changes along malignancy continuum.
TissueExpression DynamicsAbbreviation
Colorectum (GSE201348)The image shows the transcriptomic changes along malignancy continuum.log2FC in expression of this searched gene in stem-like cells from each diseased tissue sample relative to stem-like cells in normal samples in each tissue plotted against the malignancy continuum. Samples are colored based on if they are from different disease stage.FAP: Familial adenomatous polyposis
CRC: Colorectal cancer
Colorectum (HTA11)The image shows the transcriptomic changes along malignancy continuum.log2FC in expression of this searched gene in stem-like cells from each diseased tissue sample relative to stem-like cells in normal samples in each tissue plotted against the malignancy continuum. Samples are colored based on if they are from different disease stage.AD: Adenomas
SER: Sessile serrated lesions
MSI-H: Microsatellite-high colorectal cancer
MSS: Microsatellite stable colorectal cancer
EsophagusThe image shows the transcriptomic changes along malignancy continuum.log2FC in expression of this searched gene in stem-like cells from each diseased tissue sample relative to stem-like cells in normal samples in each tissue plotted against the malignancy continuum. Samples are colored based on if they are from different disease stage.
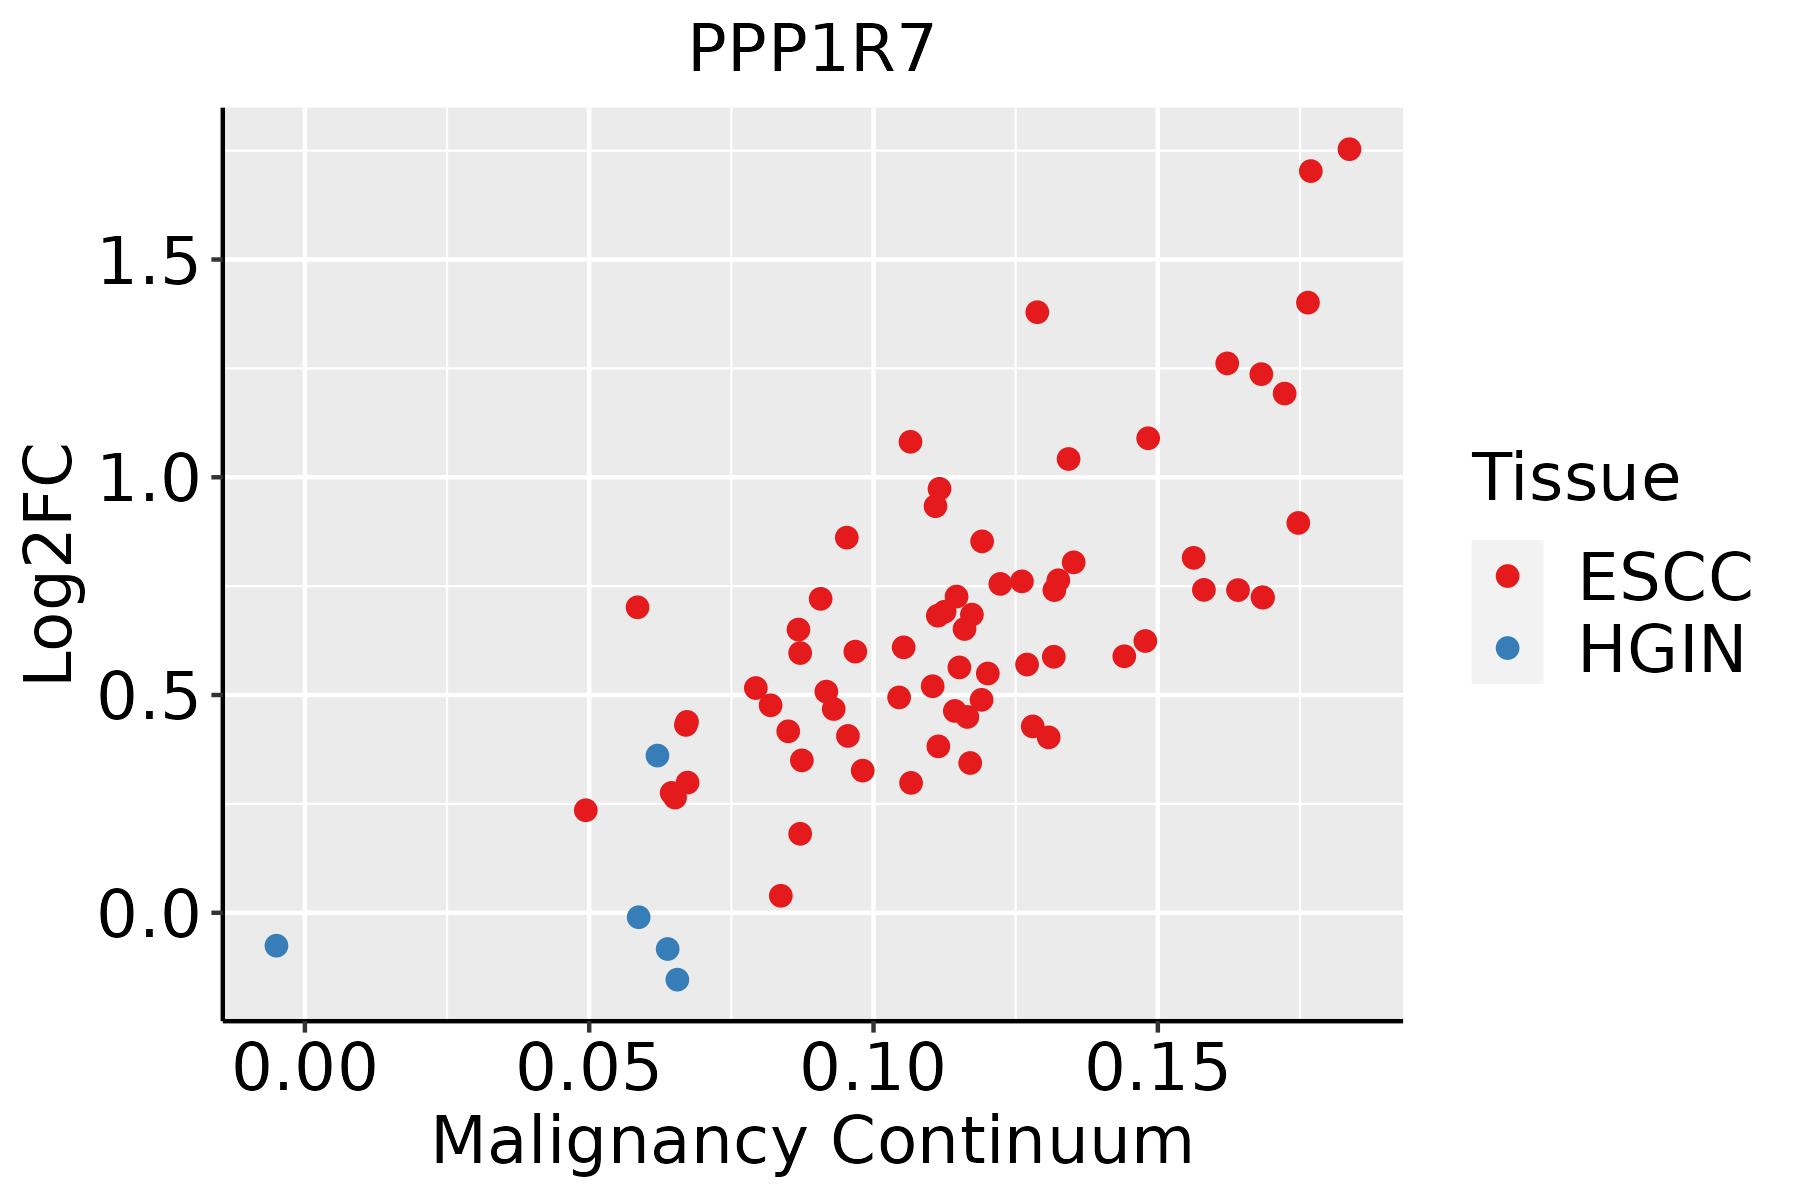
ESCC: Esophageal squamous cell carcinoma
HGIN: High-grade intraepithelial neoplasias
LGIN: Low-grade intraepithelial neoplasias
LiverThe image shows the transcriptomic changes along malignancy continuum.log2FC in expression of this searched gene in stem-like cells from each diseased tissue sample relative to stem-like cells in normal samples in each tissue plotted against the malignancy continuum. Samples are colored based on if they are from different disease stage.HCC: Hepatocellular carcinoma
NAFLD: Non-alcoholic fatty liver disease
Oral CavityThe image shows the transcriptomic changes along malignancy continuum.log2FC in expression of this searched gene in stem-like cells from each diseased tissue sample relative to stem-like cells in normal samples in each tissue plotted against the malignancy continuum. Samples are colored based on if they are from different disease stage.EOLP: Erosive Oral lichen planus
LP: leukoplakia
NEOLP: Non-erosive oral lichen planus
OSCC: Oral squamous cell carcinoma
ProstateThe image shows the transcriptomic changes along malignancy continuum.log2FC in expression of this searched gene in stem-like cells from each diseased tissue sample relative to stem-like cells in normal samples in each tissue plotted against the malignancy continuum. Samples are colored based on if they are from different disease stage.BPH: Benign Prostatic Hyperplasia
SkinThe image shows the transcriptomic changes along malignancy continuum.log2FC in expression of this searched gene in stem-like cells from each diseased tissue sample relative to stem-like cells in normal samples in each tissue plotted against the malignancy continuum. Samples are colored based on if they are from different disease stage.
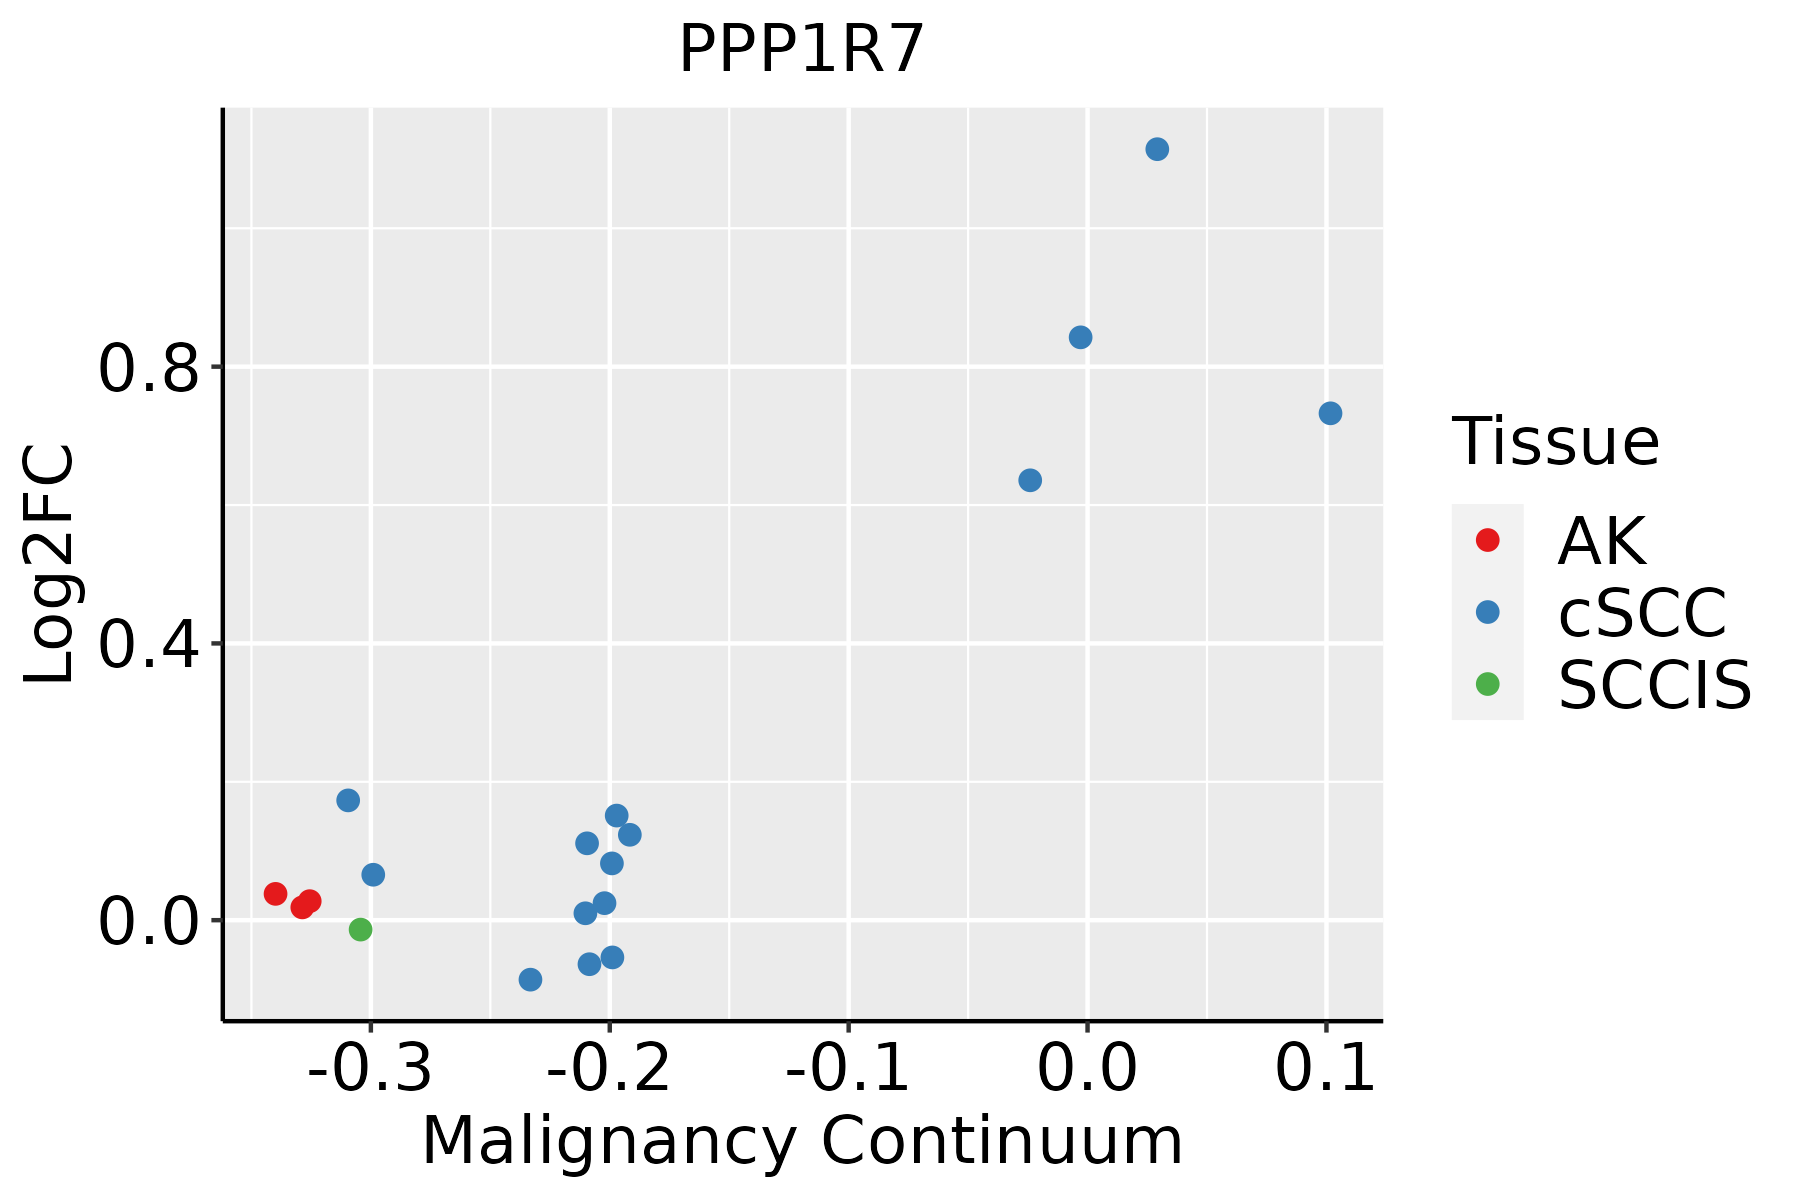
AK: Actinic keratosis
cSCC: Cutaneous squamous cell carcinoma
SCCIS:squamous cell carcinoma in situ
ThyroidThe image shows the transcriptomic changes along malignancy continuum.log2FC in expression of this searched gene in stem-like cells from each diseased tissue sample relative to stem-like cells in normal samples in each tissue plotted against the malignancy continuum. Samples are colored based on if they are from different disease stage.
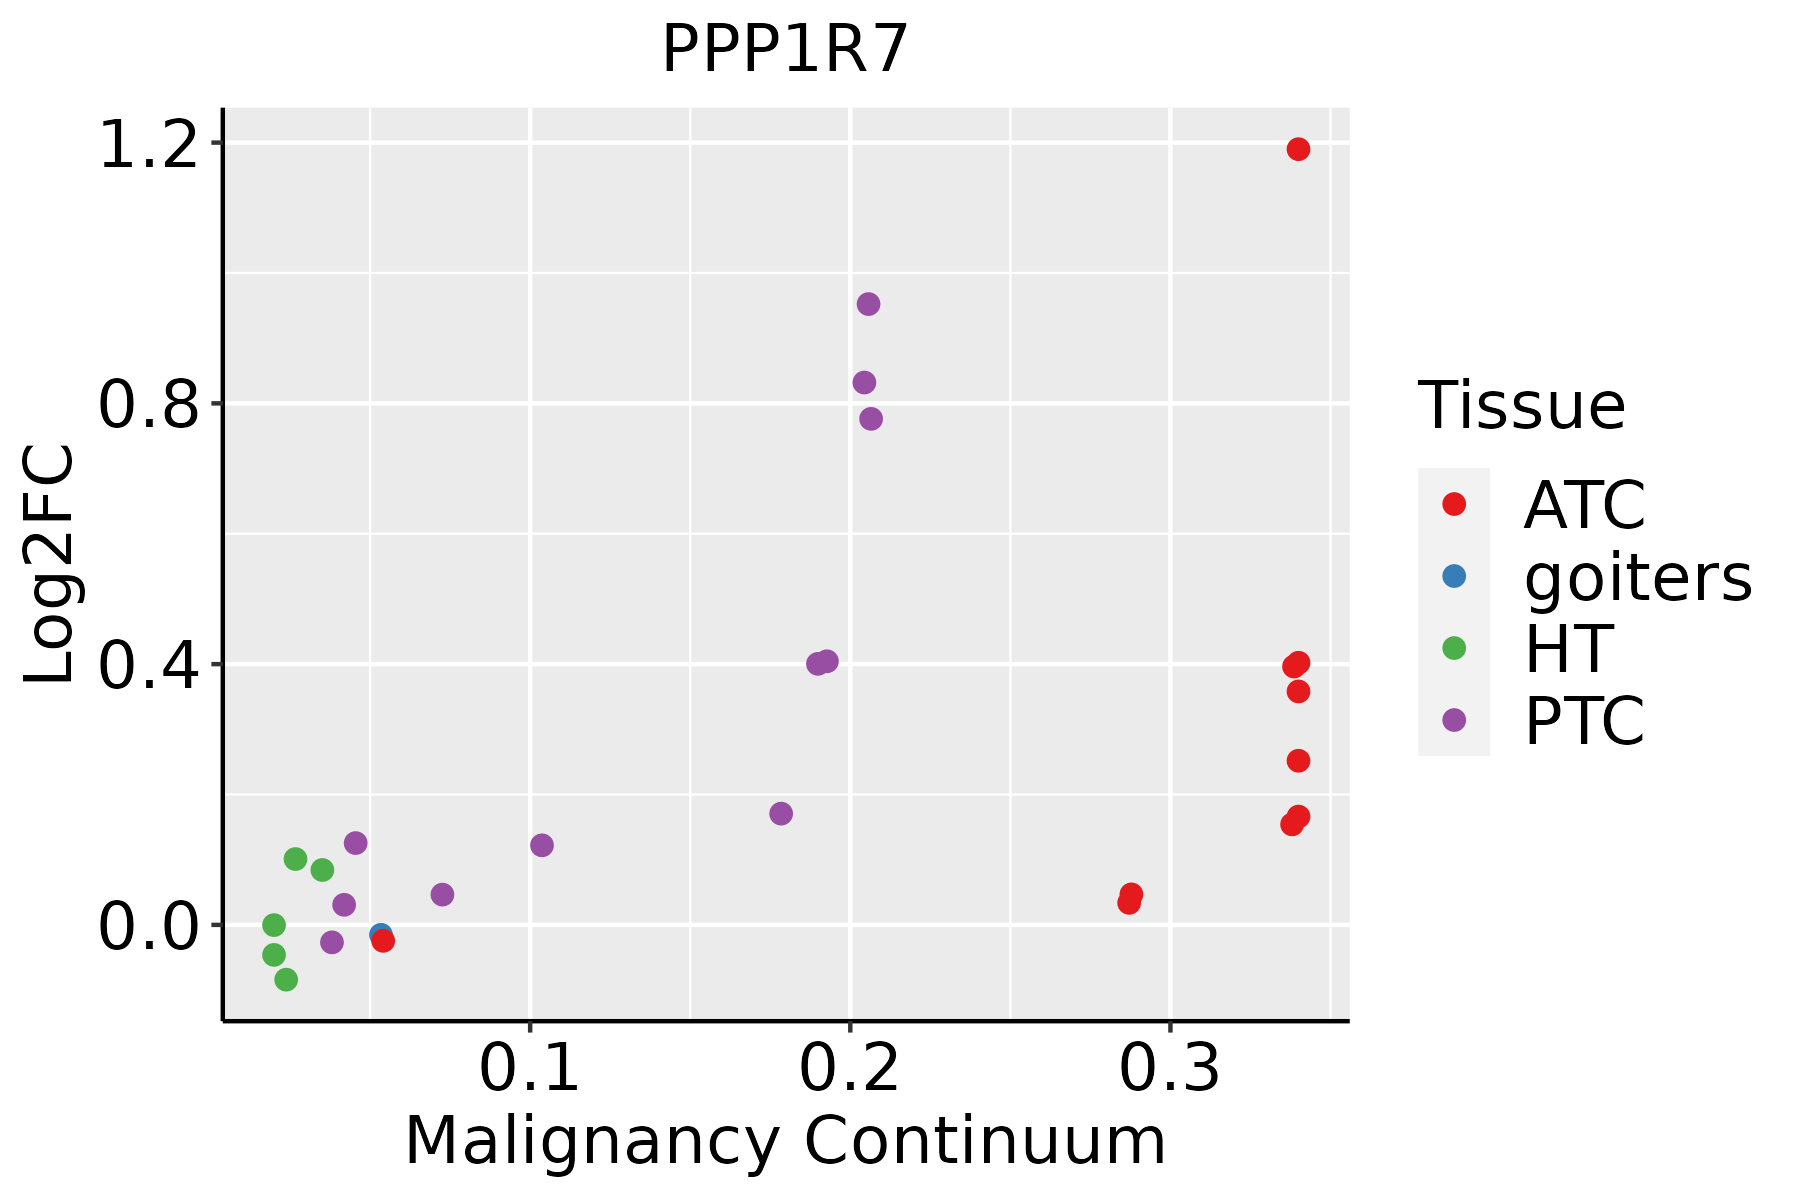
ATC: Anaplastic thyroid cancer
HT: Hashimoto's thyroiditis
PTC: Papillary thyroid cancer
∗log2FC in expression of this searched gene in stem-like cells from each diseased tissue sample relative to stem-like cells in normal samples in each tissue plotted against the malignancy continuum. Samples are colored based on if they are from different disease stage.

Top

Malignant transformation related pathway analysis

check buttonFind out the enriched GO biological processes and KEGG pathways involved in transition from healthy to precancer to cancer
check button Figure of enriched GO biological processes.
TissueDisease StageEnriched GO biological Processes
ColorectumADGO analysis - Figure of enriched GO biological processes: Top 15 enriched GO BP terms are showed in the bar plot of each disease state in each tissue. Each row represents a significant GO biological process which is colored according to the -log10(p.adjust).
ColorectumSERGO analysis - Figure of enriched GO biological processes: Top 15 enriched GO BP terms are showed in the bar plot of each disease state in each tissue. Each row represents a significant GO biological process which is colored according to the -log10(p.adjust).
ColorectumMSSGO analysis - Figure of enriched GO biological processes: Top 15 enriched GO BP terms are showed in the bar plot of each disease state in each tissue. Each row represents a significant GO biological process which is colored according to the -log10(p.adjust).
ColorectumMSI-HGO analysis - Figure of enriched GO biological processes: Top 15 enriched GO BP terms are showed in the bar plot of each disease state in each tissue. Each row represents a significant GO biological process which is colored according to the -log10(p.adjust).
ColorectumFAPGO analysis - Figure of enriched GO biological processes: Top 15 enriched GO BP terms are showed in the bar plot of each disease state in each tissue. Each row represents a significant GO biological process which is colored according to the -log10(p.adjust).
∗Top 15 enriched GO BP terms are showed in the bar plot of each disease state in each tissue. Each row represents a significant GO biological process which is colored according to the -log10(p.adjust).
Page: 1 2 3 4 5 6 7 8 9 

check button Enriched GO biological processes.
GO IDTissueDisease StageDescriptionGene RatioBg Ratiopvaluep.adjustCount
GO:0016311ColorectumADdephosphorylation123/3918417/187231.84e-053.82e-04123
GO:0006470ColorectumADprotein dephosphorylation88/3918281/187232.56e-054.89e-0488
GO:0035303ColorectumADregulation of dephosphorylation46/3918128/187236.20e-051.04e-0346
GO:0035304ColorectumADregulation of protein dephosphorylation33/391890/187234.23e-044.77e-0333
GO:0035306ColorectumADpositive regulation of dephosphorylation22/391859/187232.86e-032.14e-0222
GO:00064701ColorectumSERprotein dephosphorylation65/2897281/187234.44e-046.51e-0365
GO:00353031ColorectumSERregulation of dephosphorylation33/2897128/187231.71e-031.78e-0233
GO:00353041ColorectumSERregulation of protein dephosphorylation25/289790/187232.00e-031.98e-0225
GO:00163111ColorectumSERdephosphorylation86/2897417/187232.73e-032.46e-0286
GO:00353032ColorectumMSSregulation of dephosphorylation41/3467128/187231.64e-042.33e-0341
GO:00353042ColorectumMSSregulation of protein dephosphorylation30/346790/187235.58e-046.19e-0330
GO:00064702ColorectumMSSprotein dephosphorylation73/3467281/187231.15e-031.12e-0273
GO:00163112ColorectumMSSdephosphorylation101/3467417/187231.98e-031.70e-02101
GO:00163113ColorectumFAPdephosphorylation95/2622417/187237.07e-073.32e-0595
GO:00064704ColorectumFAPprotein dephosphorylation69/2622281/187231.47e-066.39e-0569
GO:00353034ColorectumFAPregulation of dephosphorylation36/2622128/187232.22e-055.28e-0436
GO:00353044ColorectumFAPregulation of protein dephosphorylation24/262290/187231.12e-031.08e-0224
GO:00353061ColorectumFAPpositive regulation of dephosphorylation16/262259/187235.95e-033.75e-0216
GO:001631110EsophagusESCCdephosphorylation251/8552417/187231.26e-092.99e-08251
GO:000647018EsophagusESCCprotein dephosphorylation177/8552281/187233.13e-096.72e-08177
Page: 1 2 3 4 

check button Enriched KEGG pathways.
Pathway IDTissueDisease StageDescriptionGene RatioBg Ratiopvaluep.adjustqvalueCount
Page: 1 

Top

Cell-cell communication analysis

check buttonIdentification of potential cell-cell interactions between two cell types and their ligand-receptor pairs for different disease states
LigandReceptorLRpairPathwayTissueDisease Stage
Page: 1 

Top

Single-cell gene regulatory network inference analysis

check buttonFind out the significant the regulons (TFs) and the target genes of each regulon across cell types for different disease states
TFCell TypeTissueDisease StageTarget GeneRSSRegulon Activity
∗The dot plots of a searched regulon are shown for all cell subpopulations in each disease state of each tissue based on the regulon specific score inferred using pySCENIC and by calculating the average expression.
Page: 1 

Top

Somatic mutation of malignant transformation related genes

check buttonAnnotation of somatic variants for genes involved in malignant transformation
Hugo SymbolVariant ClassVariant ClassificationdbSNP RSHGVScHGVSpHGVSp ShortSWISSPROTBIOTYPESIFTPolyPhenTumor Sample BarcodeTissueHistologySexAgeStageTherapy TypesDrugsOutcome
PPP1R7SNVMissense_Mutationc.370N>Ap.Glu124Lysp.E124KQ15435protein_codingdeleterious(0)probably_damaging(0.997)TCGA-A7-A13G-01Breastbreast invasive carcinomaFemale>=65I/IIHormone TherapyarimidexPD
PPP1R7SNVMissense_Mutationnovelc.121N>Ap.Ala41Thrp.A41TQ15435protein_codingtolerated(0.35)benign(0)TCGA-PL-A8LV-01Breastbreast invasive carcinomaFemale<65III/IVUnknownUnknownSD
PPP1R7insertionIn_Frame_Insnovelc.844_845insTTTCTAp.Ala282delinsValSerThrp.A282delinsVSTQ15435protein_codingTCGA-A2-A0CQ-01Breastbreast invasive carcinomaFemale<65I/IIChemotherapyadriamycinSD
PPP1R7insertionFrame_Shift_Insnovelc.846_847insATTGTCAGCCTTTCTTCAGAGCGp.Ser283IlefsTer21p.S283Ifs*21Q15435protein_codingTCGA-A2-A0CQ-01Breastbreast invasive carcinomaFemale<65I/IIChemotherapyadriamycinSD
PPP1R7insertionIn_Frame_Insnovelc.805_806insCTCACTGCAAGCTCCp.Gly269delinsAlaHisCysLysLeuArgp.G269delinsAHCKLRQ15435protein_codingTCGA-BH-A0B8-01Breastbreast invasive carcinomaFemale<65I/IIHormone TherapyarimidexSD
PPP1R7SNVMissense_Mutationc.91N>Ap.Glu31Lysp.E31KQ15435protein_codingtolerated(0.05)benign(0.114)TCGA-EA-A3HQ-01Cervixcervical & endocervical cancerFemale<65I/IIUnknownUnknownSD
PPP1R7SNVMissense_Mutationc.889G>Ap.Glu297Lysp.E297KQ15435protein_codingtolerated(0.36)benign(0.007)TCGA-ZJ-AAXT-01Cervixcervical & endocervical cancerFemale<65III/IVUnknownUnknownSD
PPP1R7SNVMissense_Mutationc.280N>Gp.Phe94Valp.F94VQ15435protein_codingdeleterious(0.02)benign(0.206)TCGA-AA-A010-01Colorectumcolon adenocarcinomaFemale<65I/IIChemotherapyfolinicCR
PPP1R7SNVMissense_Mutationrs758294774c.988N>Tp.Arg330Trpp.R330WQ15435protein_codingtolerated(0.05)benign(0.386)TCGA-CA-6717-01Colorectumcolon adenocarcinomaMale<65I/IIChemotherapyoxaliplatinCR
PPP1R7SNVMissense_Mutationrs777048169c.67G>Ap.Glu23Lysp.E23KQ15435protein_codingdeleterious(0.01)benign(0.115)TCGA-D5-6931-01Colorectumcolon adenocarcinomaMale>=65III/IVUnknownUnknownSD
Page: 1 2 3 4 5 

Top

Related drugs of malignant transformation related genes

check buttonIdentification of chemicals and drugs interact with genes involved in malignant transfromation
(DGIdb 4.0)
Entrez IDSymbolCategoryInteraction TypesDrug Claim NameDrug NamePMIDs
Page: 1