
|
|||||
|
 | |
| |
| |
| |
| |
| |
|
Gene: PPP1R3G |
Gene summary for PPP1R3G |
| Gene information | Species | Human | Gene symbol | PPP1R3G | Gene ID | 648791 |
| Gene name | protein phosphatase 1 regulatory subunit 3G | |
| Gene Alias | PPP1R3G | |
| Cytomap | 6p25.1 | |
| Gene Type | protein-coding | GO ID | GO:0000271 | UniProtAcc | B7ZBB8 |
Top |
Malignant transformation analysis |
| Identification of the aberrant gene expression in precancerous and cancerous lesions by comparing the gene expression of stem-like cells in diseased tissues with normal stem cells |
| Entrez ID | Symbol | Replicates | Species | Organ | Tissue | Adj P-value | Log2FC | Malignancy |
| 648791 | PPP1R3G | HCC1_Meng | Human | Liver | HCC | 4.06e-02 | 2.48e-02 | 0.0246 |
| 648791 | PPP1R3G | HCC1 | Human | Liver | HCC | 7.77e-09 | 4.06e+00 | 0.5336 |
| 648791 | PPP1R3G | S014 | Human | Liver | HCC | 1.72e-35 | 1.13e+00 | 0.2254 |
| 648791 | PPP1R3G | S015 | Human | Liver | HCC | 4.77e-33 | 1.52e+00 | 0.2375 |
| 648791 | PPP1R3G | S016 | Human | Liver | HCC | 1.78e-51 | 1.61e+00 | 0.2243 |
| Page: 1 |
| Tissue | Expression Dynamics | Abbreviation |
| Liver | 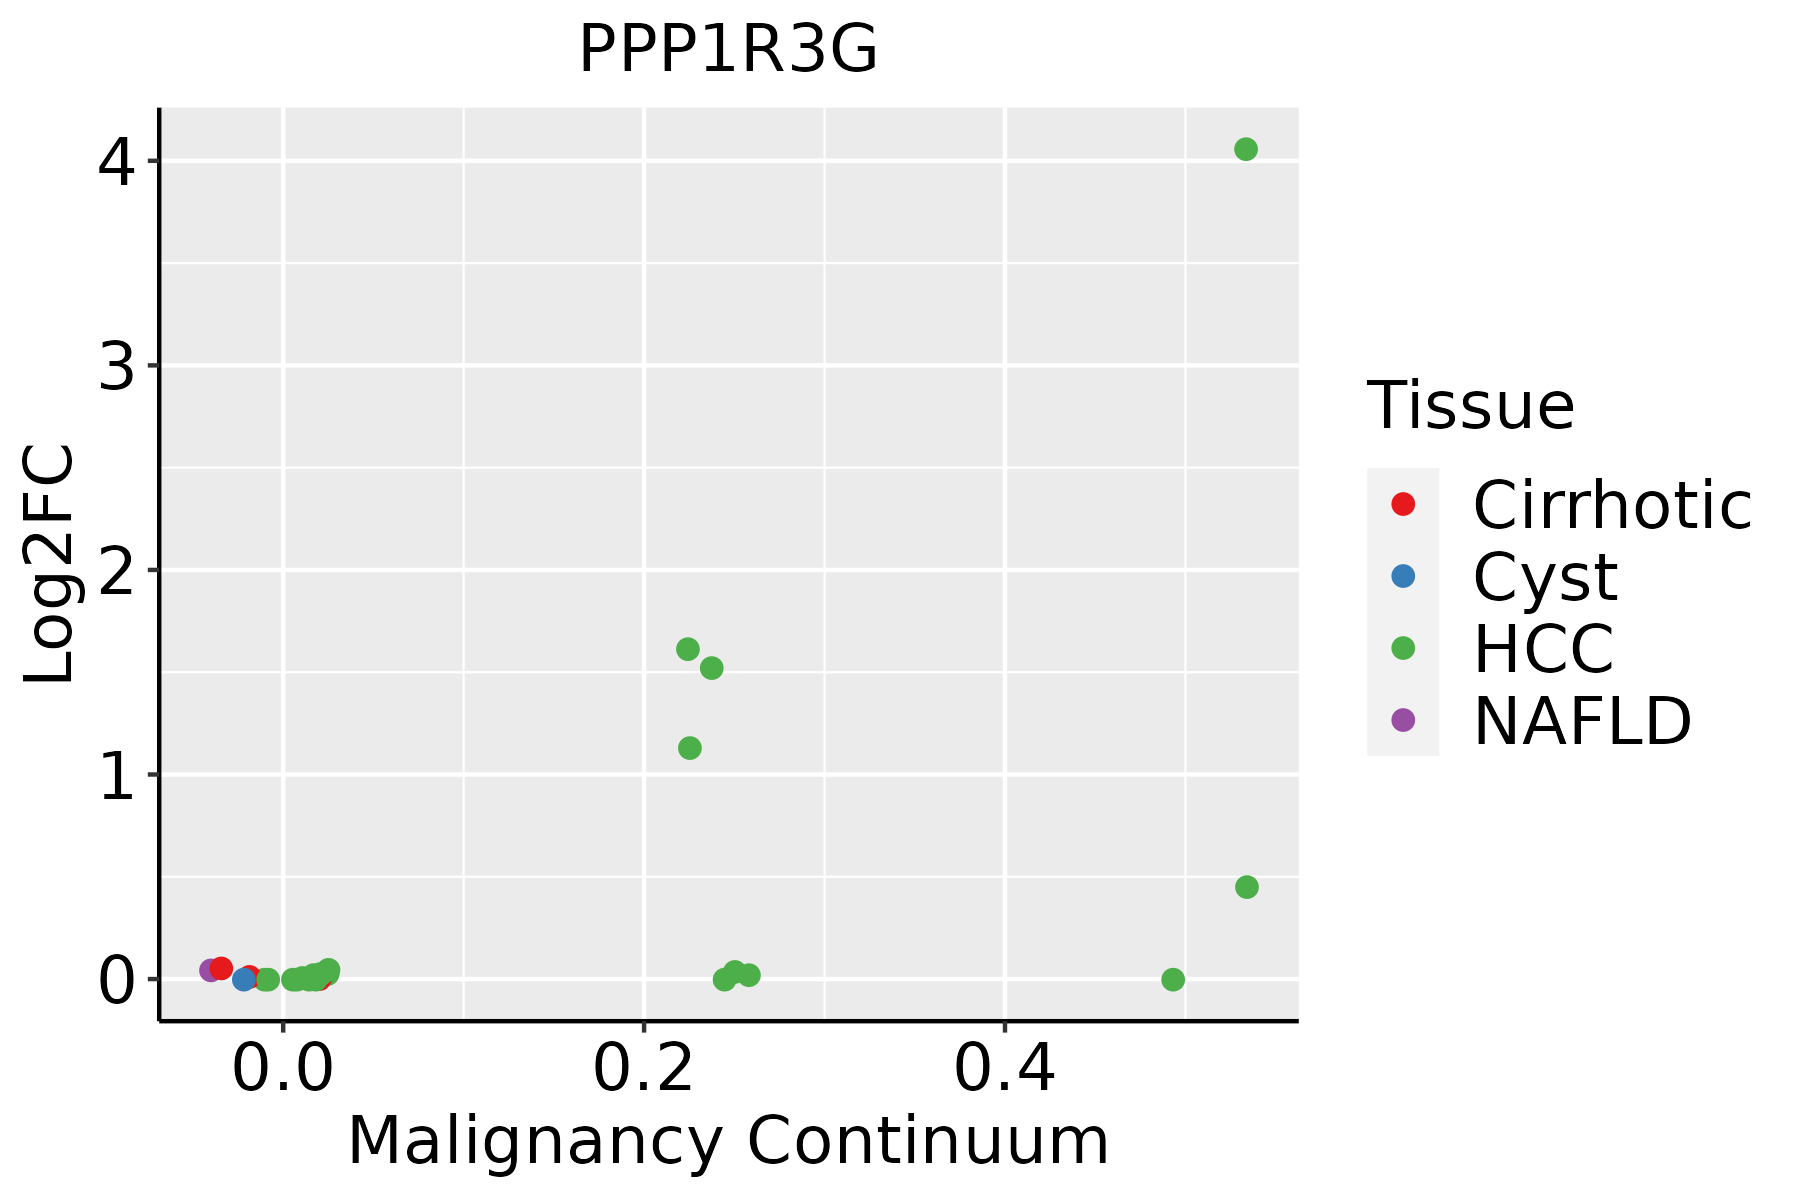 | HCC: Hepatocellular carcinoma |
| NAFLD: Non-alcoholic fatty liver disease |
| ∗log2FC in expression of this searched gene in stem-like cells from each diseased tissue sample relative to stem-like cells in normal samples in each tissue plotted against the malignancy continuum. Samples are colored based on if they are from different disease stage. |
Top |
Malignant transformation related pathway analysis |
| Find out the enriched GO biological processes and KEGG pathways involved in transition from healthy to precancer to cancer |
| Tissue | Disease Stage | Enriched GO biological Processes |
| Colorectum | AD |  |
| Colorectum | SER |  |
| Colorectum | MSS |  |
| Colorectum | MSI-H |  |
| Colorectum | FAP |  |
| ∗Top 15 enriched GO BP terms are showed in the bar plot of each disease state in each tissue. Each row represents a significant GO biological process which is colored according to the -log10(p.adjust). |
| Page: 1 2 3 4 5 6 7 8 9 |
| GO ID | Tissue | Disease Stage | Description | Gene Ratio | Bg Ratio | pvalue | p.adjust | Count |
| GO:000609122 | Liver | HCC | generation of precursor metabolites and energy | 340/7958 | 490/18723 | 4.04e-34 | 2.85e-31 | 340 |
| GO:001598022 | Liver | HCC | energy derivation by oxidation of organic compounds | 221/7958 | 318/18723 | 1.02e-22 | 1.86e-20 | 221 |
| GO:000599621 | Liver | HCC | monosaccharide metabolic process | 167/7958 | 257/18723 | 2.31e-13 | 1.25e-11 | 167 |
| GO:001931821 | Liver | HCC | hexose metabolic process | 155/7958 | 237/18723 | 7.63e-13 | 3.90e-11 | 155 |
| GO:000600621 | Liver | HCC | glucose metabolic process | 128/7958 | 196/18723 | 8.60e-11 | 3.06e-09 | 128 |
| GO:004346722 | Liver | HCC | regulation of generation of precursor metabolites and energy | 89/7958 | 130/18723 | 1.84e-09 | 5.35e-08 | 89 |
| GO:006201222 | Liver | HCC | regulation of small molecule metabolic process | 190/7958 | 334/18723 | 6.77e-08 | 1.40e-06 | 190 |
| GO:000610921 | Liver | HCC | regulation of carbohydrate metabolic process | 109/7958 | 178/18723 | 3.36e-07 | 5.78e-06 | 109 |
| GO:00109062 | Liver | HCC | regulation of glucose metabolic process | 76/7958 | 119/18723 | 2.03e-06 | 2.79e-05 | 76 |
| GO:00106752 | Liver | HCC | regulation of cellular carbohydrate metabolic process | 88/7958 | 146/18723 | 1.08e-05 | 1.24e-04 | 88 |
| GO:004426221 | Liver | HCC | cellular carbohydrate metabolic process | 153/7958 | 283/18723 | 5.27e-05 | 5.00e-04 | 153 |
| GO:00160512 | Liver | HCC | carbohydrate biosynthetic process | 113/7958 | 202/18723 | 7.64e-05 | 6.83e-04 | 113 |
| GO:00059772 | Liver | HCC | glycogen metabolic process | 46/7958 | 72/18723 | 2.02e-04 | 1.56e-03 | 46 |
| GO:00060732 | Liver | HCC | cellular glucan metabolic process | 46/7958 | 73/18723 | 3.23e-04 | 2.28e-03 | 46 |
| GO:00440422 | Liver | HCC | glucan metabolic process | 46/7958 | 73/18723 | 3.23e-04 | 2.28e-03 | 46 |
| GO:004259322 | Liver | HCC | glucose homeostasis | 137/7958 | 258/18723 | 3.59e-04 | 2.49e-03 | 137 |
| GO:003350022 | Liver | HCC | carbohydrate homeostasis | 137/7958 | 259/18723 | 4.45e-04 | 2.98e-03 | 137 |
| GO:00059781 | Liver | HCC | glycogen biosynthetic process | 29/7958 | 44/18723 | 1.46e-03 | 7.75e-03 | 29 |
| GO:00092501 | Liver | HCC | glucan biosynthetic process | 29/7958 | 44/18723 | 1.46e-03 | 7.75e-03 | 29 |
| GO:00432551 | Liver | HCC | regulation of carbohydrate biosynthetic process | 56/7958 | 97/18723 | 1.75e-03 | 9.11e-03 | 56 |
| Page: 1 2 |
| Pathway ID | Tissue | Disease Stage | Description | Gene Ratio | Bg Ratio | pvalue | p.adjust | qvalue | Count |
| Page: 1 |
Top |
Cell-cell communication analysis |
| Identification of potential cell-cell interactions between two cell types and their ligand-receptor pairs for different disease states |
| Ligand | Receptor | LRpair | Pathway | Tissue | Disease Stage |
| Page: 1 |
Top |
Single-cell gene regulatory network inference analysis |
| Find out the significant the regulons (TFs) and the target genes of each regulon across cell types for different disease states |
| TF | Cell Type | Tissue | Disease Stage | Target Gene | RSS | Regulon Activity |
| ∗The dot plots of a searched regulon are shown for all cell subpopulations in each disease state of each tissue based on the regulon specific score inferred using pySCENIC and by calculating the average expression. |
| Page: 1 |
Top |
Somatic mutation of malignant transformation related genes |
| Annotation of somatic variants for genes involved in malignant transformation |
| Hugo Symbol | Variant Class | Variant Classification | dbSNP RS | HGVSc | HGVSp | HGVSp Short | SWISSPROT | BIOTYPE | SIFT | PolyPhen | Tumor Sample Barcode | Tissue | Histology | Sex | Age | Stage | Therapy Types | Drugs | Outcome |
| PPP1R3G | SNV | Missense_Mutation | novel | c.1027N>T | p.Ala343Ser | p.A343S | B7ZBB8 | protein_coding | tolerated(0.69) | benign(0.033) | TCGA-JW-A5VL-01 | Cervix | cervical & endocervical cancer | Female | <65 | I/II | Unknown | Unknown | SD |
| PPP1R3G | SNV | Missense_Mutation | c.961N>T | p.Arg321Cys | p.R321C | B7ZBB8 | protein_coding | tolerated(0.05) | possibly_damaging(0.594) | TCGA-AA-3492-01 | Colorectum | colon adenocarcinoma | Female | >=65 | I/II | Unknown | Unknown | SD | |
| PPP1R3G | SNV | Missense_Mutation | c.142N>A | p.Pro48Thr | p.P48T | B7ZBB8 | protein_coding | tolerated(0.1) | benign(0.051) | TCGA-AZ-6598-01 | Colorectum | colon adenocarcinoma | Female | >=65 | I/II | Unknown | Unknown | SD | |
| PPP1R3G | SNV | Missense_Mutation | c.1028C>T | p.Ala343Val | p.A343V | B7ZBB8 | protein_coding | tolerated(0.16) | possibly_damaging(0.51) | TCGA-G4-6628-01 | Colorectum | colon adenocarcinoma | Male | >=65 | I/II | Unknown | Unknown | SD | |
| PPP1R3G | SNV | Missense_Mutation | novel | c.983C>T | p.Ala328Val | p.A328V | B7ZBB8 | protein_coding | deleterious(0) | probably_damaging(0.996) | TCGA-BG-A222-01 | Endometrium | uterine corpus endometrioid carcinoma | Female | <65 | I/II | Unknown | Unknown | SD |
| PPP1R3G | SNV | Missense_Mutation | c.1069N>A | p.Ala357Thr | p.A357T | B7ZBB8 | protein_coding | tolerated_low_confidence(0.05) | benign(0.018) | TCGA-EO-A22U-01 | Endometrium | uterine corpus endometrioid carcinoma | Female | >=65 | I/II | Unknown | Unknown | SD | |
| PPP1R3G | SNV | Missense_Mutation | novel | c.104T>C | p.Val35Ala | p.V35A | B7ZBB8 | protein_coding | tolerated(0.23) | benign(0.003) | TCGA-FI-A2D5-01 | Endometrium | uterine corpus endometrioid carcinoma | Female | <65 | III/IV | Chemotherapy | carboplatinum | PD |
| PPP1R3G | SNV | Missense_Mutation | novel | c.926G>A | p.Gly309Asp | p.G309D | B7ZBB8 | protein_coding | tolerated(0.05) | possibly_damaging(0.896) | TCGA-FI-A2D5-01 | Endometrium | uterine corpus endometrioid carcinoma | Female | <65 | III/IV | Chemotherapy | carboplatinum | PD |
| Page: 1 |
Top |
Related drugs of malignant transformation related genes |
| Identification of chemicals and drugs interact with genes involved in malignant transfromation |
| (DGIdb 4.0) |
| Entrez ID | Symbol | Category | Interaction Types | Drug Claim Name | Drug Name | PMIDs |
| Page: 1 |

Copyright 2023-Present -The University of Texas Health Science Center at Houston |