
|
|||||
|
 | |
| |
| |
| |
| |
| |
|
Gene: PPP1R3B |
Gene summary for PPP1R3B |
| Gene information | Species | Human | Gene symbol | PPP1R3B | Gene ID | 79660 |
| Gene name | protein phosphatase 1 regulatory subunit 3B | |
| Gene Alias | GL | |
| Cytomap | 8p23.1 | |
| Gene Type | protein-coding | GO ID | GO:0000271 | UniProtAcc | Q86XI6 |
Top |
Malignant transformation analysis |
| Identification of the aberrant gene expression in precancerous and cancerous lesions by comparing the gene expression of stem-like cells in diseased tissues with normal stem cells |
| Entrez ID | Symbol | Replicates | Species | Organ | Tissue | Adj P-value | Log2FC | Malignancy |
| 79660 | PPP1R3B | LZE24T | Human | Esophagus | ESCC | 2.91e-02 | 8.04e-02 | 0.0596 |
| 79660 | PPP1R3B | P2T-E | Human | Esophagus | ESCC | 2.36e-08 | 1.45e-01 | 0.1177 |
| 79660 | PPP1R3B | P4T-E | Human | Esophagus | ESCC | 2.42e-02 | 3.28e-02 | 0.1323 |
| 79660 | PPP1R3B | P5T-E | Human | Esophagus | ESCC | 4.12e-11 | 2.28e-01 | 0.1327 |
| 79660 | PPP1R3B | P8T-E | Human | Esophagus | ESCC | 1.62e-13 | 2.20e-01 | 0.0889 |
| 79660 | PPP1R3B | P12T-E | Human | Esophagus | ESCC | 4.24e-18 | 3.45e-01 | 0.1122 |
| 79660 | PPP1R3B | P15T-E | Human | Esophagus | ESCC | 1.04e-05 | 1.19e-01 | 0.1149 |
| 79660 | PPP1R3B | P16T-E | Human | Esophagus | ESCC | 9.16e-08 | 1.67e-01 | 0.1153 |
| 79660 | PPP1R3B | P21T-E | Human | Esophagus | ESCC | 7.90e-03 | 3.38e-02 | 0.1617 |
| 79660 | PPP1R3B | P22T-E | Human | Esophagus | ESCC | 4.41e-07 | 1.56e-01 | 0.1236 |
| 79660 | PPP1R3B | P23T-E | Human | Esophagus | ESCC | 1.85e-02 | 3.90e-02 | 0.108 |
| 79660 | PPP1R3B | P26T-E | Human | Esophagus | ESCC | 3.28e-14 | 2.25e-01 | 0.1276 |
| 79660 | PPP1R3B | P27T-E | Human | Esophagus | ESCC | 2.60e-06 | 7.57e-02 | 0.1055 |
| 79660 | PPP1R3B | P28T-E | Human | Esophagus | ESCC | 2.65e-11 | 2.52e-01 | 0.1149 |
| 79660 | PPP1R3B | P32T-E | Human | Esophagus | ESCC | 1.96e-05 | 1.13e-01 | 0.1666 |
| 79660 | PPP1R3B | P36T-E | Human | Esophagus | ESCC | 8.10e-06 | 3.65e-01 | 0.1187 |
| 79660 | PPP1R3B | P37T-E | Human | Esophagus | ESCC | 1.87e-05 | 1.61e-01 | 0.1371 |
| 79660 | PPP1R3B | P38T-E | Human | Esophagus | ESCC | 7.72e-16 | 9.24e-01 | 0.127 |
| 79660 | PPP1R3B | P47T-E | Human | Esophagus | ESCC | 2.27e-03 | 9.50e-02 | 0.1067 |
| 79660 | PPP1R3B | P52T-E | Human | Esophagus | ESCC | 4.17e-05 | 9.15e-02 | 0.1555 |
| Page: 1 2 3 |
| Tissue | Expression Dynamics | Abbreviation |
| Esophagus | 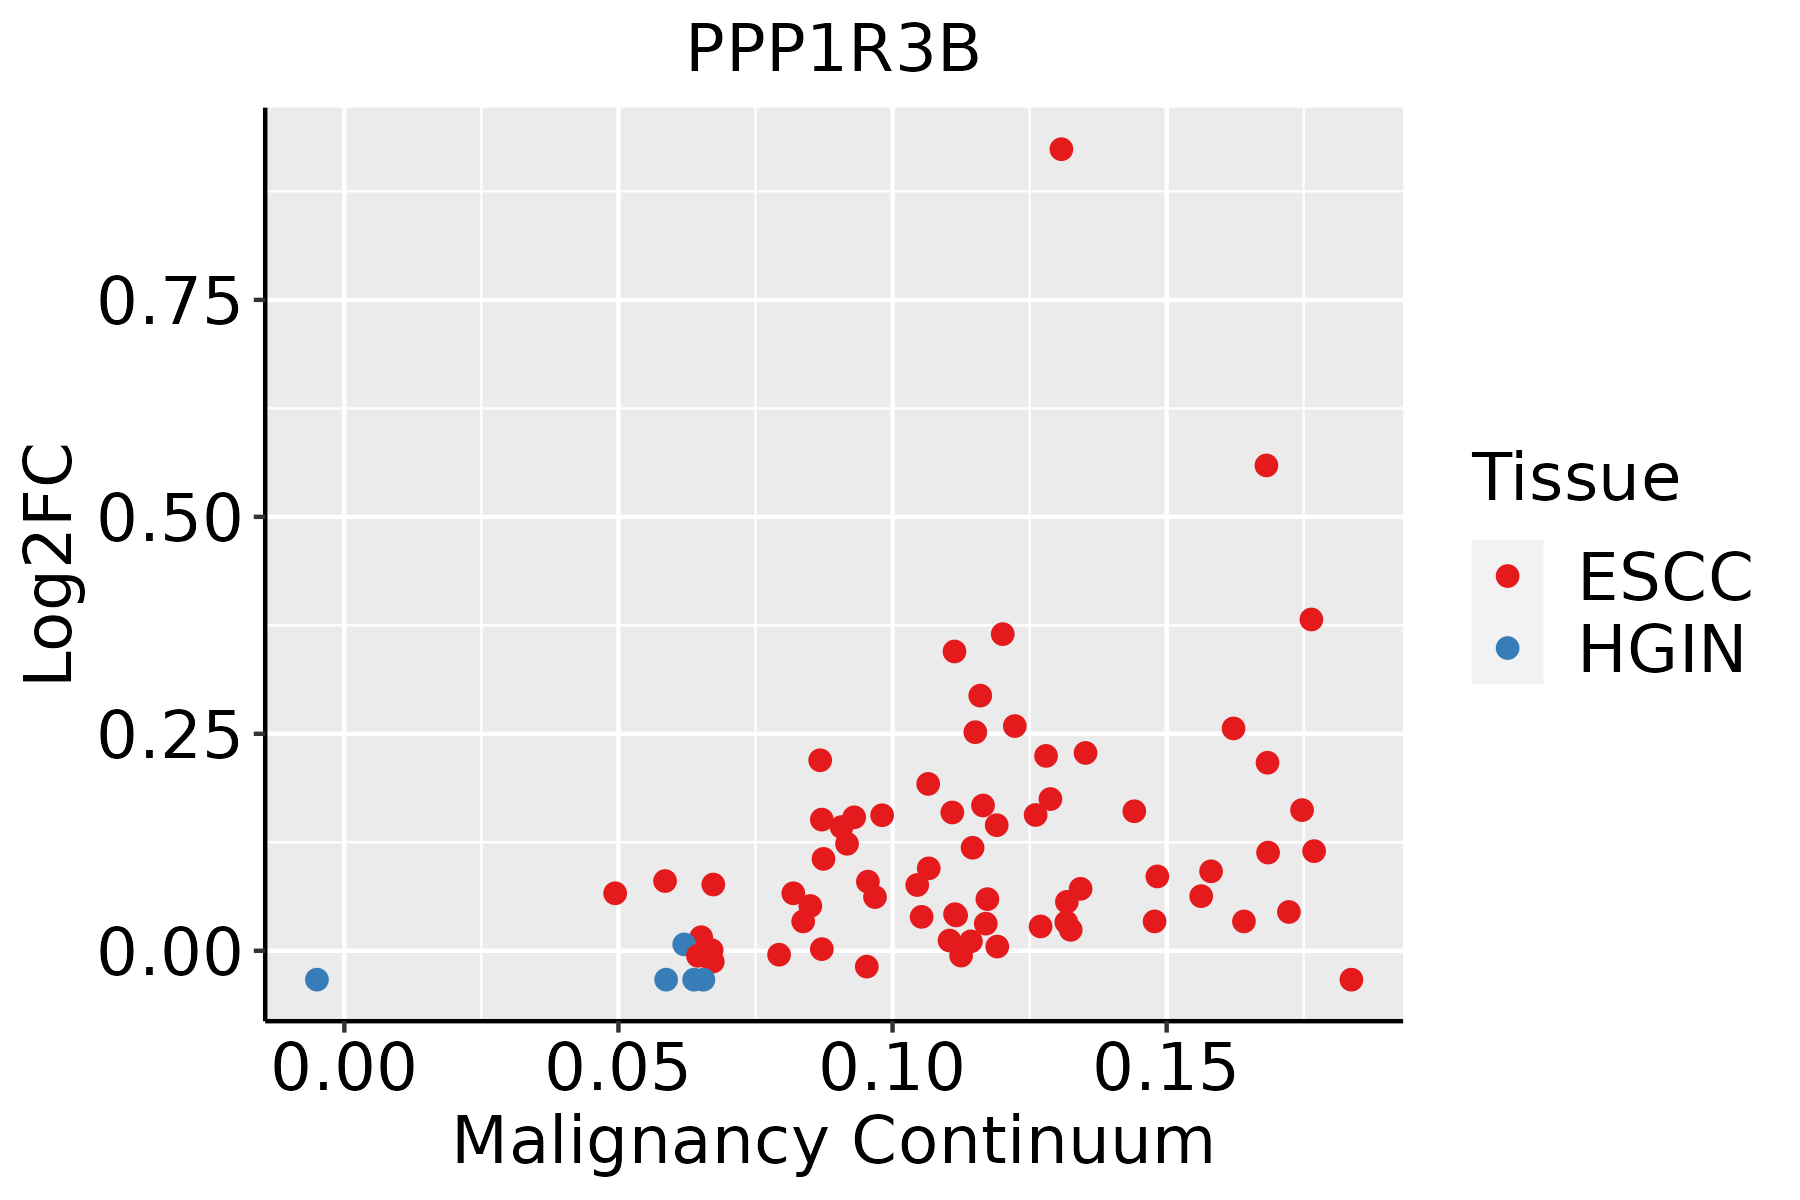 | ESCC: Esophageal squamous cell carcinoma |
| HGIN: High-grade intraepithelial neoplasias | ||
| LGIN: Low-grade intraepithelial neoplasias | ||
| Liver | 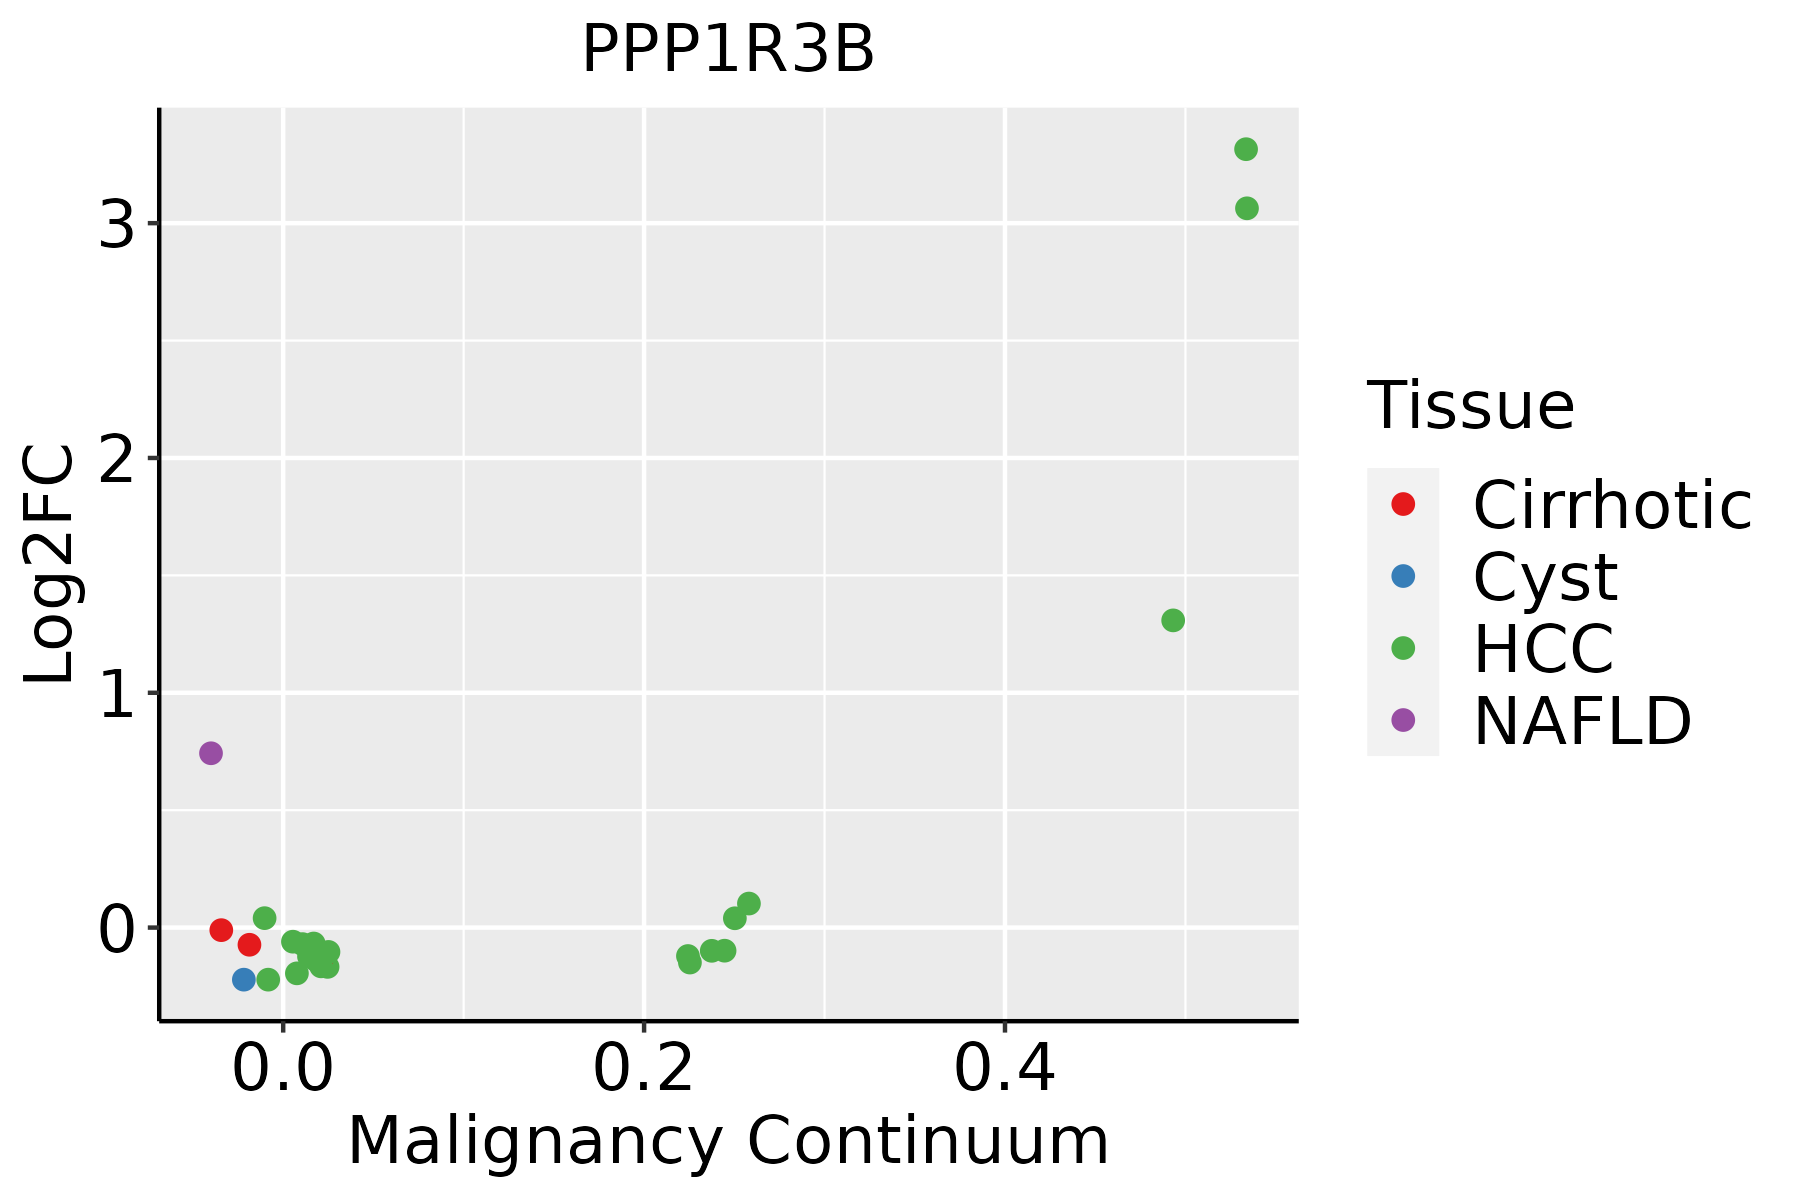 | HCC: Hepatocellular carcinoma |
| NAFLD: Non-alcoholic fatty liver disease | ||
| Thyroid | 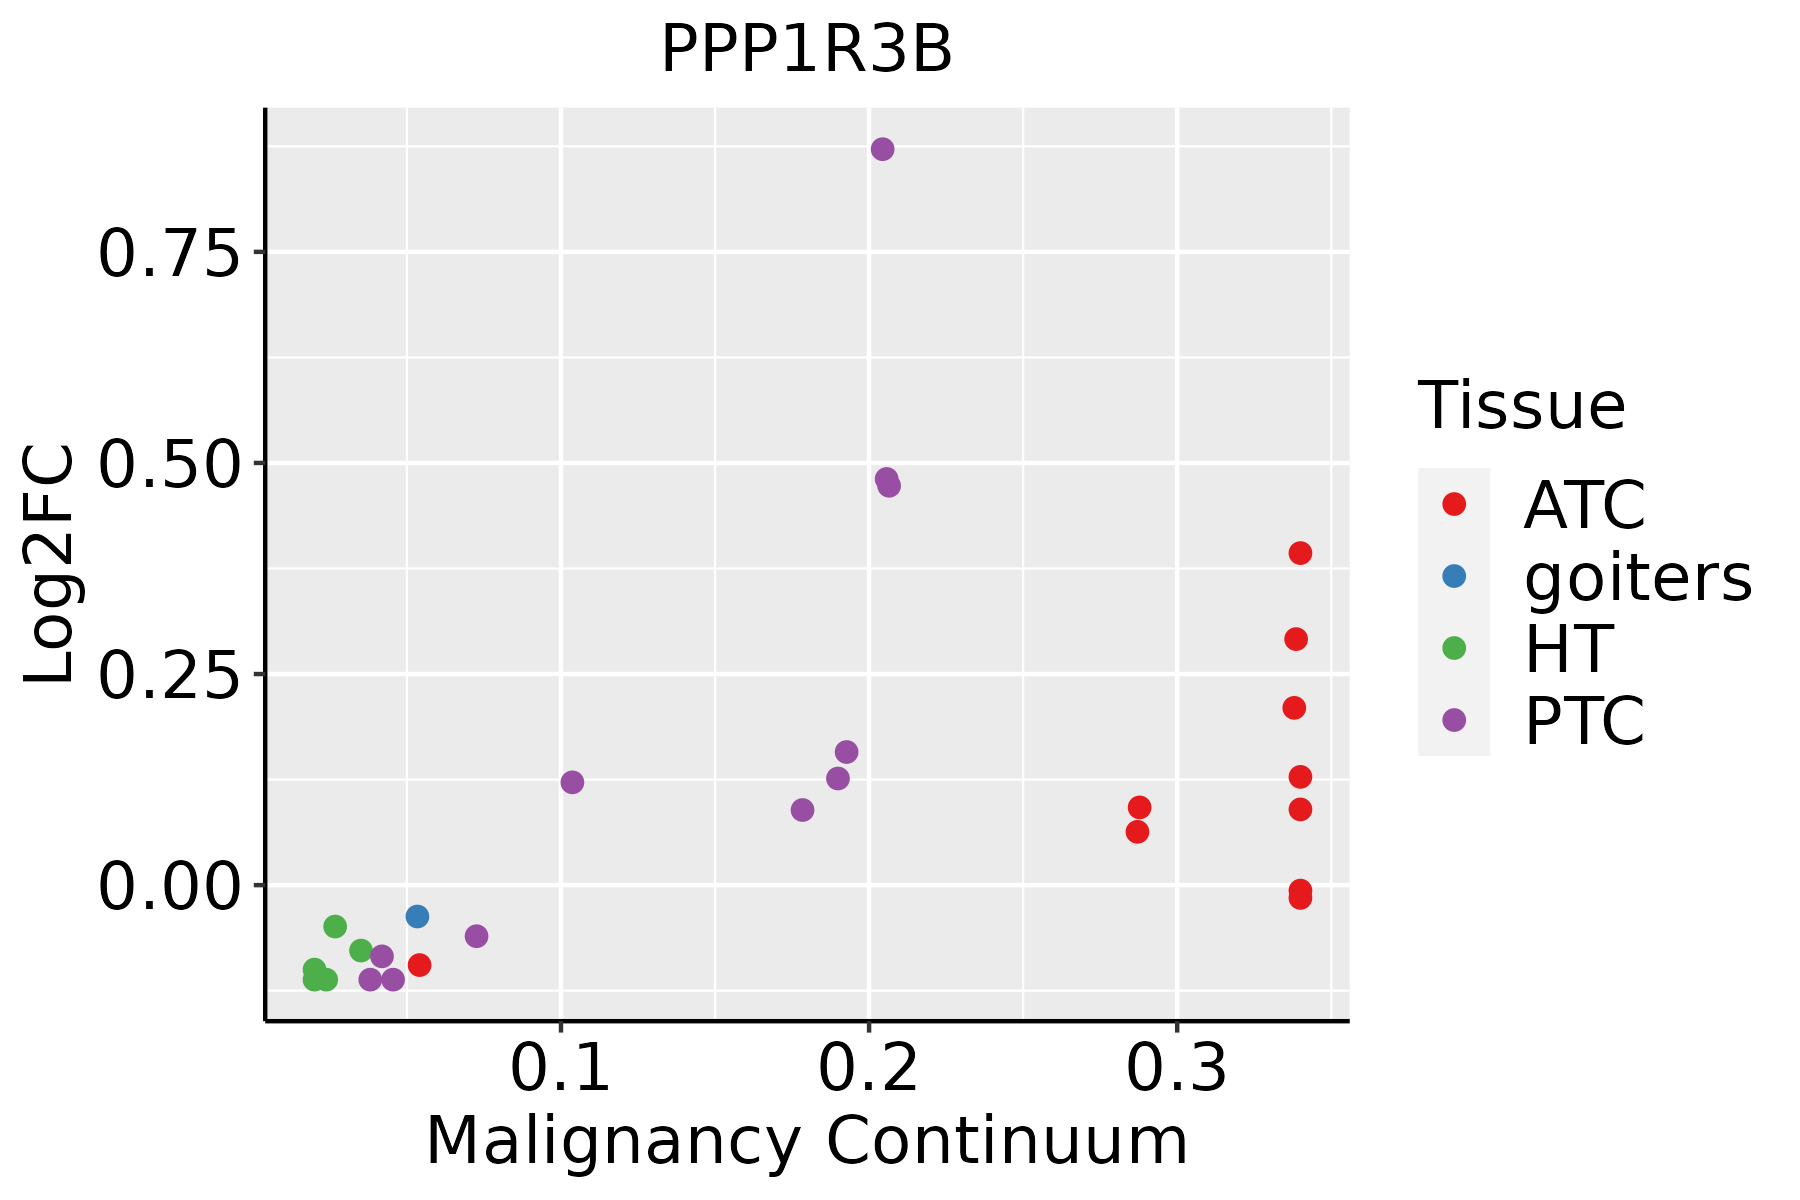 | ATC: Anaplastic thyroid cancer |
| HT: Hashimoto's thyroiditis | ||
| PTC: Papillary thyroid cancer |
| ∗log2FC in expression of this searched gene in stem-like cells from each diseased tissue sample relative to stem-like cells in normal samples in each tissue plotted against the malignancy continuum. Samples are colored based on if they are from different disease stage. |
Top |
Malignant transformation related pathway analysis |
| Find out the enriched GO biological processes and KEGG pathways involved in transition from healthy to precancer to cancer |
| Tissue | Disease Stage | Enriched GO biological Processes |
| Colorectum | AD |  |
| Colorectum | SER |  |
| Colorectum | MSS |  |
| Colorectum | MSI-H |  |
| Colorectum | FAP |  |
| ∗Top 15 enriched GO BP terms are showed in the bar plot of each disease state in each tissue. Each row represents a significant GO biological process which is colored according to the -log10(p.adjust). |
| Page: 1 2 3 4 5 6 7 8 9 |
| GO ID | Tissue | Disease Stage | Description | Gene Ratio | Bg Ratio | pvalue | p.adjust | Count |
| GO:0006091110 | Esophagus | ESCC | generation of precursor metabolites and energy | 331/8552 | 490/18723 | 3.86e-23 | 8.45e-21 | 331 |
| GO:0015980110 | Esophagus | ESCC | energy derivation by oxidation of organic compounds | 220/8552 | 318/18723 | 1.20e-17 | 1.09e-15 | 220 |
| GO:001631110 | Esophagus | ESCC | dephosphorylation | 251/8552 | 417/18723 | 1.26e-09 | 2.99e-08 | 251 |
| GO:000647018 | Esophagus | ESCC | protein dephosphorylation | 177/8552 | 281/18723 | 3.13e-09 | 6.72e-08 | 177 |
| GO:00059969 | Esophagus | ESCC | monosaccharide metabolic process | 159/8552 | 257/18723 | 1.11e-07 | 1.81e-06 | 159 |
| GO:00193189 | Esophagus | ESCC | hexose metabolic process | 147/8552 | 237/18723 | 2.63e-07 | 3.94e-06 | 147 |
| GO:00060069 | Esophagus | ESCC | glucose metabolic process | 119/8552 | 196/18723 | 1.51e-05 | 1.36e-04 | 119 |
| GO:004346719 | Esophagus | ESCC | regulation of generation of precursor metabolites and energy | 81/8552 | 130/18723 | 9.58e-05 | 6.81e-04 | 81 |
| GO:00442626 | Esophagus | ESCC | cellular carbohydrate metabolic process | 160/8552 | 283/18723 | 1.43e-04 | 9.66e-04 | 160 |
| GO:00160514 | Esophagus | ESCC | carbohydrate biosynthetic process | 117/8552 | 202/18723 | 2.96e-04 | 1.79e-03 | 117 |
| GO:00620129 | Esophagus | ESCC | regulation of small molecule metabolic process | 184/8552 | 334/18723 | 3.11e-04 | 1.85e-03 | 184 |
| GO:001605216 | Esophagus | ESCC | carbohydrate catabolic process | 91/8552 | 154/18723 | 5.39e-04 | 2.97e-03 | 91 |
| GO:00434713 | Esophagus | ESCC | regulation of cellular carbohydrate catabolic process | 11/8552 | 12/18723 | 1.26e-03 | 6.06e-03 | 11 |
| GO:00109065 | Esophagus | ESCC | regulation of glucose metabolic process | 71/8552 | 119/18723 | 1.46e-03 | 6.92e-03 | 71 |
| GO:00061096 | Esophagus | ESCC | regulation of carbohydrate metabolic process | 101/8552 | 178/18723 | 1.89e-03 | 8.52e-03 | 101 |
| GO:00106755 | Esophagus | ESCC | regulation of cellular carbohydrate metabolic process | 83/8552 | 146/18723 | 4.24e-03 | 1.69e-02 | 83 |
| GO:00442751 | Esophagus | ESCC | cellular carbohydrate catabolic process | 27/8552 | 40/18723 | 4.39e-03 | 1.73e-02 | 27 |
| GO:004347010 | Esophagus | ESCC | regulation of carbohydrate catabolic process | 35/8552 | 56/18723 | 8.30e-03 | 2.94e-02 | 35 |
| GO:00346372 | Esophagus | ESCC | cellular carbohydrate biosynthetic process | 46/8552 | 78/18723 | 1.24e-02 | 4.13e-02 | 46 |
| GO:00059965 | Liver | NAFLD | monosaccharide metabolic process | 53/1882 | 257/18723 | 2.89e-07 | 1.92e-05 | 53 |
| Page: 1 2 3 4 5 6 7 |
| Pathway ID | Tissue | Disease Stage | Description | Gene Ratio | Bg Ratio | pvalue | p.adjust | qvalue | Count |
| hsa049109 | Esophagus | ESCC | Insulin signaling pathway | 89/4205 | 137/8465 | 1.97e-04 | 7.32e-04 | 3.75e-04 | 89 |
| hsa049318 | Esophagus | ESCC | Insulin resistance | 69/4205 | 108/8465 | 1.92e-03 | 5.54e-03 | 2.84e-03 | 69 |
| hsa0491014 | Esophagus | ESCC | Insulin signaling pathway | 89/4205 | 137/8465 | 1.97e-04 | 7.32e-04 | 3.75e-04 | 89 |
| hsa0493113 | Esophagus | ESCC | Insulin resistance | 69/4205 | 108/8465 | 1.92e-03 | 5.54e-03 | 2.84e-03 | 69 |
| hsa049316 | Liver | NAFLD | Insulin resistance | 29/1043 | 108/8465 | 3.01e-05 | 7.59e-04 | 6.11e-04 | 29 |
| hsa049106 | Liver | NAFLD | Insulin signaling pathway | 29/1043 | 137/8465 | 2.23e-03 | 2.46e-02 | 1.99e-02 | 29 |
| hsa0493111 | Liver | NAFLD | Insulin resistance | 29/1043 | 108/8465 | 3.01e-05 | 7.59e-04 | 6.11e-04 | 29 |
| hsa0491011 | Liver | NAFLD | Insulin signaling pathway | 29/1043 | 137/8465 | 2.23e-03 | 2.46e-02 | 1.99e-02 | 29 |
| hsa0491021 | Liver | Cirrhotic | Insulin signaling pathway | 56/2530 | 137/8465 | 3.74e-03 | 1.50e-02 | 9.26e-03 | 56 |
| hsa0491031 | Liver | Cirrhotic | Insulin signaling pathway | 56/2530 | 137/8465 | 3.74e-03 | 1.50e-02 | 9.26e-03 | 56 |
| hsa0491041 | Liver | HCC | Insulin signaling pathway | 95/4020 | 137/8465 | 1.53e-07 | 1.97e-06 | 1.10e-06 | 95 |
| hsa0493121 | Liver | HCC | Insulin resistance | 77/4020 | 108/8465 | 3.89e-07 | 4.46e-06 | 2.48e-06 | 77 |
| hsa0491051 | Liver | HCC | Insulin signaling pathway | 95/4020 | 137/8465 | 1.53e-07 | 1.97e-06 | 1.10e-06 | 95 |
| hsa0493131 | Liver | HCC | Insulin resistance | 77/4020 | 108/8465 | 3.89e-07 | 4.46e-06 | 2.48e-06 | 77 |
| Page: 1 |
Top |
Cell-cell communication analysis |
| Identification of potential cell-cell interactions between two cell types and their ligand-receptor pairs for different disease states |
| Ligand | Receptor | LRpair | Pathway | Tissue | Disease Stage |
| Page: 1 |
Top |
Single-cell gene regulatory network inference analysis |
| Find out the significant the regulons (TFs) and the target genes of each regulon across cell types for different disease states |
| TF | Cell Type | Tissue | Disease Stage | Target Gene | RSS | Regulon Activity |
| ∗The dot plots of a searched regulon are shown for all cell subpopulations in each disease state of each tissue based on the regulon specific score inferred using pySCENIC and by calculating the average expression. |
| Page: 1 |
Top |
Somatic mutation of malignant transformation related genes |
| Annotation of somatic variants for genes involved in malignant transformation |
| Hugo Symbol | Variant Class | Variant Classification | dbSNP RS | HGVSc | HGVSp | HGVSp Short | SWISSPROT | BIOTYPE | SIFT | PolyPhen | Tumor Sample Barcode | Tissue | Histology | Sex | Age | Stage | Therapy Types | Drugs | Outcome |
| PPP1R3B | SNV | Missense_Mutation | c.788G>T | p.Arg263Leu | p.R263L | Q86XI6 | protein_coding | deleterious(0.02) | benign(0.171) | TCGA-AN-A0AK-01 | Breast | breast invasive carcinoma | Female | >=65 | I/II | Unknown | Unknown | SD | |
| PPP1R3B | SNV | Missense_Mutation | novel | c.286C>A | p.Leu96Ile | p.L96I | Q86XI6 | protein_coding | tolerated(0.49) | benign(0.007) | TCGA-VS-A94X-01 | Cervix | cervical & endocervical cancer | Female | <65 | I/II | Chemotherapy | cisplatin | PD |
| PPP1R3B | SNV | Missense_Mutation | novel | c.389N>T | p.Ala130Val | p.A130V | Q86XI6 | protein_coding | tolerated(0.1) | benign(0.014) | TCGA-AA-3947-01 | Colorectum | colon adenocarcinoma | Female | <65 | I/II | Unknown | Unknown | SD |
| PPP1R3B | SNV | Missense_Mutation | rs368157445 | c.397N>A | p.Val133Ile | p.V133I | Q86XI6 | protein_coding | deleterious(0.03) | probably_damaging(0.993) | TCGA-AA-A01R-01 | Colorectum | colon adenocarcinoma | Male | <65 | III/IV | Chemotherapy | 5-fluorouracil | PD |
| PPP1R3B | SNV | Missense_Mutation | novel | c.380G>A | p.Arg127Gln | p.R127Q | Q86XI6 | protein_coding | deleterious(0.01) | benign(0.154) | TCGA-A5-A0G2-01 | Endometrium | uterine corpus endometrioid carcinoma | Female | <65 | III/IV | Unknown | Unknown | SD |
| PPP1R3B | SNV | Missense_Mutation | rs567890001 | c.239N>T | p.Ser80Leu | p.S80L | Q86XI6 | protein_coding | deleterious(0) | possibly_damaging(0.9) | TCGA-A5-A3LP-01 | Endometrium | uterine corpus endometrioid carcinoma | Female | >=65 | I/II | Chemotherapy | carboplatin | CR |
| PPP1R3B | SNV | Missense_Mutation | novel | c.382N>T | p.Leu128Phe | p.L128F | Q86XI6 | protein_coding | tolerated(0.14) | probably_damaging(0.991) | TCGA-AP-A059-01 | Endometrium | uterine corpus endometrioid carcinoma | Female | >=65 | I/II | Unknown | Unknown | SD |
| PPP1R3B | SNV | Missense_Mutation | c.832T>C | p.Tyr278His | p.Y278H | Q86XI6 | protein_coding | tolerated(0.16) | benign(0.118) | TCGA-B5-A0JY-01 | Endometrium | uterine corpus endometrioid carcinoma | Female | <65 | III/IV | Chemotherapy | doxorubicin | SD | |
| PPP1R3B | SNV | Missense_Mutation | rs567890001 | c.239N>T | p.Ser80Leu | p.S80L | Q86XI6 | protein_coding | deleterious(0) | possibly_damaging(0.9) | TCGA-B5-A11S-01 | Endometrium | uterine corpus endometrioid carcinoma | Female | <65 | I/II | Unknown | Unknown | PD |
| PPP1R3B | SNV | Missense_Mutation | novel | c.704C>A | p.Ala235Asp | p.A235D | Q86XI6 | protein_coding | deleterious(0.03) | benign(0.1) | TCGA-B5-A3FC-01 | Endometrium | uterine corpus endometrioid carcinoma | Female | <65 | I/II | Unknown | Unknown | SD |
| Page: 1 2 3 |
Top |
Related drugs of malignant transformation related genes |
| Identification of chemicals and drugs interact with genes involved in malignant transfromation |
| (DGIdb 4.0) |
| Entrez ID | Symbol | Category | Interaction Types | Drug Claim Name | Drug Name | PMIDs |
| Page: 1 |

Copyright 2023-Present -The University of Texas Health Science Center at Houston |