
|
|||||
|
 | |
| |
| |
| |
| |
| |
|
Gene: PPP1R21 |
Gene summary for PPP1R21 |
| Gene information | Species | Human | Gene symbol | PPP1R21 | Gene ID | 129285 |
| Gene name | protein phosphatase 1 regulatory subunit 21 | |
| Gene Alias | CCDC128 | |
| Cytomap | 2p16.3 | |
| Gene Type | protein-coding | GO ID | GO:0005575 | UniProtAcc | Q6ZMI0 |
Top |
Malignant transformation analysis |
| Identification of the aberrant gene expression in precancerous and cancerous lesions by comparing the gene expression of stem-like cells in diseased tissues with normal stem cells |
| Entrez ID | Symbol | Replicates | Species | Organ | Tissue | Adj P-value | Log2FC | Malignancy |
| 129285 | PPP1R21 | CCI_1 | Human | Cervix | CC | 3.54e-06 | 6.58e-01 | 0.528 |
| 129285 | PPP1R21 | CCI_2 | Human | Cervix | CC | 9.81e-04 | 5.53e-01 | 0.5249 |
| 129285 | PPP1R21 | CCI_3 | Human | Cervix | CC | 4.27e-09 | 6.95e-01 | 0.516 |
| 129285 | PPP1R21 | LZE2T | Human | Esophagus | ESCC | 6.86e-03 | 3.18e-01 | 0.082 |
| 129285 | PPP1R21 | LZE4T | Human | Esophagus | ESCC | 1.25e-11 | 4.05e-01 | 0.0811 |
| 129285 | PPP1R21 | LZE7T | Human | Esophagus | ESCC | 1.60e-08 | 3.39e-01 | 0.0667 |
| 129285 | PPP1R21 | LZE8T | Human | Esophagus | ESCC | 6.27e-04 | 1.00e-01 | 0.067 |
| 129285 | PPP1R21 | LZE20T | Human | Esophagus | ESCC | 2.63e-03 | 1.64e-01 | 0.0662 |
| 129285 | PPP1R21 | LZE22T | Human | Esophagus | ESCC | 1.43e-03 | 2.64e-01 | 0.068 |
| 129285 | PPP1R21 | LZE24T | Human | Esophagus | ESCC | 2.68e-14 | 4.23e-01 | 0.0596 |
| 129285 | PPP1R21 | LZE21T | Human | Esophagus | ESCC | 4.48e-06 | 3.21e-01 | 0.0655 |
| 129285 | PPP1R21 | P1T-E | Human | Esophagus | ESCC | 3.10e-10 | 5.11e-01 | 0.0875 |
| 129285 | PPP1R21 | P2T-E | Human | Esophagus | ESCC | 1.32e-23 | 3.97e-01 | 0.1177 |
| 129285 | PPP1R21 | P4T-E | Human | Esophagus | ESCC | 3.97e-13 | 4.10e-01 | 0.1323 |
| 129285 | PPP1R21 | P5T-E | Human | Esophagus | ESCC | 3.26e-27 | 4.41e-01 | 0.1327 |
| 129285 | PPP1R21 | P8T-E | Human | Esophagus | ESCC | 1.97e-13 | 2.19e-01 | 0.0889 |
| 129285 | PPP1R21 | P9T-E | Human | Esophagus | ESCC | 5.76e-04 | 1.51e-01 | 0.1131 |
| 129285 | PPP1R21 | P10T-E | Human | Esophagus | ESCC | 2.37e-24 | 3.23e-01 | 0.116 |
| 129285 | PPP1R21 | P11T-E | Human | Esophagus | ESCC | 1.26e-06 | 2.36e-01 | 0.1426 |
| 129285 | PPP1R21 | P12T-E | Human | Esophagus | ESCC | 5.88e-17 | 2.68e-01 | 0.1122 |
| Page: 1 2 3 4 |
| Tissue | Expression Dynamics | Abbreviation |
| Cervix | 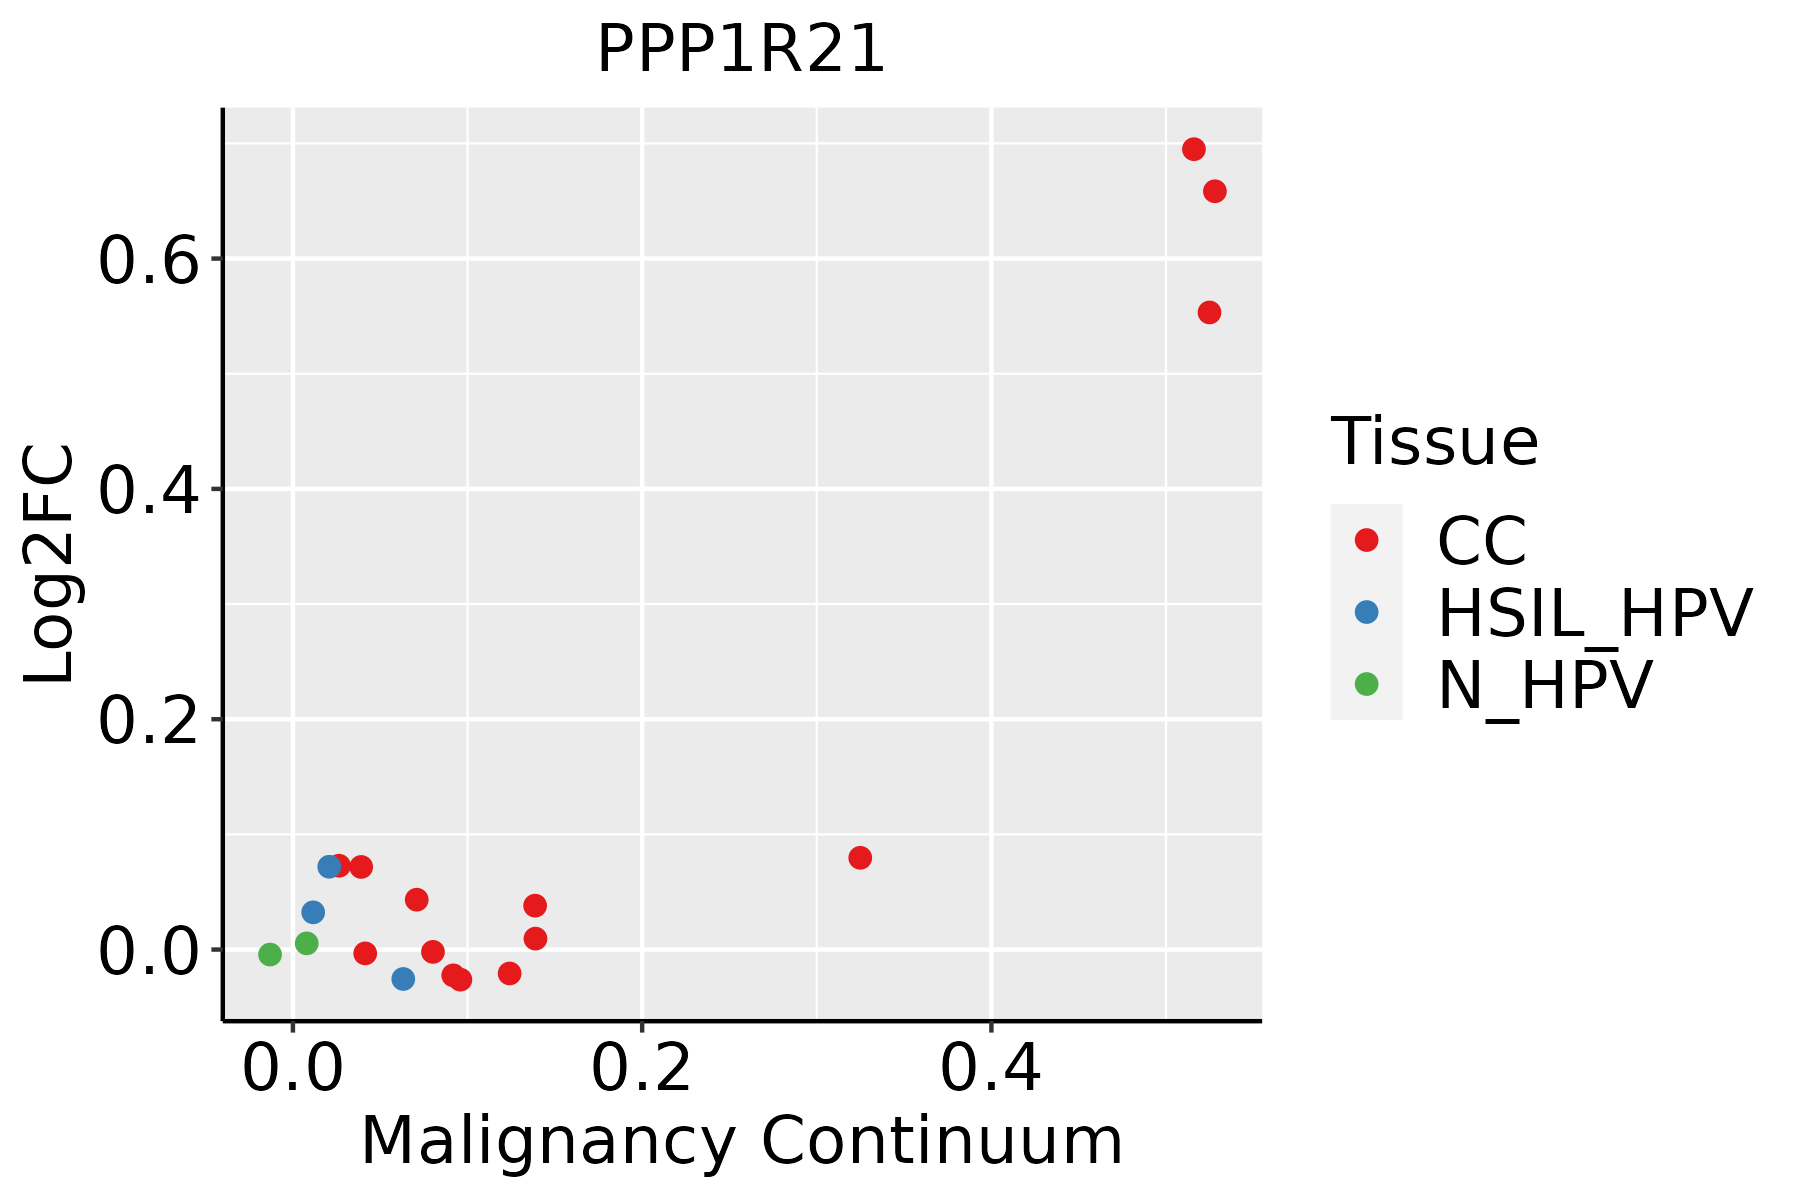 | CC: Cervix cancer |
| HSIL_HPV: HPV-infected high-grade squamous intraepithelial lesions | ||
| N_HPV: HPV-infected normal cervix | ||
| Esophagus | 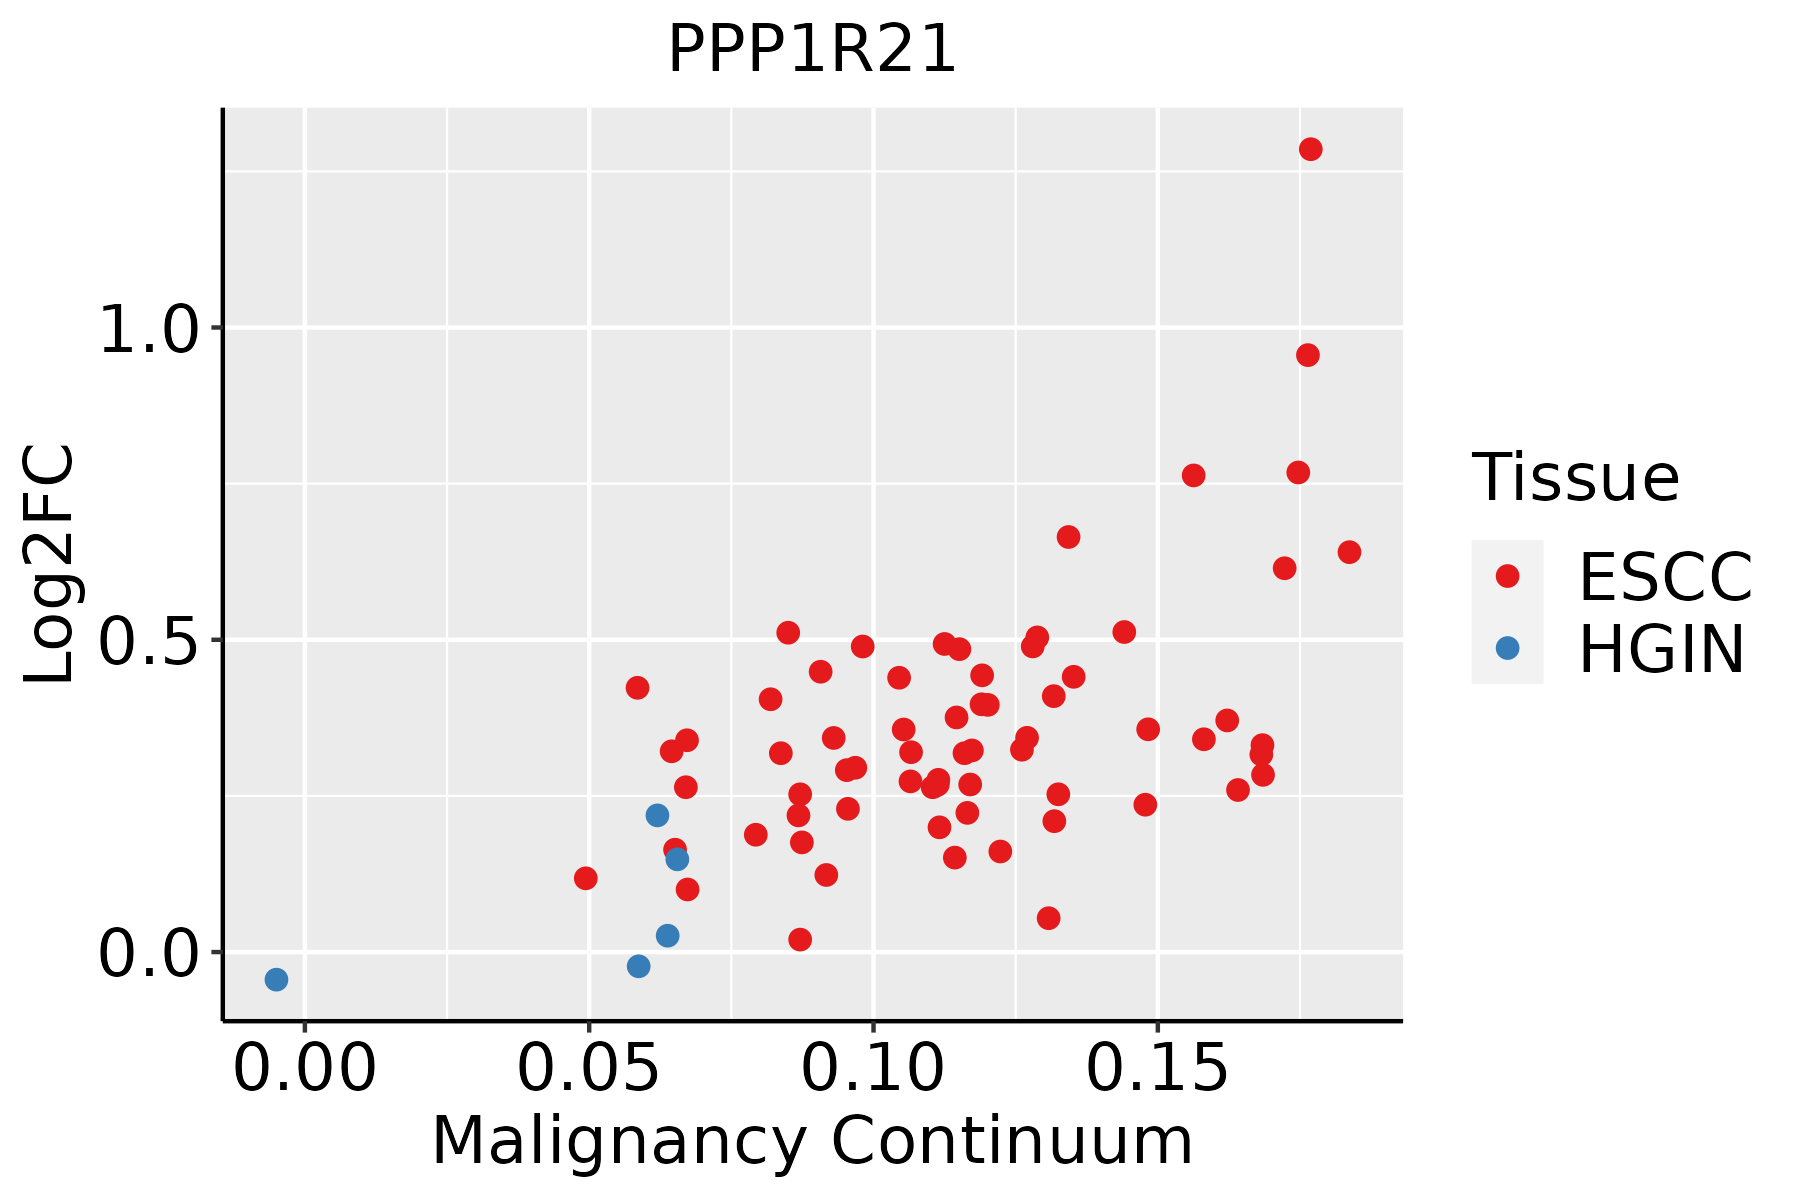 | ESCC: Esophageal squamous cell carcinoma |
| HGIN: High-grade intraepithelial neoplasias | ||
| LGIN: Low-grade intraepithelial neoplasias | ||
| Liver | 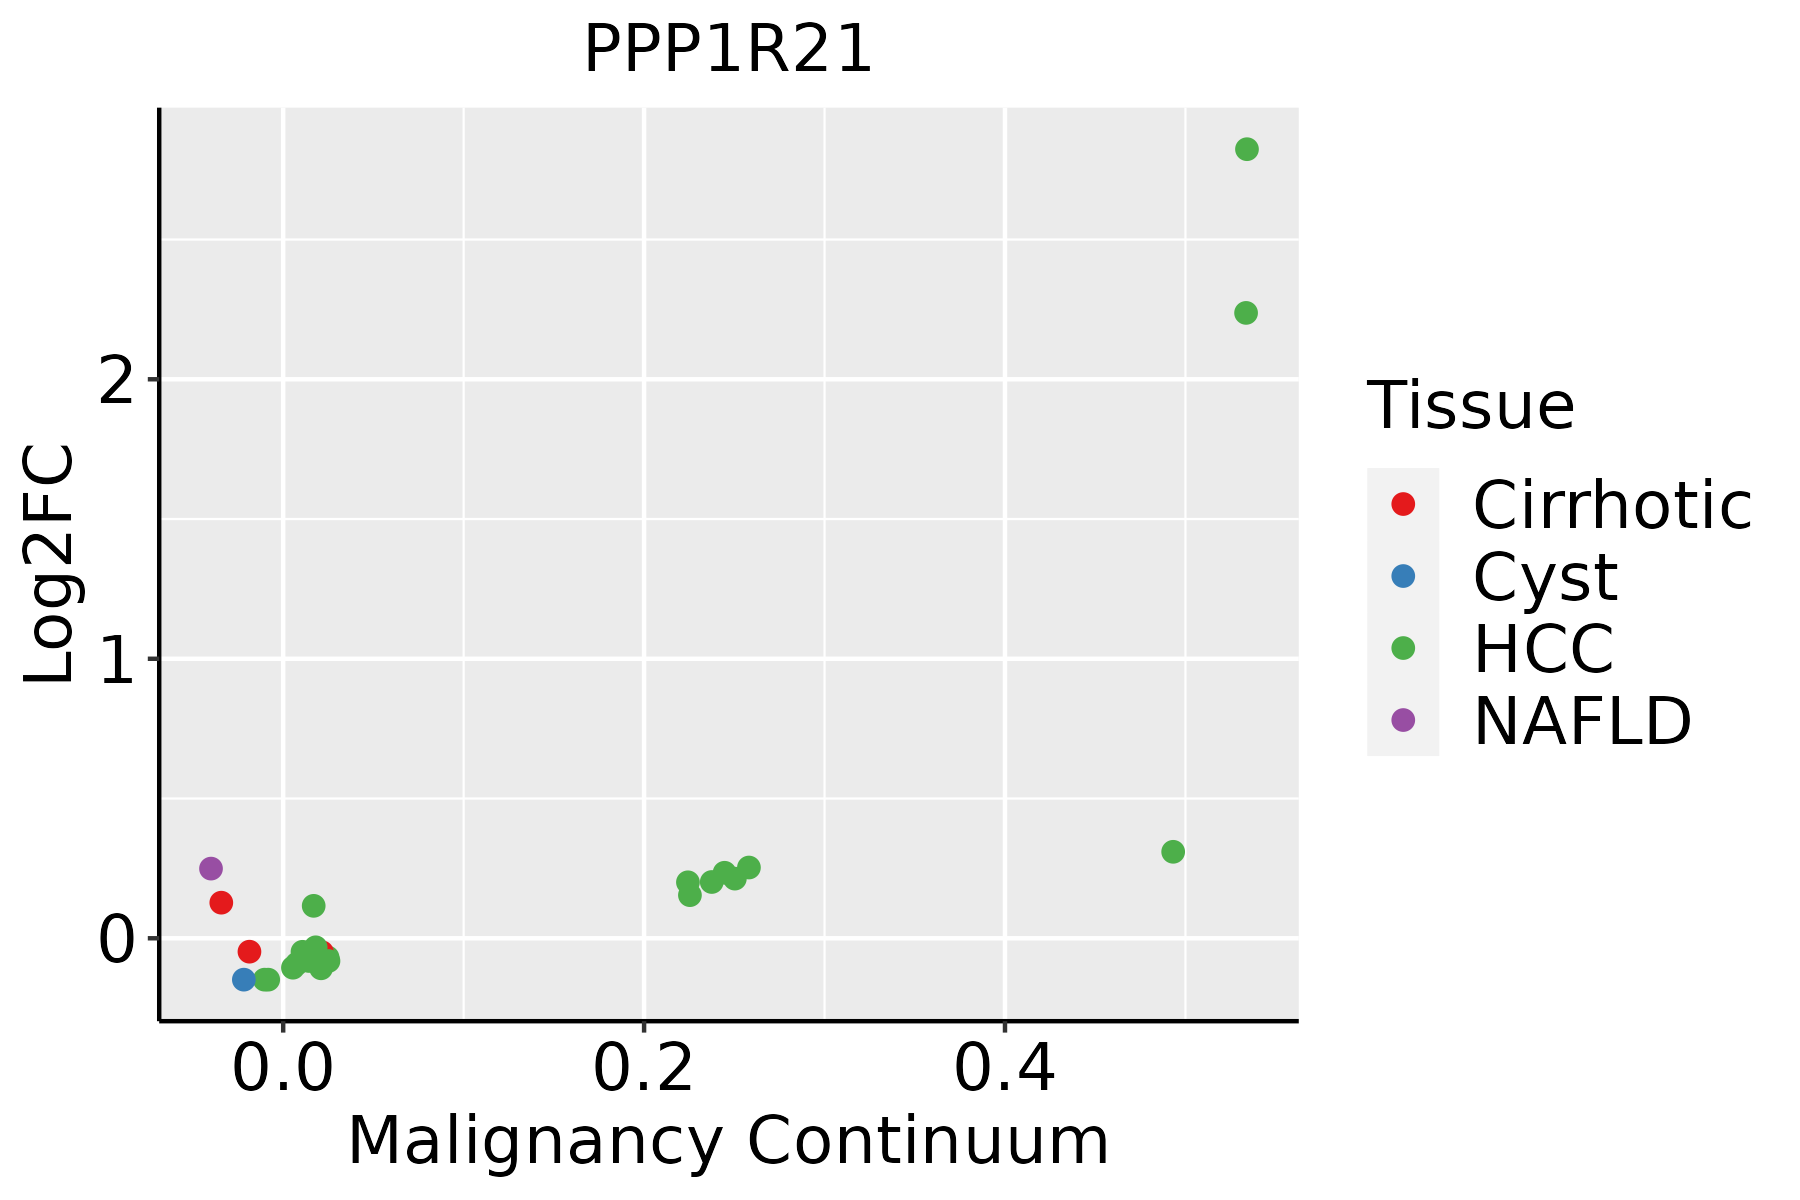 | HCC: Hepatocellular carcinoma |
| NAFLD: Non-alcoholic fatty liver disease |
| ∗log2FC in expression of this searched gene in stem-like cells from each diseased tissue sample relative to stem-like cells in normal samples in each tissue plotted against the malignancy continuum. Samples are colored based on if they are from different disease stage. |
Top |
Malignant transformation related pathway analysis |
| Find out the enriched GO biological processes and KEGG pathways involved in transition from healthy to precancer to cancer |
| Tissue | Disease Stage | Enriched GO biological Processes |
| Colorectum | AD |  |
| Colorectum | SER |  |
| Colorectum | MSS |  |
| Colorectum | MSI-H |  |
| Colorectum | FAP |  |
| ∗Top 15 enriched GO BP terms are showed in the bar plot of each disease state in each tissue. Each row represents a significant GO biological process which is colored according to the -log10(p.adjust). |
| Page: 1 2 3 4 5 6 7 8 9 |
| GO ID | Tissue | Disease Stage | Description | Gene Ratio | Bg Ratio | pvalue | p.adjust | Count |
| Page: 1 |
| Pathway ID | Tissue | Disease Stage | Description | Gene Ratio | Bg Ratio | pvalue | p.adjust | qvalue | Count |
| Page: 1 |
Top |
Cell-cell communication analysis |
| Identification of potential cell-cell interactions between two cell types and their ligand-receptor pairs for different disease states |
| Ligand | Receptor | LRpair | Pathway | Tissue | Disease Stage |
| Page: 1 |
Top |
Single-cell gene regulatory network inference analysis |
| Find out the significant the regulons (TFs) and the target genes of each regulon across cell types for different disease states |
| TF | Cell Type | Tissue | Disease Stage | Target Gene | RSS | Regulon Activity |
| ∗The dot plots of a searched regulon are shown for all cell subpopulations in each disease state of each tissue based on the regulon specific score inferred using pySCENIC and by calculating the average expression. |
| Page: 1 |
Top |
Somatic mutation of malignant transformation related genes |
| Annotation of somatic variants for genes involved in malignant transformation |
| Hugo Symbol | Variant Class | Variant Classification | dbSNP RS | HGVSc | HGVSp | HGVSp Short | SWISSPROT | BIOTYPE | SIFT | PolyPhen | Tumor Sample Barcode | Tissue | Histology | Sex | Age | Stage | Therapy Types | Drugs | Outcome |
| PPP1R21 | SNV | Missense_Mutation | novel | c.1988N>C | p.Arg663Pro | p.R663P | Q6ZMI0 | protein_coding | deleterious(0) | possibly_damaging(0.529) | TCGA-A2-A0ES-01 | Breast | breast invasive carcinoma | Female | <65 | I/II | Chemotherapy | docetaxel | SD |
| PPP1R21 | SNV | Missense_Mutation | novel | c.2321N>T | p.Ser774Phe | p.S774F | Q6ZMI0 | protein_coding | deleterious(0.01) | benign(0.384) | TCGA-A7-A56D-01 | Breast | breast invasive carcinoma | Female | >=65 | I/II | Hormone Therapy | arimidex | SD |
| PPP1R21 | SNV | Missense_Mutation | rs373193262 | c.1112N>G | p.Ser371Cys | p.S371C | Q6ZMI0 | protein_coding | deleterious(0.02) | probably_damaging(0.986) | TCGA-C8-A26Y-01 | Breast | breast invasive carcinoma | Female | >=65 | I/II | Unknown | Unknown | SD |
| PPP1R21 | deletion | Frame_Shift_Del | c.2204delA | p.Lys735ArgfsTer8 | p.K735Rfs*8 | Q6ZMI0 | protein_coding | TCGA-D8-A27V-01 | Breast | breast invasive carcinoma | Female | <65 | I/II | Hormone Therapy | tamoxiphen | SD | |||
| PPP1R21 | SNV | Missense_Mutation | c.1534N>G | p.Leu512Val | p.L512V | Q6ZMI0 | protein_coding | tolerated(0.48) | benign(0.003) | TCGA-Q1-A73O-01 | Cervix | cervical & endocervical cancer | Female | <65 | I/II | Chemotherapy | cisplatin | CR | |
| PPP1R21 | SNV | Missense_Mutation | novel | c.1169A>C | p.Lys390Thr | p.K390T | Q6ZMI0 | protein_coding | tolerated(0.11) | benign(0.003) | TCGA-AA-A00N-01 | Colorectum | colon adenocarcinoma | Male | >=65 | I/II | Unknown | Unknown | PD |
| PPP1R21 | SNV | Missense_Mutation | novel | c.1106N>G | p.Glu369Gly | p.E369G | Q6ZMI0 | protein_coding | tolerated(0.18) | probably_damaging(0.984) | TCGA-CA-6717-01 | Colorectum | colon adenocarcinoma | Male | <65 | I/II | Chemotherapy | oxaliplatin | CR |
| PPP1R21 | SNV | Missense_Mutation | novel | c.1764N>C | p.Leu588Phe | p.L588F | Q6ZMI0 | protein_coding | deleterious(0.01) | probably_damaging(0.999) | TCGA-CA-6717-01 | Colorectum | colon adenocarcinoma | Male | <65 | I/II | Chemotherapy | oxaliplatin | CR |
| PPP1R21 | SNV | Missense_Mutation | rs776627514 | c.758N>A | p.Arg253Gln | p.R253Q | Q6ZMI0 | protein_coding | tolerated(0.12) | probably_damaging(0.992) | TCGA-AG-A002-01 | Colorectum | rectum adenocarcinoma | Male | <65 | I/II | Unknown | Unknown | SD |
| PPP1R21 | SNV | Missense_Mutation | rs375335011 | c.2083N>A | p.Glu695Lys | p.E695K | Q6ZMI0 | protein_coding | deleterious(0) | benign(0.197) | TCGA-F5-6814-01 | Colorectum | rectum adenocarcinoma | Male | <65 | I/II | Unknown | Unknown | SD |
| Page: 1 2 3 4 5 6 7 8 |
Top |
Related drugs of malignant transformation related genes |
| Identification of chemicals and drugs interact with genes involved in malignant transfromation |
| (DGIdb 4.0) |
| Entrez ID | Symbol | Category | Interaction Types | Drug Claim Name | Drug Name | PMIDs |
| Page: 1 |

Copyright 2023-Present -The University of Texas Health Science Center at Houston |