
|
|||||
|
 | |
| |
| |
| |
| |
| |
|
Gene: PPP1R18 |
Gene summary for PPP1R18 |
| Gene information | Species | Human | Gene symbol | PPP1R18 | Gene ID | 170954 |
| Gene name | protein phosphatase 1 regulatory subunit 18 | |
| Gene Alias | HKMT1098 | |
| Cytomap | 6p21.33 | |
| Gene Type | protein-coding | GO ID | GO:0005575 | UniProtAcc | A0A024RCJ8 |
Top |
Malignant transformation analysis |
| Identification of the aberrant gene expression in precancerous and cancerous lesions by comparing the gene expression of stem-like cells in diseased tissues with normal stem cells |
| Entrez ID | Symbol | Replicates | Species | Organ | Tissue | Adj P-value | Log2FC | Malignancy |
| 170954 | PPP1R18 | LZE4T | Human | Esophagus | ESCC | 1.95e-12 | 3.44e-01 | 0.0811 |
| 170954 | PPP1R18 | LZE7T | Human | Esophagus | ESCC | 3.76e-06 | 1.58e-01 | 0.0667 |
| 170954 | PPP1R18 | LZE8T | Human | Esophagus | ESCC | 8.11e-07 | 1.57e-01 | 0.067 |
| 170954 | PPP1R18 | LZE22T | Human | Esophagus | ESCC | 1.38e-03 | 2.05e-01 | 0.068 |
| 170954 | PPP1R18 | LZE24T | Human | Esophagus | ESCC | 2.82e-09 | 8.20e-02 | 0.0596 |
| 170954 | PPP1R18 | LZE6T | Human | Esophagus | ESCC | 1.89e-11 | 7.99e-01 | 0.0845 |
| 170954 | PPP1R18 | P1T-E | Human | Esophagus | ESCC | 2.76e-02 | 2.85e-01 | 0.0875 |
| 170954 | PPP1R18 | P2T-E | Human | Esophagus | ESCC | 8.81e-31 | 7.61e-01 | 0.1177 |
| 170954 | PPP1R18 | P4T-E | Human | Esophagus | ESCC | 2.41e-14 | 1.71e-01 | 0.1323 |
| 170954 | PPP1R18 | P5T-E | Human | Esophagus | ESCC | 5.87e-18 | 3.40e-01 | 0.1327 |
| 170954 | PPP1R18 | P8T-E | Human | Esophagus | ESCC | 1.08e-04 | 7.56e-02 | 0.0889 |
| 170954 | PPP1R18 | P9T-E | Human | Esophagus | ESCC | 3.27e-23 | 2.42e-01 | 0.1131 |
| 170954 | PPP1R18 | P10T-E | Human | Esophagus | ESCC | 1.11e-09 | 1.05e-01 | 0.116 |
| 170954 | PPP1R18 | P11T-E | Human | Esophagus | ESCC | 2.98e-16 | 7.90e-01 | 0.1426 |
| 170954 | PPP1R18 | P12T-E | Human | Esophagus | ESCC | 5.24e-12 | 2.01e-01 | 0.1122 |
| 170954 | PPP1R18 | P15T-E | Human | Esophagus | ESCC | 7.52e-18 | 2.05e-01 | 0.1149 |
| 170954 | PPP1R18 | P16T-E | Human | Esophagus | ESCC | 1.07e-12 | 1.79e-01 | 0.1153 |
| 170954 | PPP1R18 | P17T-E | Human | Esophagus | ESCC | 3.49e-10 | 7.72e-01 | 0.1278 |
| 170954 | PPP1R18 | P19T-E | Human | Esophagus | ESCC | 2.51e-09 | 1.04e+00 | 0.1662 |
| 170954 | PPP1R18 | P20T-E | Human | Esophagus | ESCC | 1.32e-08 | 3.04e-01 | 0.1124 |
| Page: 1 2 3 4 5 |
| Tissue | Expression Dynamics | Abbreviation |
| Esophagus | 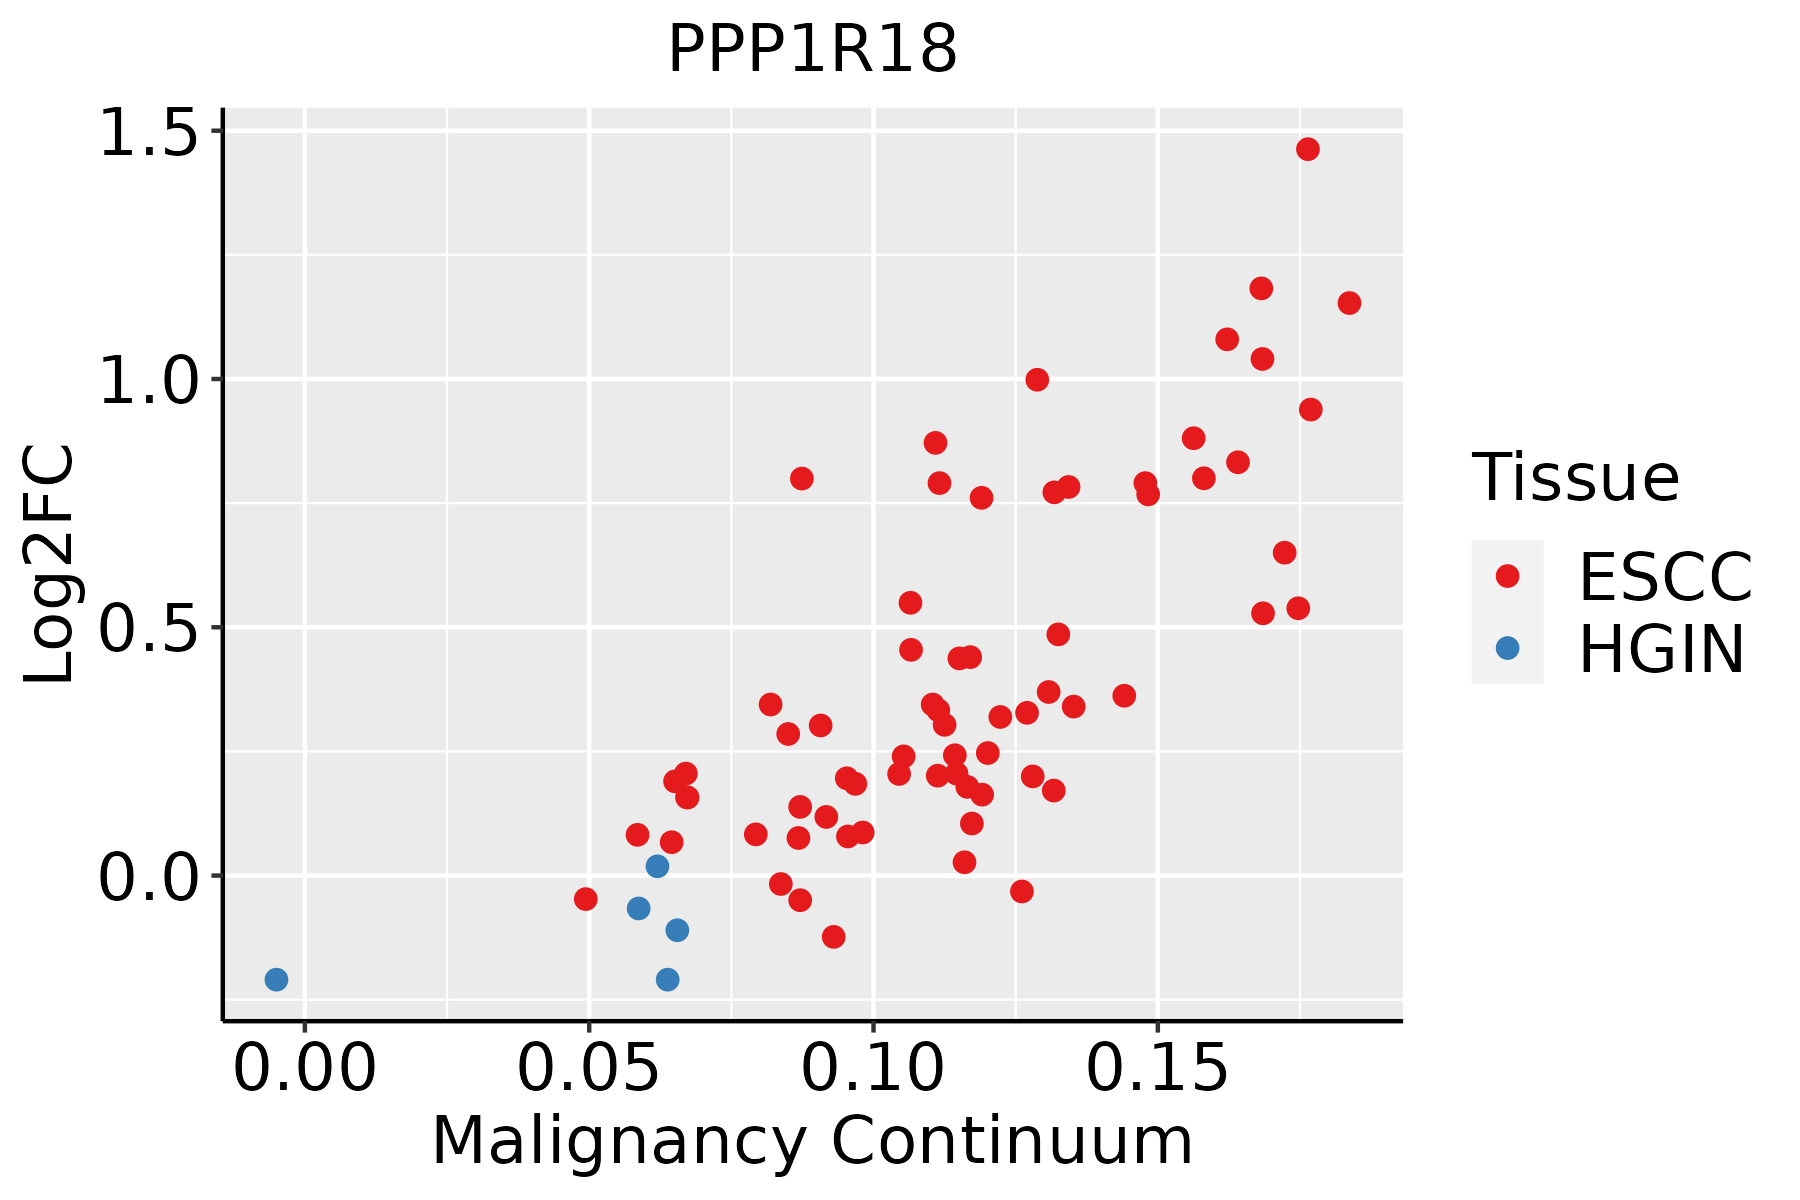 | ESCC: Esophageal squamous cell carcinoma |
| HGIN: High-grade intraepithelial neoplasias | ||
| LGIN: Low-grade intraepithelial neoplasias | ||
| Liver |  | HCC: Hepatocellular carcinoma |
| NAFLD: Non-alcoholic fatty liver disease | ||
| Oral Cavity |  | EOLP: Erosive Oral lichen planus |
| LP: leukoplakia | ||
| NEOLP: Non-erosive oral lichen planus | ||
| OSCC: Oral squamous cell carcinoma | ||
| Skin | 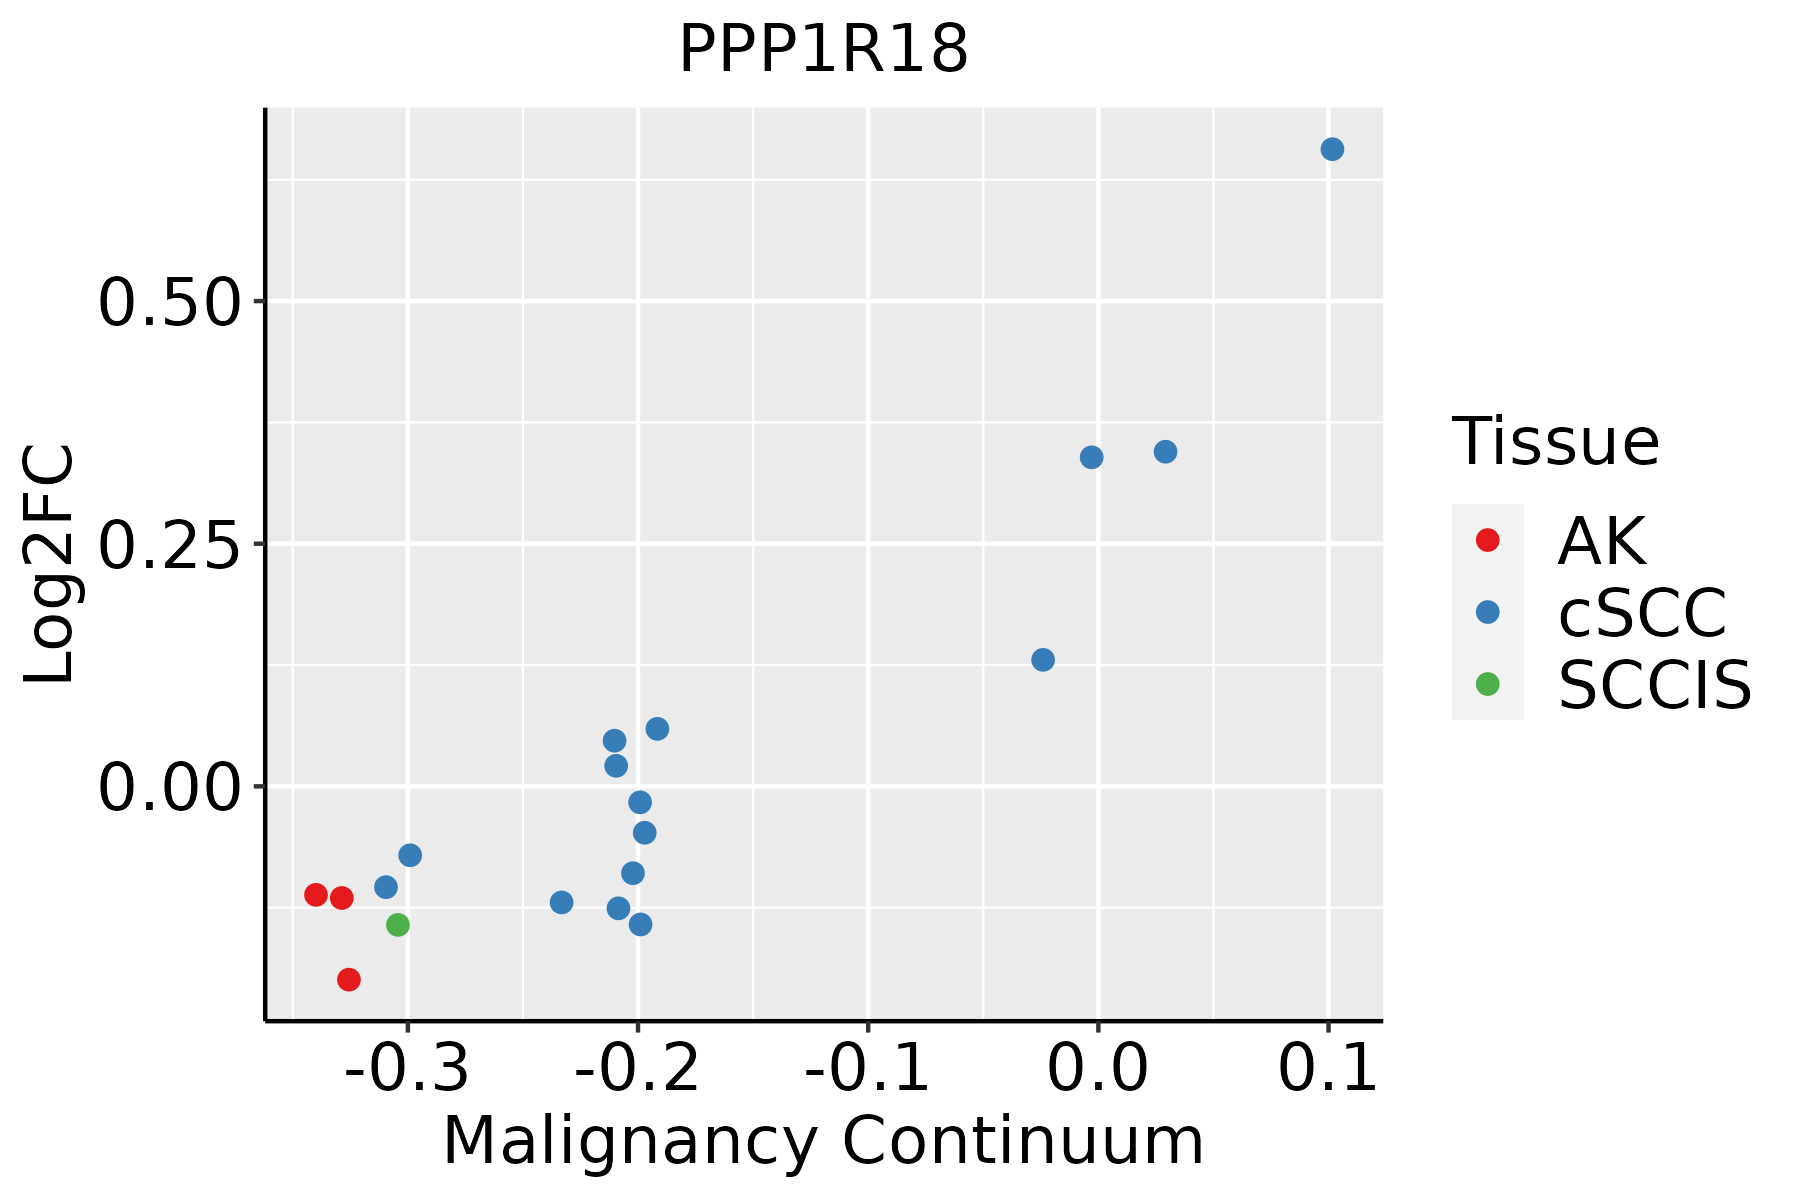 | AK: Actinic keratosis |
| cSCC: Cutaneous squamous cell carcinoma | ||
| SCCIS:squamous cell carcinoma in situ | ||
| Thyroid | 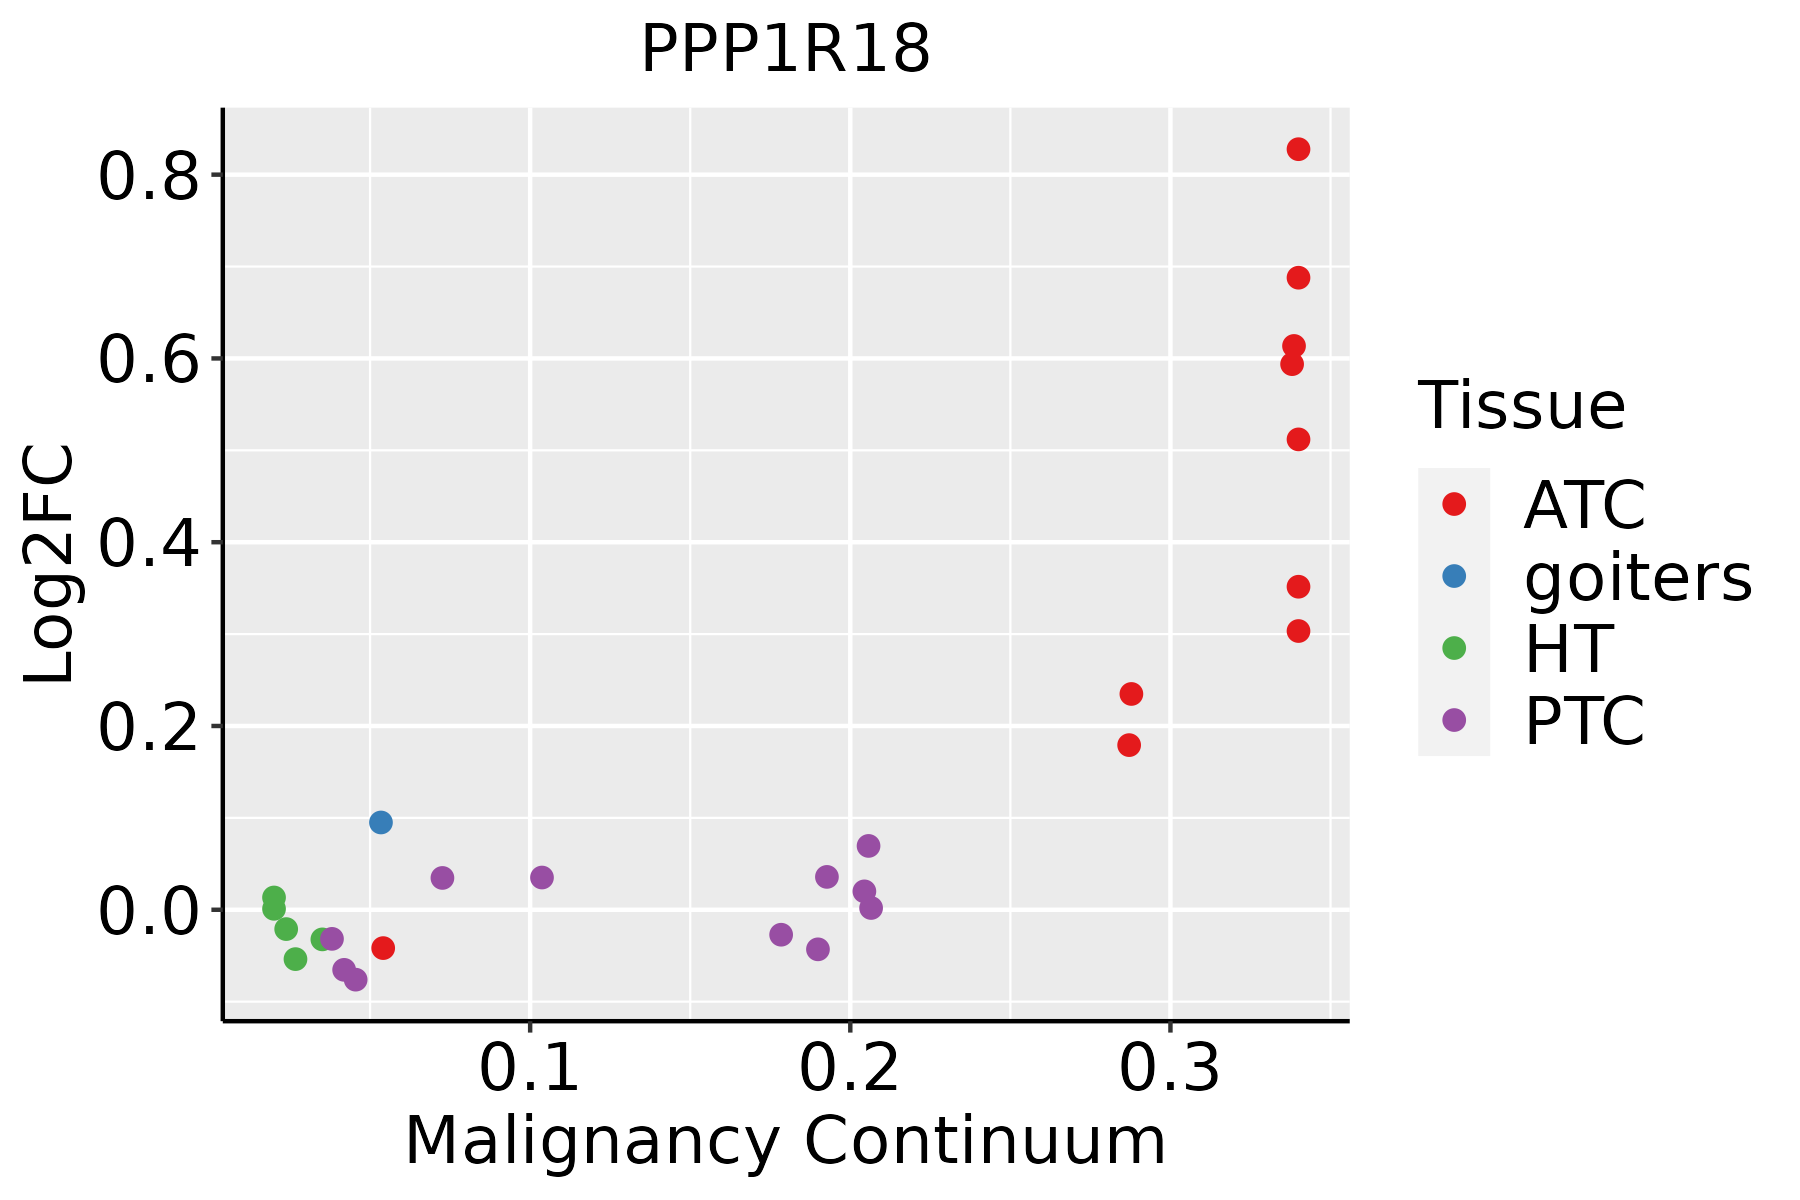 | ATC: Anaplastic thyroid cancer |
| HT: Hashimoto's thyroiditis | ||
| PTC: Papillary thyroid cancer |
| ∗log2FC in expression of this searched gene in stem-like cells from each diseased tissue sample relative to stem-like cells in normal samples in each tissue plotted against the malignancy continuum. Samples are colored based on if they are from different disease stage. |
Top |
Malignant transformation related pathway analysis |
| Find out the enriched GO biological processes and KEGG pathways involved in transition from healthy to precancer to cancer |
| Tissue | Disease Stage | Enriched GO biological Processes |
| Colorectum | AD |  |
| Colorectum | SER |  |
| Colorectum | MSS |  |
| Colorectum | MSI-H |  |
| Colorectum | FAP |  |
| ∗Top 15 enriched GO BP terms are showed in the bar plot of each disease state in each tissue. Each row represents a significant GO biological process which is colored according to the -log10(p.adjust). |
| Page: 1 2 3 4 5 6 7 8 9 |
| GO ID | Tissue | Disease Stage | Description | Gene Ratio | Bg Ratio | pvalue | p.adjust | Count |
| Page: 1 |
| Pathway ID | Tissue | Disease Stage | Description | Gene Ratio | Bg Ratio | pvalue | p.adjust | qvalue | Count |
| Page: 1 |
Top |
Cell-cell communication analysis |
| Identification of potential cell-cell interactions between two cell types and their ligand-receptor pairs for different disease states |
| Ligand | Receptor | LRpair | Pathway | Tissue | Disease Stage |
| Page: 1 |
Top |
Single-cell gene regulatory network inference analysis |
| Find out the significant the regulons (TFs) and the target genes of each regulon across cell types for different disease states |
| TF | Cell Type | Tissue | Disease Stage | Target Gene | RSS | Regulon Activity |
| ∗The dot plots of a searched regulon are shown for all cell subpopulations in each disease state of each tissue based on the regulon specific score inferred using pySCENIC and by calculating the average expression. |
| Page: 1 |
Top |
Somatic mutation of malignant transformation related genes |
| Annotation of somatic variants for genes involved in malignant transformation |
| Hugo Symbol | Variant Class | Variant Classification | dbSNP RS | HGVSc | HGVSp | HGVSp Short | SWISSPROT | BIOTYPE | SIFT | PolyPhen | Tumor Sample Barcode | Tissue | Histology | Sex | Age | Stage | Therapy Types | Drugs | Outcome |
| PPP1R18 | SNV | Missense_Mutation | novel | c.1612C>T | p.Leu538Phe | p.L538F | Q6NYC8 | protein_coding | deleterious(0) | probably_damaging(0.999) | TCGA-LL-A9Q3-01 | Breast | breast invasive carcinoma | Female | >=65 | III/IV | Immunotherapy | herceptin | CR |
| PPP1R18 | insertion | Nonsense_Mutation | novel | c.484_485insGAGACAGCCCGGGGG | p.Leu162delinsTer | p.L162delins* | Q6NYC8 | protein_coding | TCGA-DS-A1OB-01 | Cervix | cervical & endocervical cancer | Female | <65 | I/II | Chemotherapy | carboplatin | PD | ||
| PPP1R18 | deletion | Frame_Shift_Del | novel | c.793delN | p.Ser265GlnfsTer23 | p.S265Qfs*23 | Q6NYC8 | protein_coding | TCGA-DS-A1OD-01 | Cervix | cervical & endocervical cancer | Female | <65 | I/II | Chemotherapy | cisplatin | SD | ||
| PPP1R18 | SNV | Missense_Mutation | c.368N>A | p.Arg123Lys | p.R123K | Q6NYC8 | protein_coding | deleterious_low_confidence(0.04) | benign(0.006) | TCGA-AA-3672-01 | Colorectum | colon adenocarcinoma | Female | >=65 | III/IV | Unknown | Unknown | SD | |
| PPP1R18 | SNV | Missense_Mutation | rs555488215 | c.1594G>A | p.Glu532Lys | p.E532K | Q6NYC8 | protein_coding | deleterious(0.04) | probably_damaging(0.995) | TCGA-AA-A00N-01 | Colorectum | colon adenocarcinoma | Male | >=65 | I/II | Unknown | Unknown | PD |
| PPP1R18 | SNV | Missense_Mutation | c.496C>A | p.Pro166Thr | p.P166T | Q6NYC8 | protein_coding | tolerated_low_confidence(0.23) | benign(0.003) | TCGA-AM-5821-01 | Colorectum | colon adenocarcinoma | Female | >=65 | I/II | Unknown | Unknown | SD | |
| PPP1R18 | SNV | Missense_Mutation | rs775362882 | c.287N>G | p.Gln96Arg | p.Q96R | Q6NYC8 | protein_coding | tolerated(0.4) | benign(0.005) | TCGA-AU-6004-01 | Colorectum | colon adenocarcinoma | Female | >=65 | I/II | Unknown | Unknown | SD |
| PPP1R18 | SNV | Missense_Mutation | c.284N>A | p.Arg95Gln | p.R95Q | Q6NYC8 | protein_coding | tolerated(0.17) | possibly_damaging(0.712) | TCGA-CM-4743-01 | Colorectum | colon adenocarcinoma | Male | >=65 | I/II | Chemotherapy | capecitabine | SD | |
| PPP1R18 | SNV | Missense_Mutation | rs753123312 | c.889N>A | p.Glu297Lys | p.E297K | Q6NYC8 | protein_coding | deleterious_low_confidence(0.01) | benign(0.01) | TCGA-CM-5863-01 | Colorectum | colon adenocarcinoma | Female | <65 | III/IV | Chemotherapy | oxaliplatin | SD |
| PPP1R18 | SNV | Missense_Mutation | c.908N>T | p.Ala303Val | p.A303V | Q6NYC8 | protein_coding | tolerated_low_confidence(0.3) | benign(0) | TCGA-AG-A002-01 | Colorectum | rectum adenocarcinoma | Male | <65 | I/II | Unknown | Unknown | SD |
| Page: 1 2 3 4 |
Top |
Related drugs of malignant transformation related genes |
| Identification of chemicals and drugs interact with genes involved in malignant transfromation |
| (DGIdb 4.0) |
| Entrez ID | Symbol | Category | Interaction Types | Drug Claim Name | Drug Name | PMIDs |
| 170954 | PPP1R18 | ENZYME | carboplatin | CARBOPLATIN | 31616045 | |
| 170954 | PPP1R18 | ENZYME | gemcitabine | GEMCITABINE | 31616045 |
| Page: 1 |

Copyright 2023-Present -The University of Texas Health Science Center at Houston |