Schematic overview of the cellular and molecular mechanisms involved in the cancer progression, including the proposed cellular and molecular mechanisms in cancer cells trajectory. AT1: alveolar type 1 cells; AT2: alveolar type 2 cells; AAH: atypical adenomatous hyperplasia; AIS: adenocarcinoma in situ; MIA: minimally invasive adenocarcinoma; IA: invasive adenocarcinoma; EMT: epithelial-mesenchymal transition

Home

Download

Statistics

Help

Contact

Center for Computational Systems Medicine
leaf

Gene summary

leaf

Malignant transformation analysis

leaf

Malignant transformation related pathway analysis

leaf

Cell-cell communication analysis

leaf

Single-cell gene regulatory network inference analysis

leaf

Somatic mutation of malignant transformation related genes

leaf

Related drugs of malignant transformation related genes

Gene: PPP1R15B

Gene summary for PPP1R15B

check button Gene summary.

Gene informationSpeciesHuman
Gene symbol

PPP1R15B

Gene ID

84919

Gene nameprotein phosphatase 1 regulatory subunit 15B
Gene AliasCREP
Cytomap1q32.1
Gene Typeprotein-coding
GO ID

GO:0000302

UniProtAcc

NA


Top

Malignant transformation analysis

check button Identification of the aberrant gene expression in precancerous and cancerous lesions by comparing the gene expression of stem-like cells in diseased tissues with normal stem cells
check button Malignant transformation involving gene list.
Entrez IDSymbolReplicatesSpeciesOrganTissueAdj P-valueLog2FCMalignancy
84919PPP1R15BLZE4THumanEsophagusESCC1.93e-031.77e-020.0811
84919PPP1R15BLZE7THumanEsophagusESCC1.20e-033.20e-010.0667
84919PPP1R15BLZE8THumanEsophagusESCC3.31e-042.46e-010.067
84919PPP1R15BLZE24THumanEsophagusESCC1.15e-062.63e-010.0596
84919PPP1R15BP1T-EHumanEsophagusESCC2.99e-087.12e-010.0875
84919PPP1R15BP2T-EHumanEsophagusESCC4.33e-236.66e-010.1177
84919PPP1R15BP4T-EHumanEsophagusESCC1.10e-104.10e-010.1323
84919PPP1R15BP5T-EHumanEsophagusESCC9.57e-132.89e-010.1327
84919PPP1R15BP8T-EHumanEsophagusESCC9.40e-132.07e-010.0889
84919PPP1R15BP9T-EHumanEsophagusESCC1.60e-131.86e-010.1131
84919PPP1R15BP10T-EHumanEsophagusESCC8.01e-111.24e-010.116
84919PPP1R15BP11T-EHumanEsophagusESCC8.29e-127.57e-010.1426
84919PPP1R15BP12T-EHumanEsophagusESCC1.64e-071.98e-030.1122
84919PPP1R15BP15T-EHumanEsophagusESCC3.38e-162.74e-010.1149
84919PPP1R15BP16T-EHumanEsophagusESCC1.61e-151.05e-010.1153
84919PPP1R15BP17T-EHumanEsophagusESCC1.92e-021.03e-020.1278
84919PPP1R15BP19T-EHumanEsophagusESCC2.89e-033.54e-010.1662
84919PPP1R15BP20T-EHumanEsophagusESCC2.86e-038.13e-020.1124
84919PPP1R15BP21T-EHumanEsophagusESCC1.88e-142.85e-010.1617
84919PPP1R15BP22T-EHumanEsophagusESCC1.55e-145.53e-020.1236
Page: 1 2 3 4 5 6 

check button Transcriptomic changes along malignancy continuum.
TissueExpression DynamicsAbbreviation
EsophagusThe image shows the transcriptomic changes along malignancy continuum.log2FC in expression of this searched gene in stem-like cells from each diseased tissue sample relative to stem-like cells in normal samples in each tissue plotted against the malignancy continuum. Samples are colored based on if they are from different disease stage.
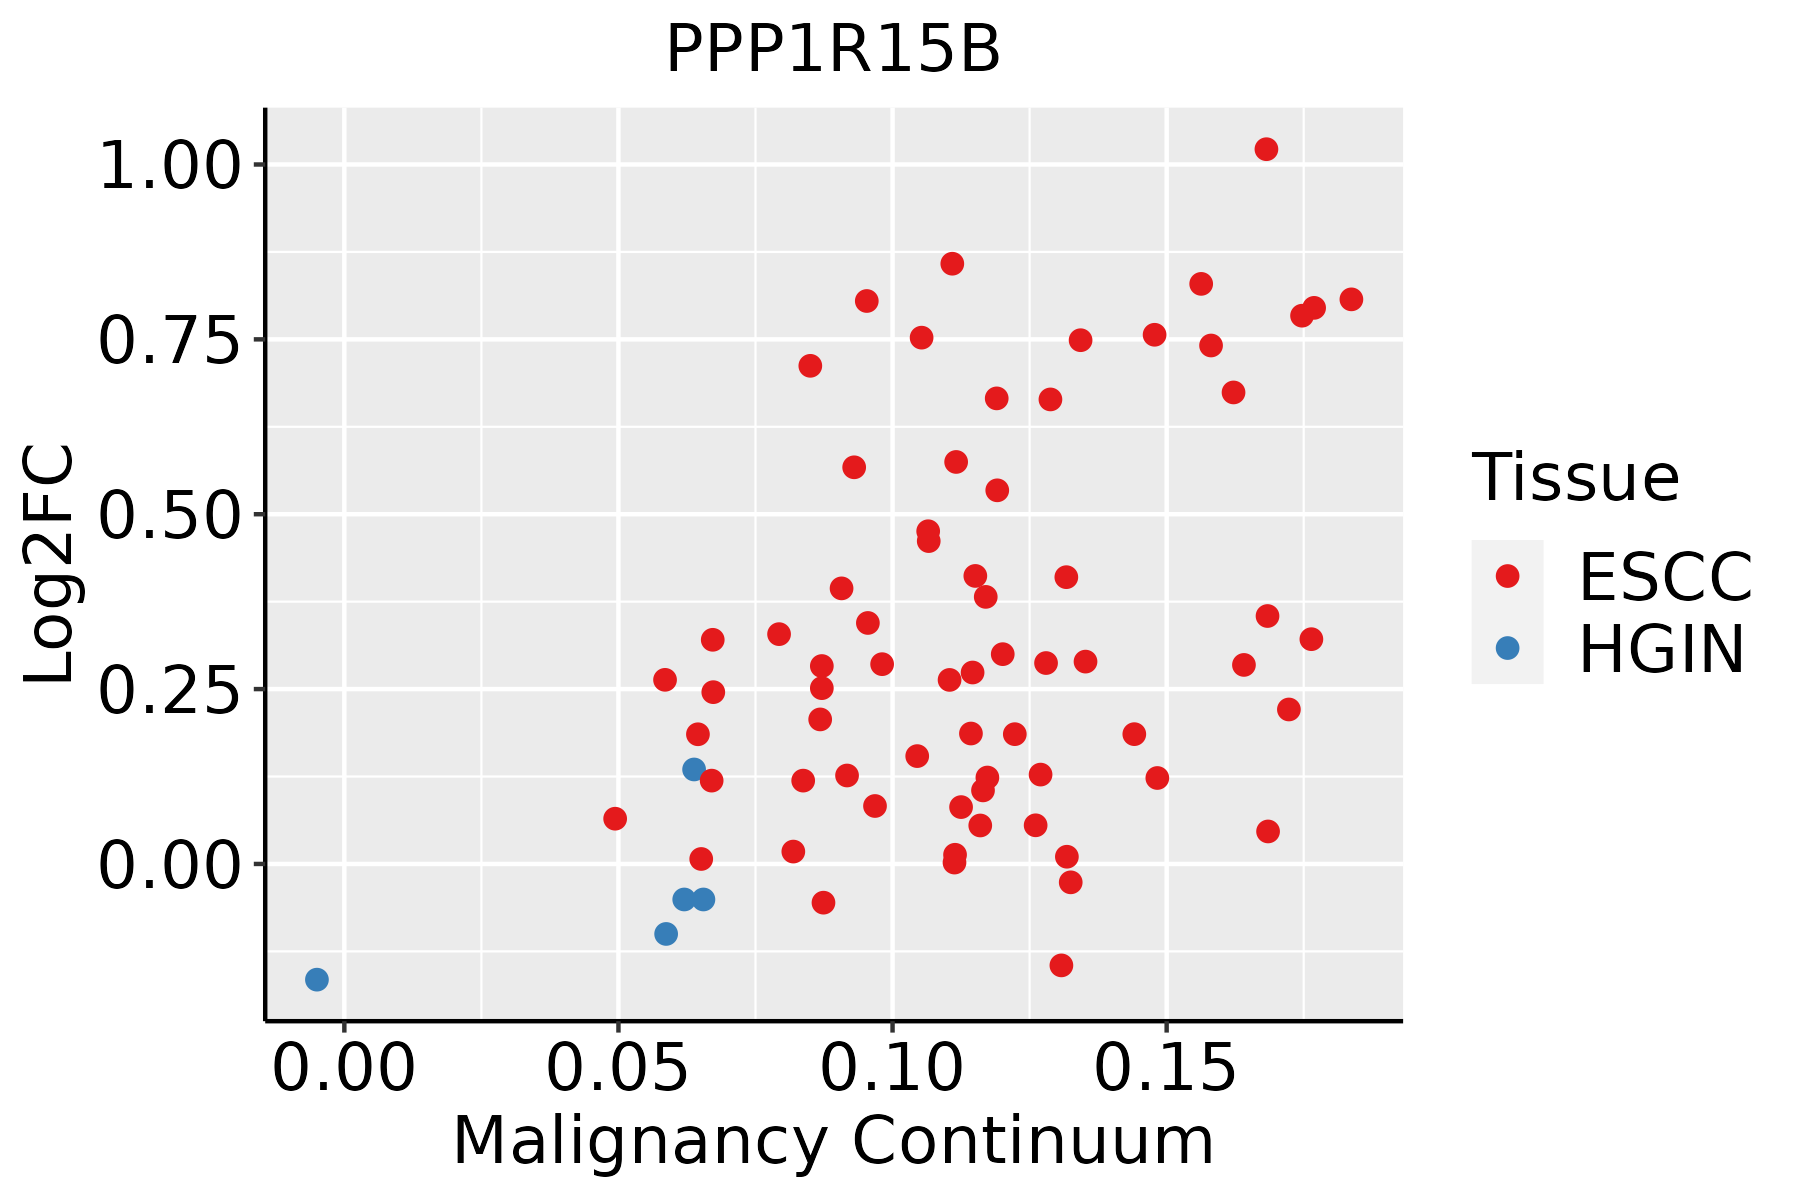
ESCC: Esophageal squamous cell carcinoma
HGIN: High-grade intraepithelial neoplasias
LGIN: Low-grade intraepithelial neoplasias
LiverThe image shows the transcriptomic changes along malignancy continuum.log2FC in expression of this searched gene in stem-like cells from each diseased tissue sample relative to stem-like cells in normal samples in each tissue plotted against the malignancy continuum. Samples are colored based on if they are from different disease stage.
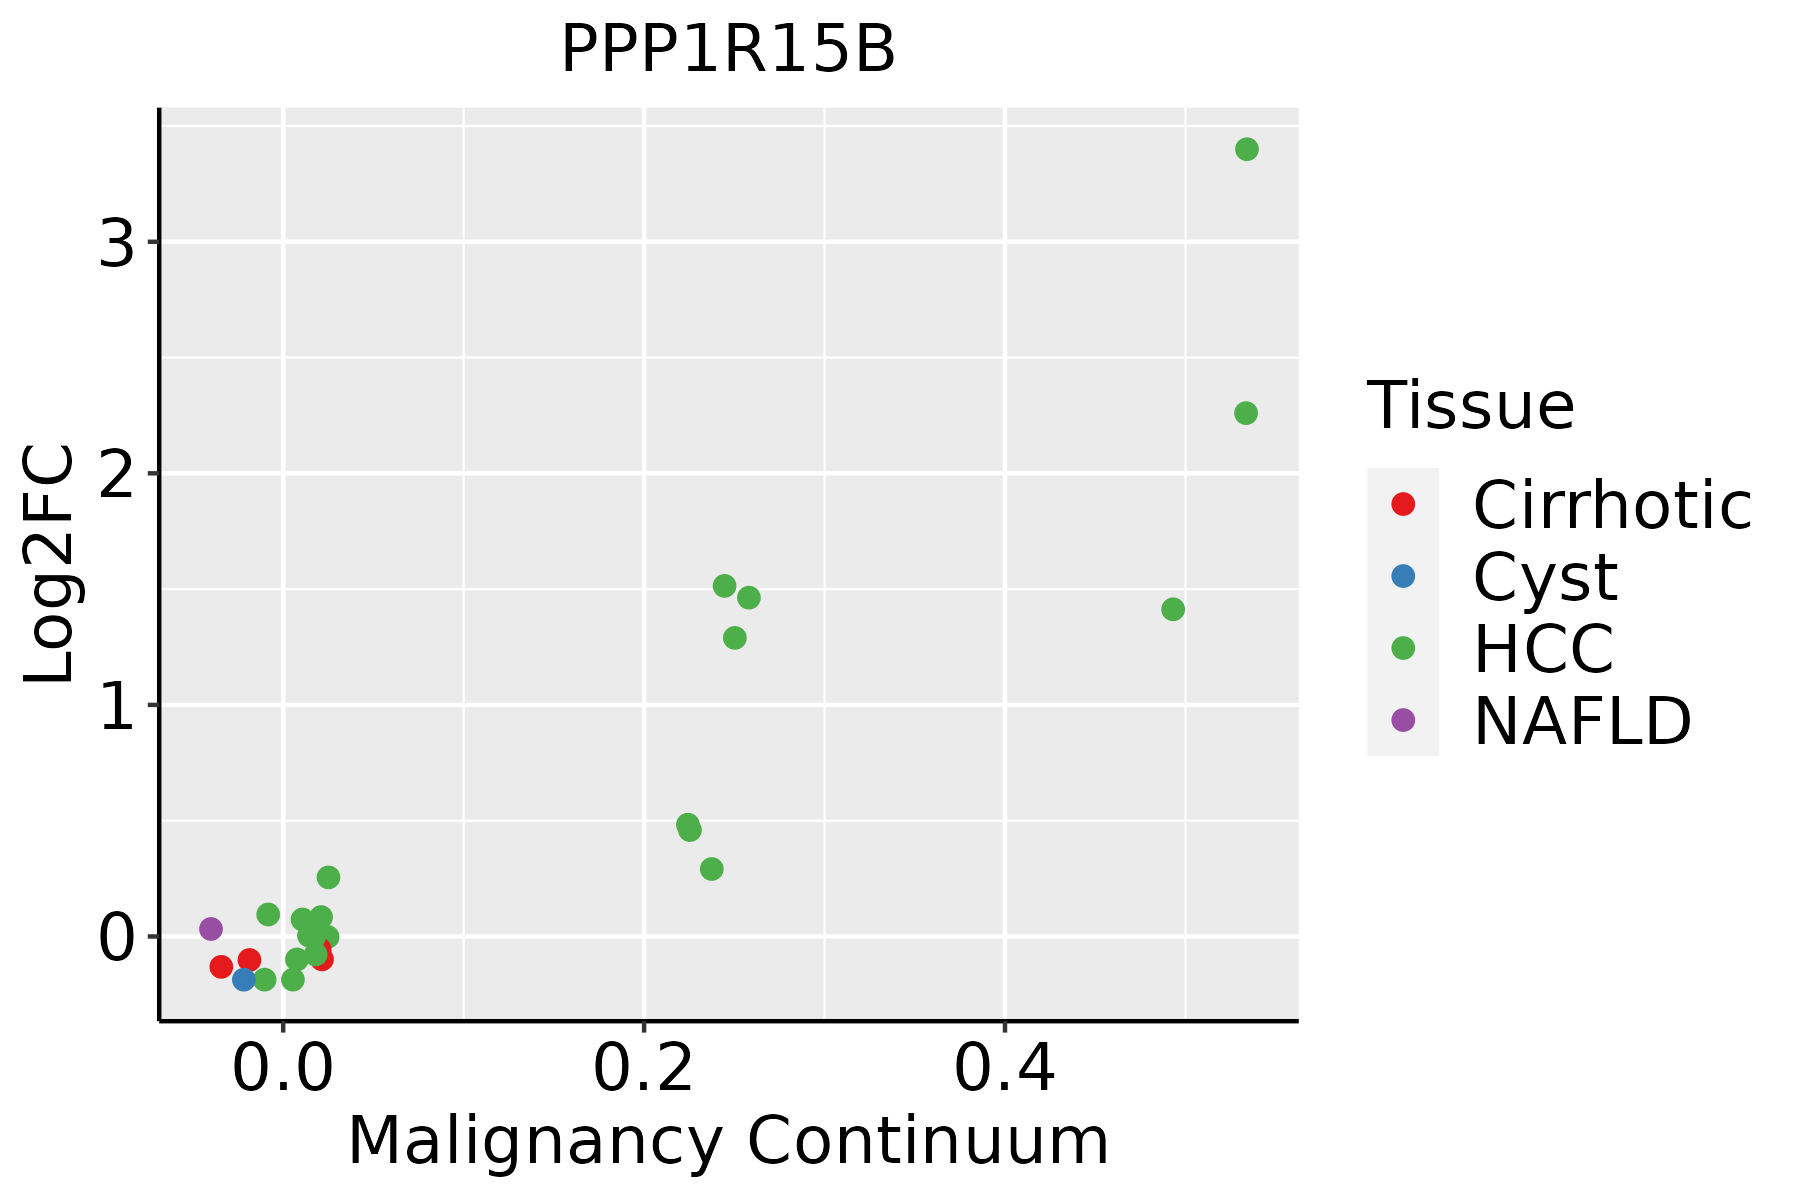
HCC: Hepatocellular carcinoma
NAFLD: Non-alcoholic fatty liver disease
Oral CavityThe image shows the transcriptomic changes along malignancy continuum.log2FC in expression of this searched gene in stem-like cells from each diseased tissue sample relative to stem-like cells in normal samples in each tissue plotted against the malignancy continuum. Samples are colored based on if they are from different disease stage.
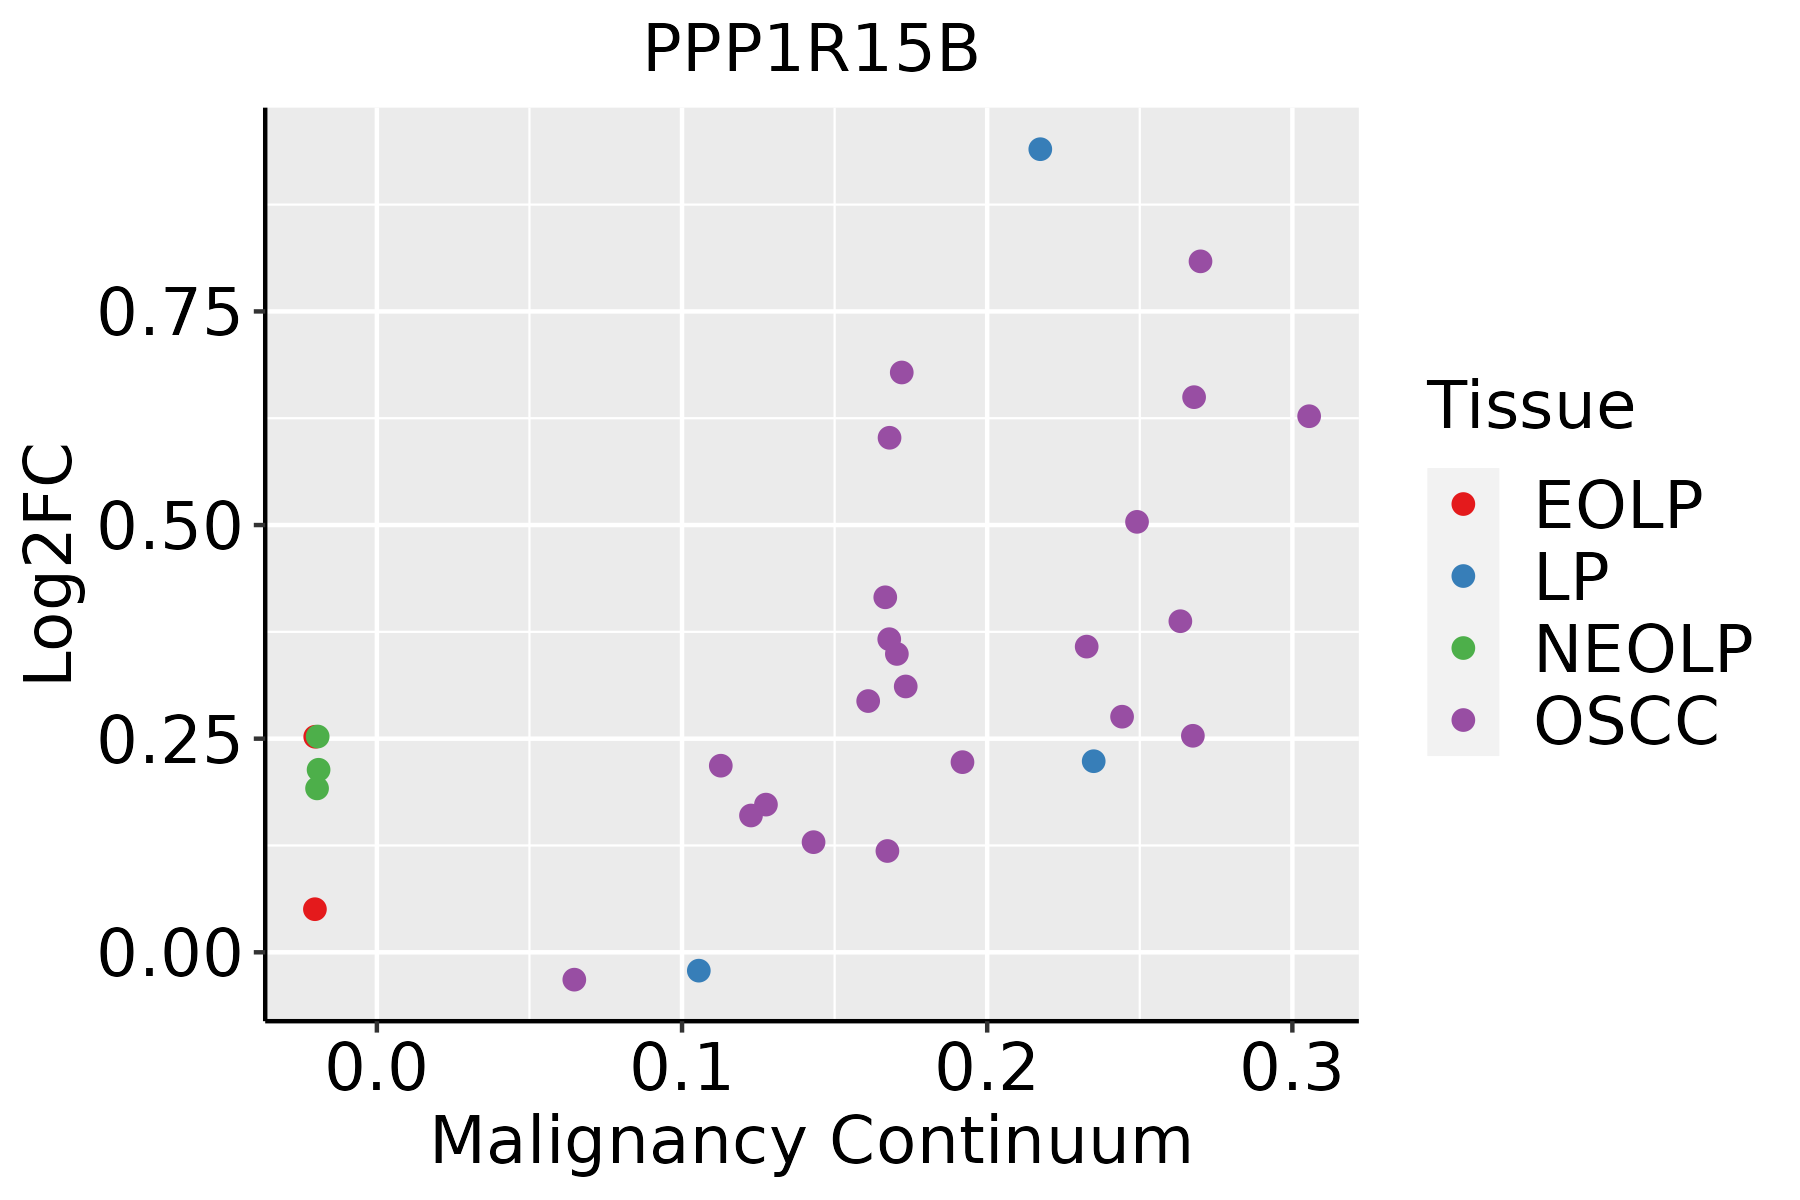
EOLP: Erosive Oral lichen planus
LP: leukoplakia
NEOLP: Non-erosive oral lichen planus
OSCC: Oral squamous cell carcinoma
ProstateThe image shows the transcriptomic changes along malignancy continuum.log2FC in expression of this searched gene in stem-like cells from each diseased tissue sample relative to stem-like cells in normal samples in each tissue plotted against the malignancy continuum. Samples are colored based on if they are from different disease stage.
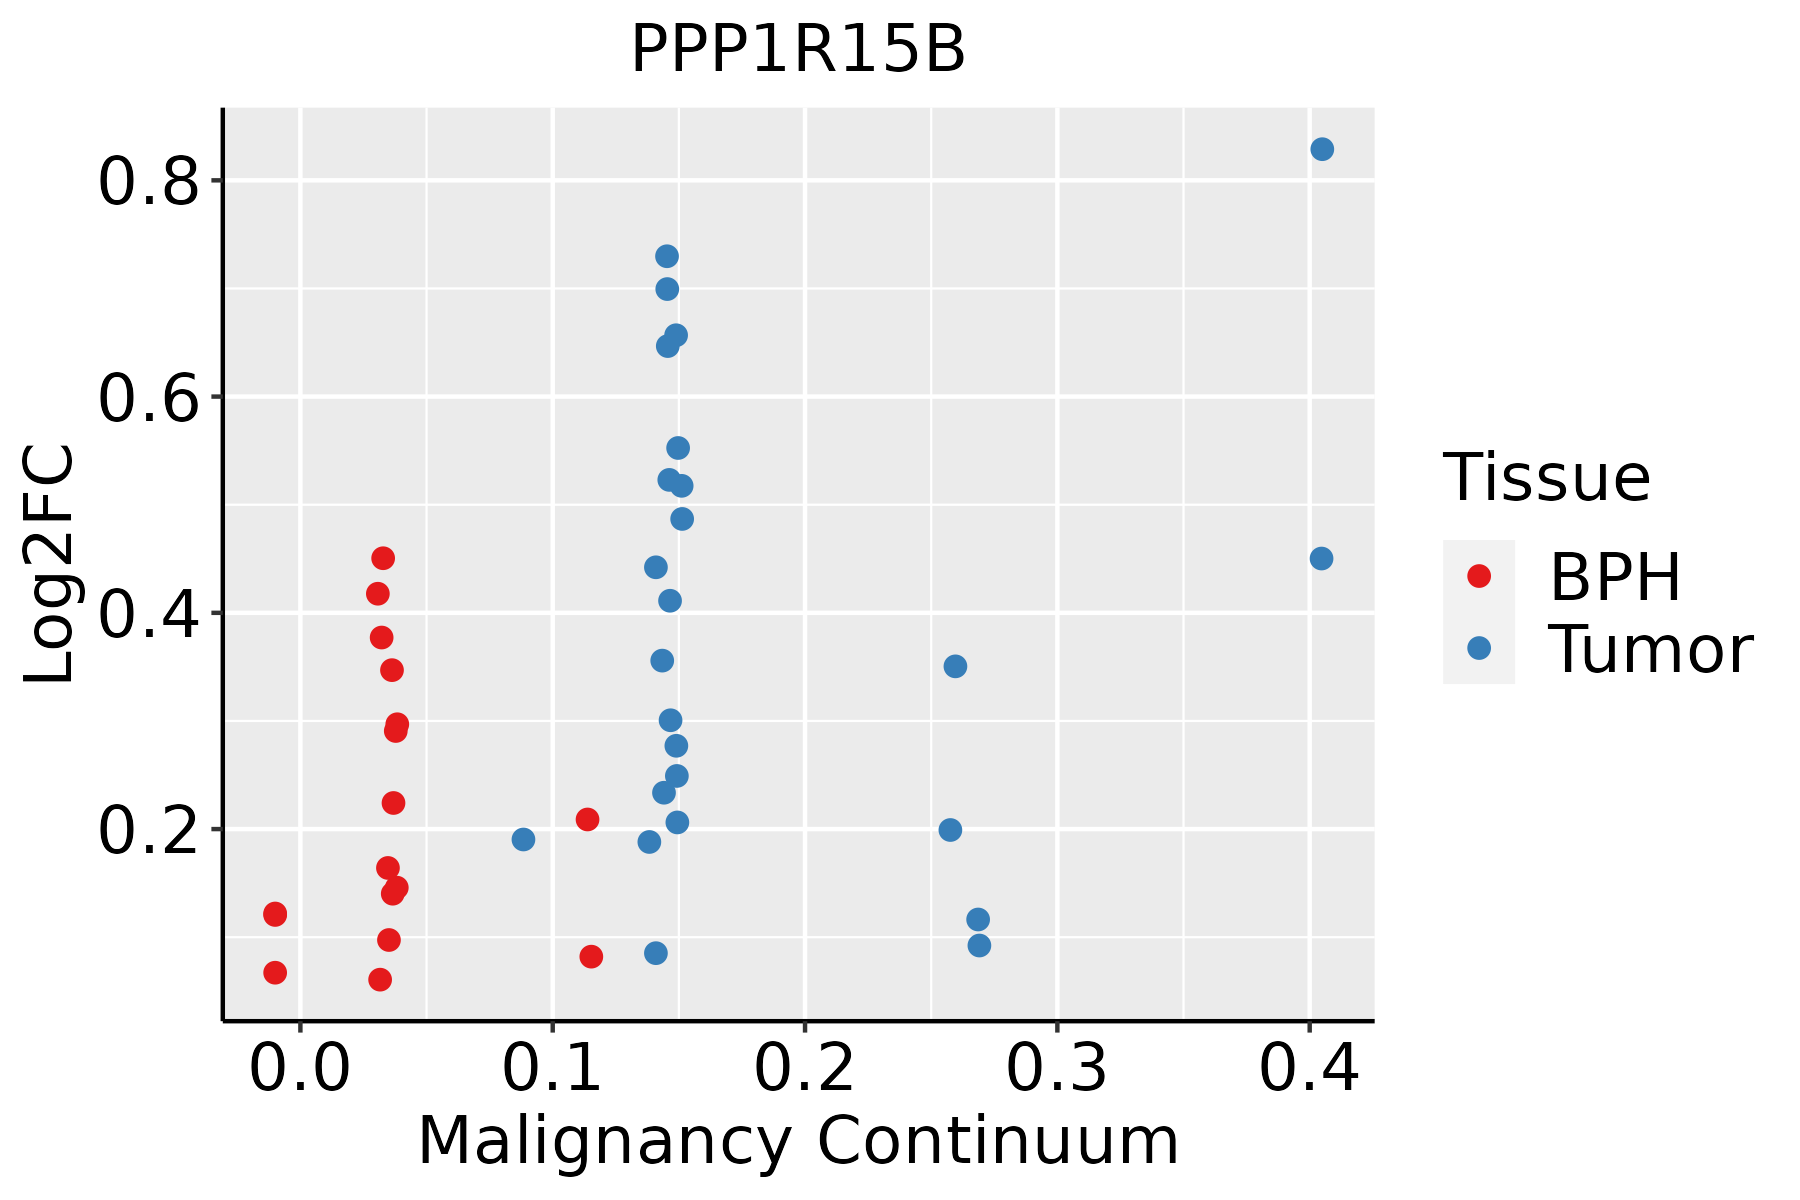
BPH: Benign Prostatic Hyperplasia
ThyroidThe image shows the transcriptomic changes along malignancy continuum.log2FC in expression of this searched gene in stem-like cells from each diseased tissue sample relative to stem-like cells in normal samples in each tissue plotted against the malignancy continuum. Samples are colored based on if they are from different disease stage.ATC: Anaplastic thyroid cancer
HT: Hashimoto's thyroiditis
PTC: Papillary thyroid cancer
∗log2FC in expression of this searched gene in stem-like cells from each diseased tissue sample relative to stem-like cells in normal samples in each tissue plotted against the malignancy continuum. Samples are colored based on if they are from different disease stage.

Top

Malignant transformation related pathway analysis

check buttonFind out the enriched GO biological processes and KEGG pathways involved in transition from healthy to precancer to cancer
check button Figure of enriched GO biological processes.
TissueDisease StageEnriched GO biological Processes
ColorectumADGO analysis - Figure of enriched GO biological processes: Top 15 enriched GO BP terms are showed in the bar plot of each disease state in each tissue. Each row represents a significant GO biological process which is colored according to the -log10(p.adjust).
ColorectumSERGO analysis - Figure of enriched GO biological processes: Top 15 enriched GO BP terms are showed in the bar plot of each disease state in each tissue. Each row represents a significant GO biological process which is colored according to the -log10(p.adjust).
ColorectumMSSGO analysis - Figure of enriched GO biological processes: Top 15 enriched GO BP terms are showed in the bar plot of each disease state in each tissue. Each row represents a significant GO biological process which is colored according to the -log10(p.adjust).
ColorectumMSI-HGO analysis - Figure of enriched GO biological processes: Top 15 enriched GO BP terms are showed in the bar plot of each disease state in each tissue. Each row represents a significant GO biological process which is colored according to the -log10(p.adjust).
ColorectumFAPGO analysis - Figure of enriched GO biological processes: Top 15 enriched GO BP terms are showed in the bar plot of each disease state in each tissue. Each row represents a significant GO biological process which is colored according to the -log10(p.adjust).
∗Top 15 enriched GO BP terms are showed in the bar plot of each disease state in each tissue. Each row represents a significant GO biological process which is colored according to the -log10(p.adjust).
Page: 1 2 3 4 5 6 7 8 9 

check button Enriched GO biological processes.
GO IDTissueDisease StageDescriptionGene RatioBg Ratiopvaluep.adjustCount
GO:0034976111EsophagusESCCresponse to endoplasmic reticulum stress192/8552256/187237.15e-221.30e-19192
GO:0006979111EsophagusESCCresponse to oxidative stress303/8552446/187237.15e-221.30e-19303
GO:0006413110EsophagusESCCtranslational initiation100/8552118/187231.16e-181.25e-16100
GO:0035966111EsophagusESCCresponse to topologically incorrect protein125/8552159/187231.44e-171.27e-15125
GO:0006417111EsophagusESCCregulation of translation304/8552468/187231.53e-171.33e-15304
GO:0006986111EsophagusESCCresponse to unfolded protein107/8552137/187237.01e-153.87e-13107
GO:0035967111EsophagusESCCcellular response to topologically incorrect protein90/8552116/187231.94e-128.11e-1190
GO:0010563111EsophagusESCCnegative regulation of phosphorus metabolic process274/8552442/187232.32e-129.41e-11274
GO:0045936111EsophagusESCCnegative regulation of phosphate metabolic process273/8552441/187233.18e-121.25e-10273
GO:000644617EsophagusESCCregulation of translational initiation65/855279/187232.04e-117.07e-1065
GO:0000302111EsophagusESCCresponse to reactive oxygen species150/8552222/187233.06e-111.02e-09150
GO:0042326111EsophagusESCCnegative regulation of phosphorylation237/8552385/187231.86e-105.33e-09237
GO:0034620111EsophagusESCCcellular response to unfolded protein74/855296/187233.10e-108.66e-0974
GO:0001933111EsophagusESCCnegative regulation of protein phosphorylation213/8552342/187233.54e-109.76e-09213
GO:001631110EsophagusESCCdephosphorylation251/8552417/187231.26e-092.99e-08251
GO:003096818EsophagusESCCendoplasmic reticulum unfolded protein response59/855274/187231.90e-094.36e-0859
GO:0042542111EsophagusESCCresponse to hydrogen peroxide102/8552146/187232.64e-095.81e-08102
GO:000647018EsophagusESCCprotein dephosphorylation177/8552281/187233.13e-096.72e-08177
GO:1905897111EsophagusESCCregulation of response to endoplasmic reticulum stress63/855282/187238.16e-091.66e-0763
GO:0035304111EsophagusESCCregulation of protein dephosphorylation66/855290/187238.82e-081.48e-0666
Page: 1 2 3 4 5 6 7 8 9 10 11 12 13 14 15 16 17 18 19 20 

check button Enriched KEGG pathways.
Pathway IDTissueDisease StageDescriptionGene RatioBg Ratiopvaluep.adjustqvalueCount
Page: 1 

Top

Cell-cell communication analysis

check buttonIdentification of potential cell-cell interactions between two cell types and their ligand-receptor pairs for different disease states
LigandReceptorLRpairPathwayTissueDisease Stage
Page: 1 

Top

Single-cell gene regulatory network inference analysis

check buttonFind out the significant the regulons (TFs) and the target genes of each regulon across cell types for different disease states
TFCell TypeTissueDisease StageTarget GeneRSSRegulon Activity
∗The dot plots of a searched regulon are shown for all cell subpopulations in each disease state of each tissue based on the regulon specific score inferred using pySCENIC and by calculating the average expression.
Page: 1 

Top

Somatic mutation of malignant transformation related genes

check buttonAnnotation of somatic variants for genes involved in malignant transformation
Hugo SymbolVariant ClassVariant ClassificationdbSNP RSHGVScHGVSpHGVSp ShortSWISSPROTBIOTYPESIFTPolyPhenTumor Sample BarcodeTissueHistologySexAgeStageTherapy TypesDrugsOutcome
PPP1R15BSNVMissense_Mutationnovelc.1677N>Ap.Phe559Leup.F559LQ5SWA1protein_codingtolerated(0.07)probably_damaging(0.999)TCGA-A1-A0SO-01Breastbreast invasive carcinomaFemale>=65I/IIChemotherapySD
PPP1R15BSNVMissense_Mutationc.171G>Cp.Glu57Aspp.E57DQ5SWA1protein_codingdeleterious_low_confidence(0.04)benign(0.073)TCGA-A8-A09G-01Breastbreast invasive carcinomaFemale>=65III/IVUnknownUnknownSD
PPP1R15BSNVMissense_Mutationc.1861G>Ap.Asp621Asnp.D621NQ5SWA1protein_codingtolerated(0.1)benign(0.149)TCGA-AC-A23H-01Breastbreast invasive carcinomaFemale>=65I/IIUnknownUnknownPD
PPP1R15BSNVMissense_Mutationc.1341N>Ap.Asp447Glup.D447EQ5SWA1protein_codingtolerated(0.2)possibly_damaging(0.693)TCGA-B6-A0IJ-01Breastbreast invasive carcinomaFemale<65I/IIUnknownUnknownSD
PPP1R15BSNVMissense_Mutationc.742N>Cp.Val248Leup.V248LQ5SWA1protein_codingdeleterious(0.03)benign(0.159)TCGA-E9-A244-01Breastbreast invasive carcinomaFemale<65I/IIChemotherapycyclophosphamideSD
PPP1R15BSNVMissense_Mutationnovelc.1531G>Cp.Glu511Glnp.E511QQ5SWA1protein_codingtolerated(0.3)benign(0.177)TCGA-LL-A5YM-01Breastbreast invasive carcinomaFemale>=65III/IVUnspecificletrozolePD
PPP1R15BinsertionFrame_Shift_Insnovelc.1228_1229insCCp.Glu410AlafsTer17p.E410Afs*17Q5SWA1protein_codingTCGA-A8-A06X-01Breastbreast invasive carcinomaFemale>=65I/IIUnknownUnknownSD
PPP1R15BinsertionFrame_Shift_Insnovelc.1226_1227insTGGCCTTCCAAAGTGCTGGGATTACAGGCGTGp.Glu410GlyfsTer27p.E410Gfs*27Q5SWA1protein_codingTCGA-A8-A06X-01Breastbreast invasive carcinomaFemale>=65I/IIUnknownUnknownSD
PPP1R15BinsertionFrame_Shift_Insnovelc.1024_1025insGTCCATTGTGGCCATTTCTGAGTGTCp.Asn342SerfsTer33p.N342Sfs*33Q5SWA1protein_codingTCGA-A8-A08H-01Breastbreast invasive carcinomaFemale>=65I/IIUnknownUnknownSD
PPP1R15BinsertionFrame_Shift_Insnovelc.181_182insTTCTTAGTTGGGAATATTCTGAAAGAATTGGTAGCATAAAGGGp.Ser61IlefsTer95p.S61Ifs*95Q5SWA1protein_codingTCGA-A8-A095-01Breastbreast invasive carcinomaFemale<65I/IIChemotherapy5-fluorouracilCR
Page: 1 2 3 4 5 6 7 

Top

Related drugs of malignant transformation related genes

check buttonIdentification of chemicals and drugs interact with genes involved in malignant transfromation
(DGIdb 4.0)
Entrez IDSymbolCategoryInteraction TypesDrug Claim NameDrug NamePMIDs
Page: 1