
|
|||||
|
 | |
| |
| |
| |
| |
| |
|
Gene: PPP1R14D |
Gene summary for PPP1R14D |
| Gene information | Species | Human | Gene symbol | PPP1R14D | Gene ID | 54866 |
| Gene name | protein phosphatase 1 regulatory inhibitor subunit 14D | |
| Gene Alias | CPI17-like | |
| Cytomap | 15q15.1 | |
| Gene Type | protein-coding | GO ID | GO:0006464 | UniProtAcc | E9PAT1 |
Top |
Malignant transformation analysis |
| Identification of the aberrant gene expression in precancerous and cancerous lesions by comparing the gene expression of stem-like cells in diseased tissues with normal stem cells |
| Entrez ID | Symbol | Replicates | Species | Organ | Tissue | Adj P-value | Log2FC | Malignancy |
| 54866 | PPP1R14D | HTA11_2487_2000001011 | Human | Colorectum | SER | 4.36e-02 | 2.71e-01 | -0.1808 |
| 54866 | PPP1R14D | HTA11_347_2000001011 | Human | Colorectum | AD | 4.50e-13 | 4.12e-01 | -0.1954 |
| 54866 | PPP1R14D | HTA11_411_2000001011 | Human | Colorectum | SER | 1.23e-02 | 6.62e-01 | -0.2602 |
| 54866 | PPP1R14D | HTA11_696_2000001011 | Human | Colorectum | AD | 1.61e-05 | 3.41e-01 | -0.1464 |
| 54866 | PPP1R14D | HTA11_866_2000001011 | Human | Colorectum | AD | 1.09e-02 | 2.45e-01 | -0.1001 |
| 54866 | PPP1R14D | HTA11_1391_2000001011 | Human | Colorectum | AD | 6.99e-06 | 3.19e-01 | -0.059 |
| 54866 | PPP1R14D | Pat01-B | Human | Stomach | GC | 2.73e-40 | 7.10e-01 | 0.5754 |
| 54866 | PPP1R14D | Pat02-B | Human | Stomach | GC | 9.13e-06 | 1.76e-01 | 0.0368 |
| 54866 | PPP1R14D | Pat03-B | Human | Stomach | GC | 8.94e-22 | 4.45e-01 | 0.3693 |
| 54866 | PPP1R14D | Pat05-B | Human | Stomach | GC | 2.81e-03 | 2.07e-01 | -0.0353 |
| 54866 | PPP1R14D | Pat07-B | Human | Stomach | GC | 2.30e-04 | 2.61e-01 | 0.0935 |
| 54866 | PPP1R14D | Pat08-B | Human | Stomach | GC | 6.95e-04 | 2.73e-01 | 0.0182 |
| 54866 | PPP1R14D | Pat10-B | Human | Stomach | GC | 1.17e-03 | 2.39e-01 | 0.084 |
| 54866 | PPP1R14D | Pat12-B | Human | Stomach | GC | 1.55e-08 | 2.25e-01 | 0.0325 |
| 54866 | PPP1R14D | Pat13-B | Human | Stomach | GC | 1.31e-03 | 1.66e-01 | 0.0555 |
| 54866 | PPP1R14D | Pat16-B | Human | Stomach | GC | 1.67e-02 | 1.54e-01 | 0.1918 |
| 54866 | PPP1R14D | Pat17-B | Human | Stomach | GC | 2.00e-06 | 2.20e-01 | 0.3109 |
| 54866 | PPP1R14D | Pat19-B | Human | Stomach | GC | 3.24e-02 | 1.44e-01 | 0.0826 |
| 54866 | PPP1R14D | SIM_1 | Human | Stomach | SIM | 8.40e-04 | 2.12e-01 | 0.3573 |
| 54866 | PPP1R14D | SIM_2 | Human | Stomach | SIM | 8.40e-04 | 1.74e-01 | 0.3139 |
| Page: 1 |
| Tissue | Expression Dynamics | Abbreviation |
| Colorectum (GSE201348) |  | FAP: Familial adenomatous polyposis |
| CRC: Colorectal cancer | ||
| Colorectum (HTA11) | 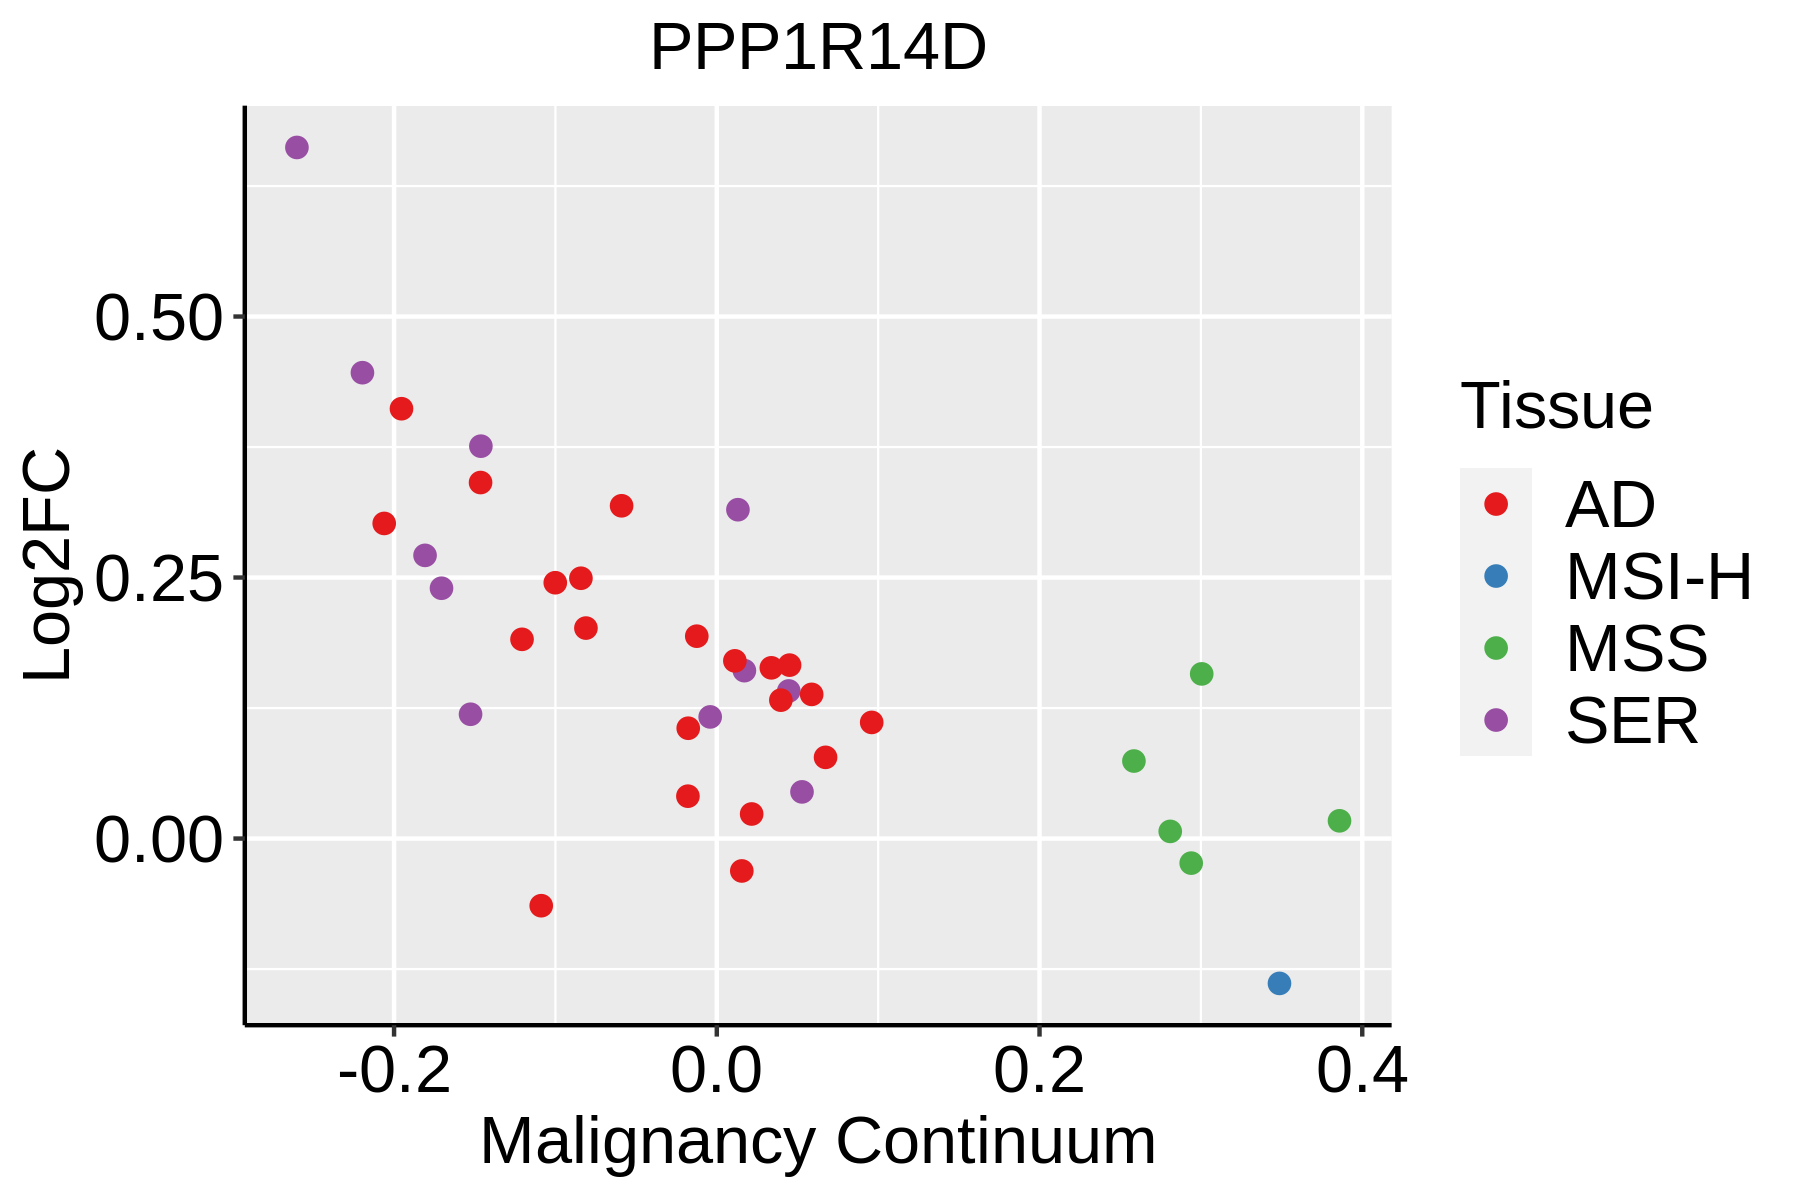 | AD: Adenomas |
| SER: Sessile serrated lesions | ||
| MSI-H: Microsatellite-high colorectal cancer | ||
| MSS: Microsatellite stable colorectal cancer | ||
| GC | 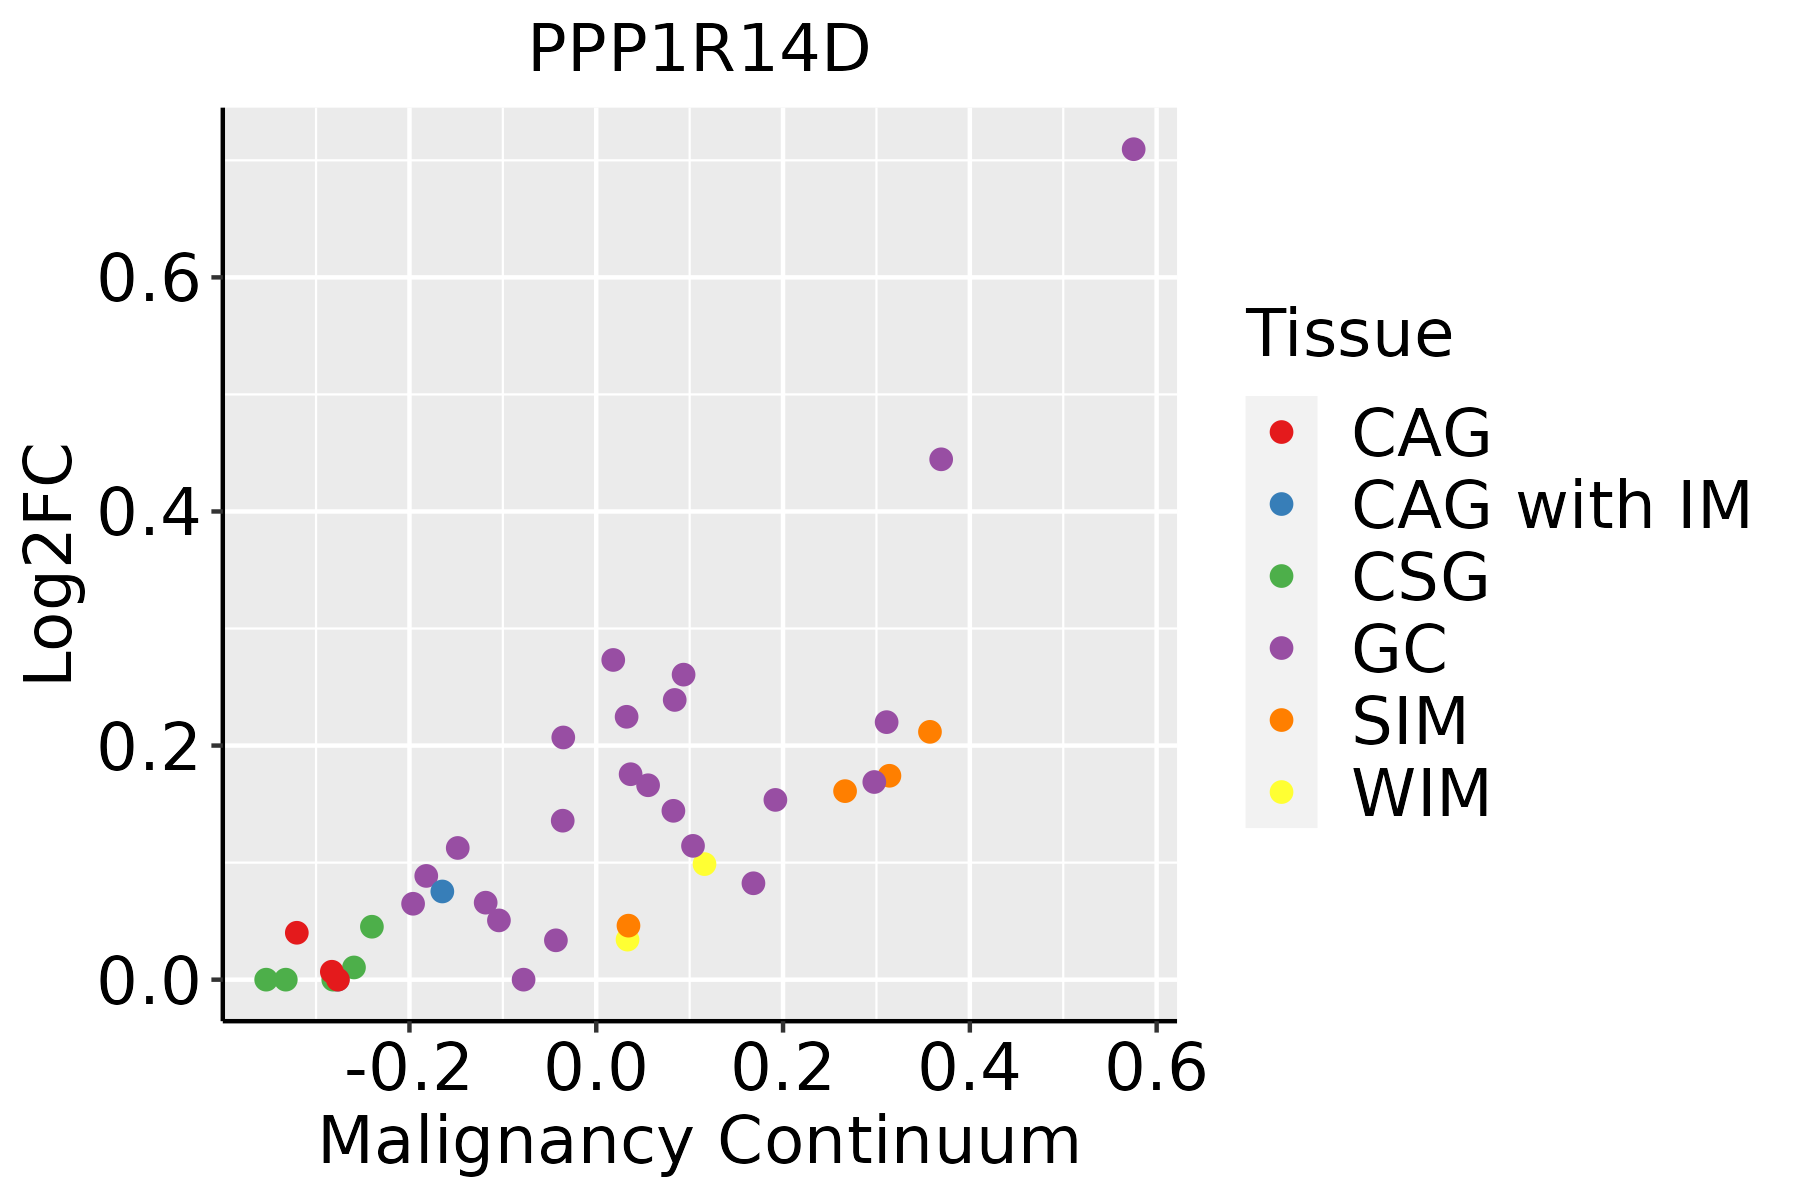 | CAG: Chronic atrophic gastritis |
| CAG with IM: Chronic atrophic gastritis with intestinal metaplasia | ||
| CSG: Chronic superficial gastritis | ||
| GC: Gastric cancer | ||
| SIM: Severe intestinal metaplasia | ||
| WIM: Wild intestinal metaplasia |
| ∗log2FC in expression of this searched gene in stem-like cells from each diseased tissue sample relative to stem-like cells in normal samples in each tissue plotted against the malignancy continuum. Samples are colored based on if they are from different disease stage. |
Top |
Malignant transformation related pathway analysis |
| Find out the enriched GO biological processes and KEGG pathways involved in transition from healthy to precancer to cancer |
| Tissue | Disease Stage | Enriched GO biological Processes |
| Colorectum | AD |  |
| Colorectum | SER |  |
| Colorectum | MSS |  |
| Colorectum | MSI-H |  |
| Colorectum | FAP |  |
| ∗Top 15 enriched GO BP terms are showed in the bar plot of each disease state in each tissue. Each row represents a significant GO biological process which is colored according to the -log10(p.adjust). |
| Page: 1 2 3 4 5 6 7 8 9 |
| GO ID | Tissue | Disease Stage | Description | Gene Ratio | Bg Ratio | pvalue | p.adjust | Count |
| GO:0010563 | Colorectum | AD | negative regulation of phosphorus metabolic process | 130/3918 | 442/18723 | 1.26e-05 | 2.76e-04 | 130 |
| GO:0045936 | Colorectum | AD | negative regulation of phosphate metabolic process | 129/3918 | 441/18723 | 1.81e-05 | 3.76e-04 | 129 |
| GO:0016311 | Colorectum | AD | dephosphorylation | 123/3918 | 417/18723 | 1.84e-05 | 3.82e-04 | 123 |
| GO:0006470 | Colorectum | AD | protein dephosphorylation | 88/3918 | 281/18723 | 2.56e-05 | 4.89e-04 | 88 |
| GO:0035303 | Colorectum | AD | regulation of dephosphorylation | 46/3918 | 128/18723 | 6.20e-05 | 1.04e-03 | 46 |
| GO:0035304 | Colorectum | AD | regulation of protein dephosphorylation | 33/3918 | 90/18723 | 4.23e-04 | 4.77e-03 | 33 |
| GO:0010921 | Colorectum | AD | regulation of phosphatase activity | 30/3918 | 84/18723 | 1.24e-03 | 1.09e-02 | 30 |
| GO:0010922 | Colorectum | AD | positive regulation of phosphatase activity | 15/3918 | 34/18723 | 1.96e-03 | 1.58e-02 | 15 |
| GO:0035306 | Colorectum | AD | positive regulation of dephosphorylation | 22/3918 | 59/18723 | 2.86e-03 | 2.14e-02 | 22 |
| GO:0043666 | Colorectum | AD | regulation of phosphoprotein phosphatase activity | 21/3918 | 58/18723 | 5.25e-03 | 3.47e-02 | 21 |
| GO:0035308 | Colorectum | AD | negative regulation of protein dephosphorylation | 14/3918 | 34/18723 | 5.86e-03 | 3.69e-02 | 14 |
| GO:00105631 | Colorectum | SER | negative regulation of phosphorus metabolic process | 101/2897 | 442/18723 | 2.39e-05 | 6.70e-04 | 101 |
| GO:00459361 | Colorectum | SER | negative regulation of phosphate metabolic process | 100/2897 | 441/18723 | 3.62e-05 | 9.39e-04 | 100 |
| GO:00064701 | Colorectum | SER | protein dephosphorylation | 65/2897 | 281/18723 | 4.44e-04 | 6.51e-03 | 65 |
| GO:0051346 | Colorectum | SER | negative regulation of hydrolase activity | 82/2897 | 379/18723 | 8.19e-04 | 1.01e-02 | 82 |
| GO:00109211 | Colorectum | SER | regulation of phosphatase activity | 24/2897 | 84/18723 | 1.61e-03 | 1.71e-02 | 24 |
| GO:00353031 | Colorectum | SER | regulation of dephosphorylation | 33/2897 | 128/18723 | 1.71e-03 | 1.78e-02 | 33 |
| GO:00353041 | Colorectum | SER | regulation of protein dephosphorylation | 25/2897 | 90/18723 | 2.00e-03 | 1.98e-02 | 25 |
| GO:00436661 | Colorectum | SER | regulation of phosphoprotein phosphatase activity | 18/2897 | 58/18723 | 2.18e-03 | 2.11e-02 | 18 |
| GO:00163111 | Colorectum | SER | dephosphorylation | 86/2897 | 417/18723 | 2.73e-03 | 2.46e-02 | 86 |
| Page: 1 2 |
| Pathway ID | Tissue | Disease Stage | Description | Gene Ratio | Bg Ratio | pvalue | p.adjust | qvalue | Count |
| Page: 1 |
Top |
Cell-cell communication analysis |
| Identification of potential cell-cell interactions between two cell types and their ligand-receptor pairs for different disease states |
| Ligand | Receptor | LRpair | Pathway | Tissue | Disease Stage |
| Page: 1 |
Top |
Single-cell gene regulatory network inference analysis |
| Find out the significant the regulons (TFs) and the target genes of each regulon across cell types for different disease states |
| TF | Cell Type | Tissue | Disease Stage | Target Gene | RSS | Regulon Activity |
| ∗The dot plots of a searched regulon are shown for all cell subpopulations in each disease state of each tissue based on the regulon specific score inferred using pySCENIC and by calculating the average expression. |
| Page: 1 |
Top |
Somatic mutation of malignant transformation related genes |
| Annotation of somatic variants for genes involved in malignant transformation |
| Hugo Symbol | Variant Class | Variant Classification | dbSNP RS | HGVSc | HGVSp | HGVSp Short | SWISSPROT | BIOTYPE | SIFT | PolyPhen | Tumor Sample Barcode | Tissue | Histology | Sex | Age | Stage | Therapy Types | Drugs | Outcome |
| PPP1R14D | insertion | Nonsense_Mutation | novel | c.143_144insCTGGGGAAGGTCTTTTAACATCCCTAATCTATAATAG | p.Pro49TrpfsTer11 | p.P49Wfs*11 | protein_coding | TCGA-A8-A07F-01 | Breast | breast invasive carcinoma | Female | >=65 | I/II | Hormone Therapy | tamoxiphen | SD | |||
| PPP1R14D | SNV | Missense_Mutation | novel | c.378N>T | p.Lys126Asn | p.K126N | protein_coding | deleterious_low_confidence(0) | benign(0.001) | TCGA-AA-A00N-01 | Colorectum | colon adenocarcinoma | Male | >=65 | I/II | Unknown | Unknown | PD | |
| PPP1R14D | SNV | Missense_Mutation | novel | c.51N>T | p.Glu17Asp | p.E17D | protein_coding | tolerated_low_confidence(0.48) | benign(0.003) | TCGA-AG-A002-01 | Colorectum | rectum adenocarcinoma | Male | <65 | I/II | Unknown | Unknown | SD | |
| PPP1R14D | SNV | Missense_Mutation | novel | c.550N>C | p.Asn184His | p.N184H | protein_coding | deleterious_low_confidence(0) | possibly_damaging(0.879) | TCGA-A5-A1OF-01 | Endometrium | uterine corpus endometrioid carcinoma | Female | <65 | I/II | Unknown | Unknown | SD | |
| PPP1R14D | SNV | Missense_Mutation | rs202066593 | c.155N>A | p.Arg52Gln | p.R52Q | protein_coding | deleterious_low_confidence(0) | probably_damaging(0.998) | TCGA-AJ-A8CW-01 | Endometrium | uterine corpus endometrioid carcinoma | Female | <65 | I/II | Unknown | Unknown | SD | |
| PPP1R14D | SNV | Missense_Mutation | novel | c.51N>T | p.Glu17Asp | p.E17D | protein_coding | tolerated_low_confidence(0.48) | benign(0.003) | TCGA-EO-A3AY-01 | Endometrium | uterine corpus endometrioid carcinoma | Female | <65 | I/II | Unknown | Unknown | PD | |
| PPP1R14D | SNV | Missense_Mutation | novel | c.559G>A | p.Glu187Lys | p.E187K | protein_coding | tolerated_low_confidence(0.11) | benign(0.001) | TCGA-CR-5248-01 | Oral cavity | head & neck squamous cell carcinoma | Male | <65 | I/II | Chemotherapy | oxaliplatin | PD | |
| PPP1R14D | SNV | Missense_Mutation | novel | c.395N>C | p.Leu132Pro | p.L132P | protein_coding | tolerated_low_confidence(0.08) | benign(0.001) | TCGA-VQ-AA6D-01 | Stomach | stomach adenocarcinoma | Female | <65 | III/IV | Chemotherapy | fluorouracil | CR |
| Page: 1 |
Top |
Related drugs of malignant transformation related genes |
| Identification of chemicals and drugs interact with genes involved in malignant transfromation |
| (DGIdb 4.0) |
| Entrez ID | Symbol | Category | Interaction Types | Drug Claim Name | Drug Name | PMIDs |
| Page: 1 |

Copyright 2023-Present -The University of Texas Health Science Center at Houston |