
|
|||||
|
 | |
| |
| |
| |
| |
| |
|
Gene: PPP1R14C |
Gene summary for PPP1R14C |
| Gene information | Species | Human | Gene symbol | PPP1R14C | Gene ID | 81706 |
| Gene name | protein phosphatase 1 regulatory inhibitor subunit 14C | |
| Gene Alias | CPI17-like | |
| Cytomap | 6q25.1 | |
| Gene Type | protein-coding | GO ID | GO:0006793 | UniProtAcc | Q8TAE6 |
Top |
Malignant transformation analysis |
| Identification of the aberrant gene expression in precancerous and cancerous lesions by comparing the gene expression of stem-like cells in diseased tissues with normal stem cells |
| Entrez ID | Symbol | Replicates | Species | Organ | Tissue | Adj P-value | Log2FC | Malignancy |
| 81706 | PPP1R14C | LZE21T | Human | Esophagus | ESCC | 2.85e-05 | 2.30e-01 | 0.0655 |
| 81706 | PPP1R14C | P2T-E | Human | Esophagus | ESCC | 5.33e-46 | 8.94e-01 | 0.1177 |
| 81706 | PPP1R14C | P4T-E | Human | Esophagus | ESCC | 8.81e-34 | 1.02e+00 | 0.1323 |
| 81706 | PPP1R14C | P5T-E | Human | Esophagus | ESCC | 1.76e-55 | 1.22e+00 | 0.1327 |
| 81706 | PPP1R14C | P8T-E | Human | Esophagus | ESCC | 2.74e-06 | 6.31e-03 | 0.0889 |
| 81706 | PPP1R14C | P9T-E | Human | Esophagus | ESCC | 1.36e-02 | 1.17e-01 | 0.1131 |
| 81706 | PPP1R14C | P10T-E | Human | Esophagus | ESCC | 1.35e-18 | 4.55e-01 | 0.116 |
| 81706 | PPP1R14C | P11T-E | Human | Esophagus | ESCC | 3.20e-03 | 2.53e-01 | 0.1426 |
| 81706 | PPP1R14C | P12T-E | Human | Esophagus | ESCC | 2.42e-26 | 7.80e-01 | 0.1122 |
| 81706 | PPP1R14C | P15T-E | Human | Esophagus | ESCC | 1.18e-22 | 8.05e-01 | 0.1149 |
| 81706 | PPP1R14C | P16T-E | Human | Esophagus | ESCC | 1.05e-66 | 1.52e+00 | 0.1153 |
| 81706 | PPP1R14C | P17T-E | Human | Esophagus | ESCC | 1.88e-06 | 1.34e-01 | 0.1278 |
| 81706 | PPP1R14C | P20T-E | Human | Esophagus | ESCC | 3.37e-15 | 3.68e-01 | 0.1124 |
| 81706 | PPP1R14C | P21T-E | Human | Esophagus | ESCC | 3.06e-32 | 7.72e-01 | 0.1617 |
| 81706 | PPP1R14C | P22T-E | Human | Esophagus | ESCC | 4.93e-11 | 1.37e-01 | 0.1236 |
| 81706 | PPP1R14C | P23T-E | Human | Esophagus | ESCC | 9.66e-05 | 2.40e-01 | 0.108 |
| 81706 | PPP1R14C | P24T-E | Human | Esophagus | ESCC | 4.83e-14 | 4.74e-01 | 0.1287 |
| 81706 | PPP1R14C | P26T-E | Human | Esophagus | ESCC | 2.18e-46 | 9.54e-01 | 0.1276 |
| 81706 | PPP1R14C | P27T-E | Human | Esophagus | ESCC | 1.24e-25 | 6.47e-01 | 0.1055 |
| 81706 | PPP1R14C | P28T-E | Human | Esophagus | ESCC | 5.11e-17 | 5.36e-01 | 0.1149 |
| Page: 1 2 3 4 5 |
| Tissue | Expression Dynamics | Abbreviation |
| Esophagus |  | ESCC: Esophageal squamous cell carcinoma |
| HGIN: High-grade intraepithelial neoplasias | ||
| LGIN: Low-grade intraepithelial neoplasias | ||
| Oral Cavity | 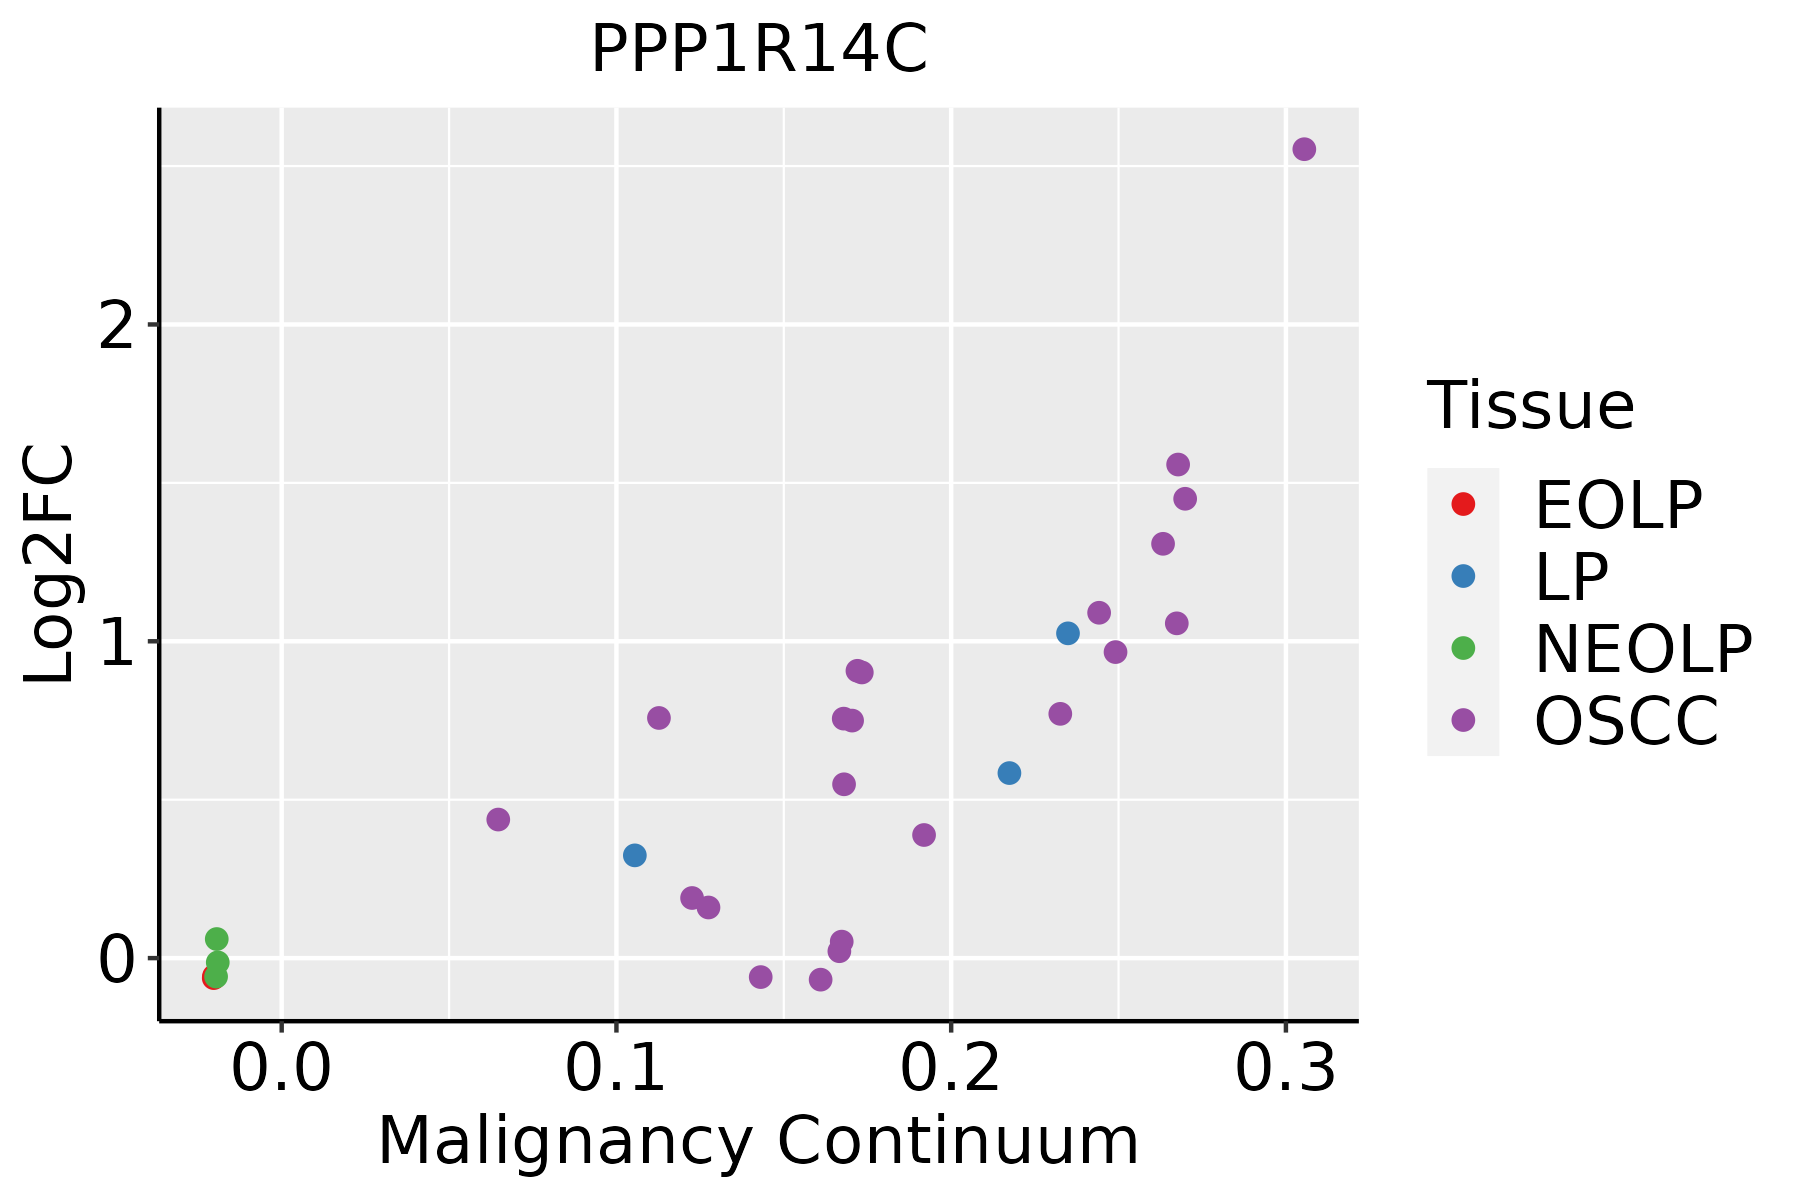 | EOLP: Erosive Oral lichen planus |
| LP: leukoplakia | ||
| NEOLP: Non-erosive oral lichen planus | ||
| OSCC: Oral squamous cell carcinoma | ||
| Skin | 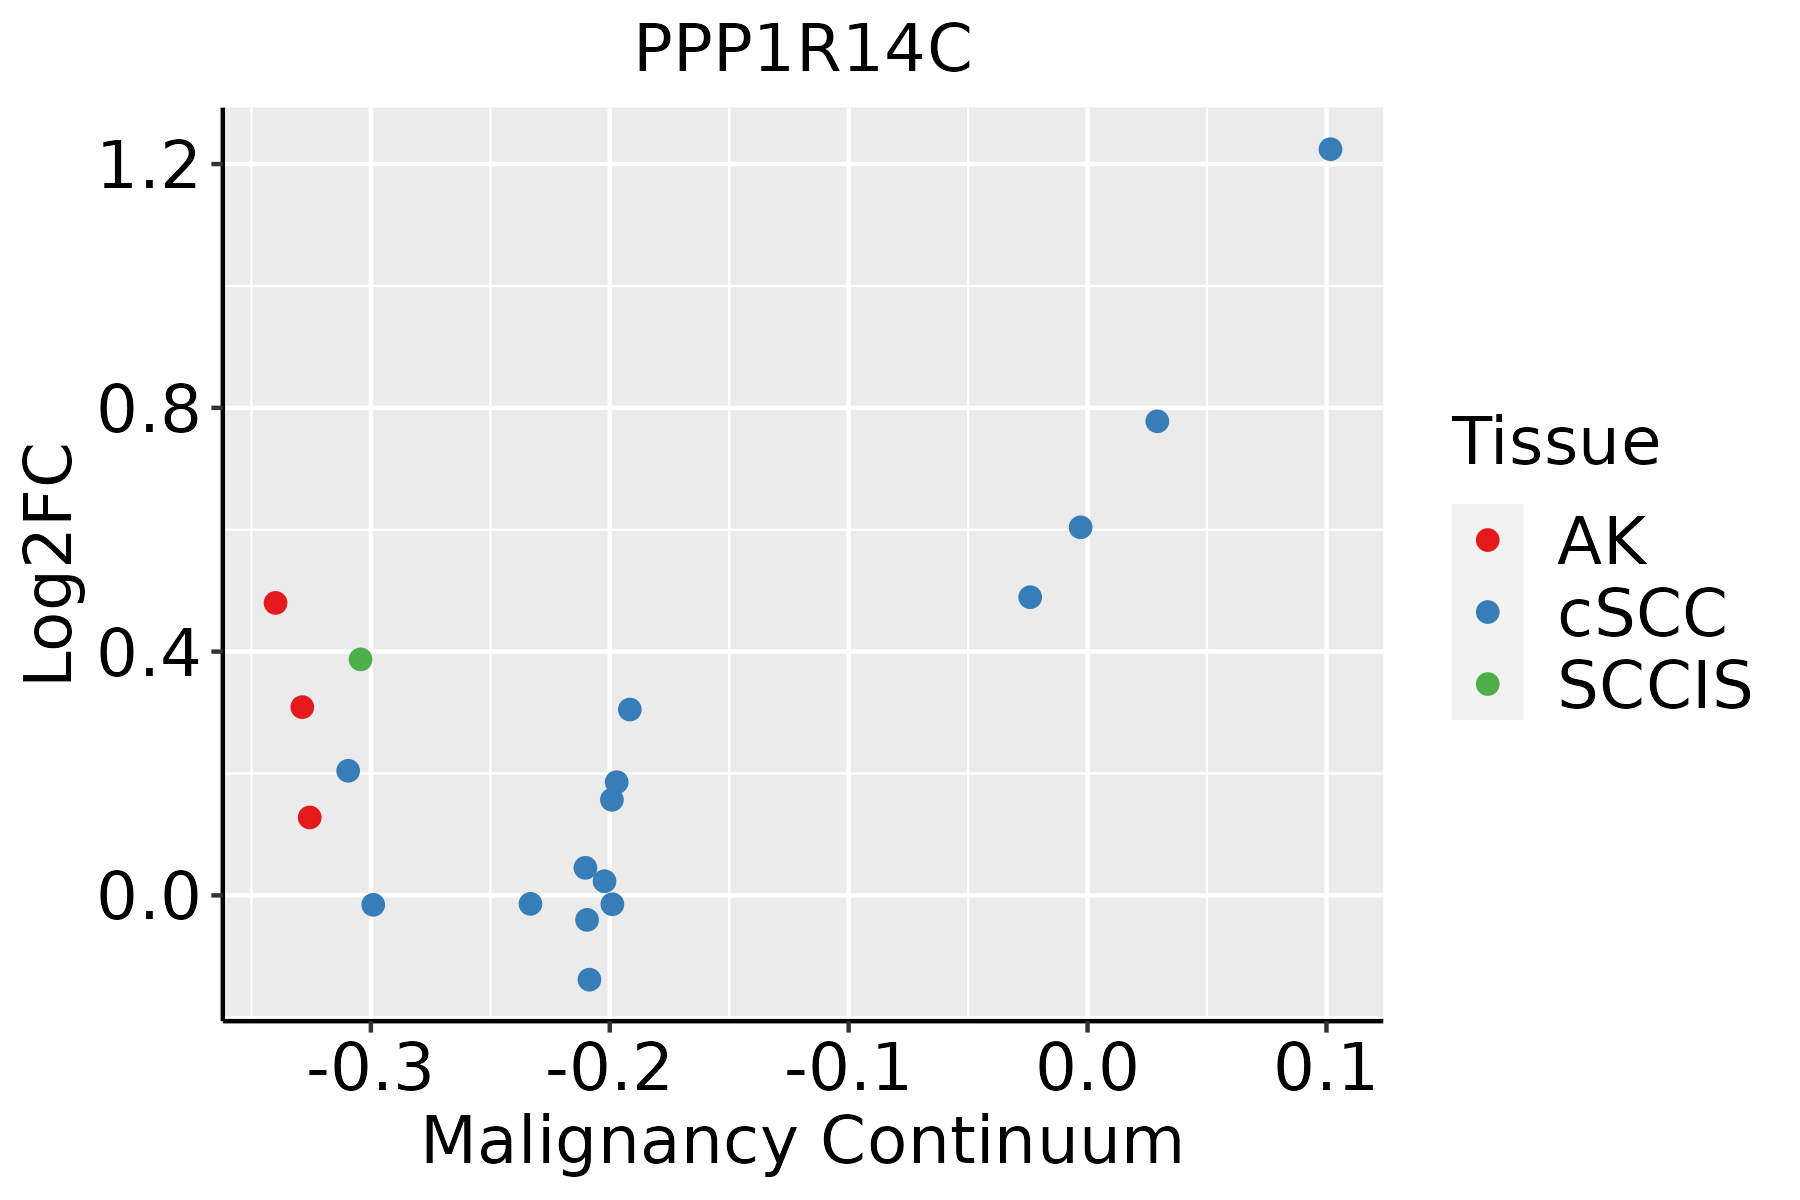 | AK: Actinic keratosis |
| cSCC: Cutaneous squamous cell carcinoma | ||
| SCCIS:squamous cell carcinoma in situ | ||
| Thyroid | 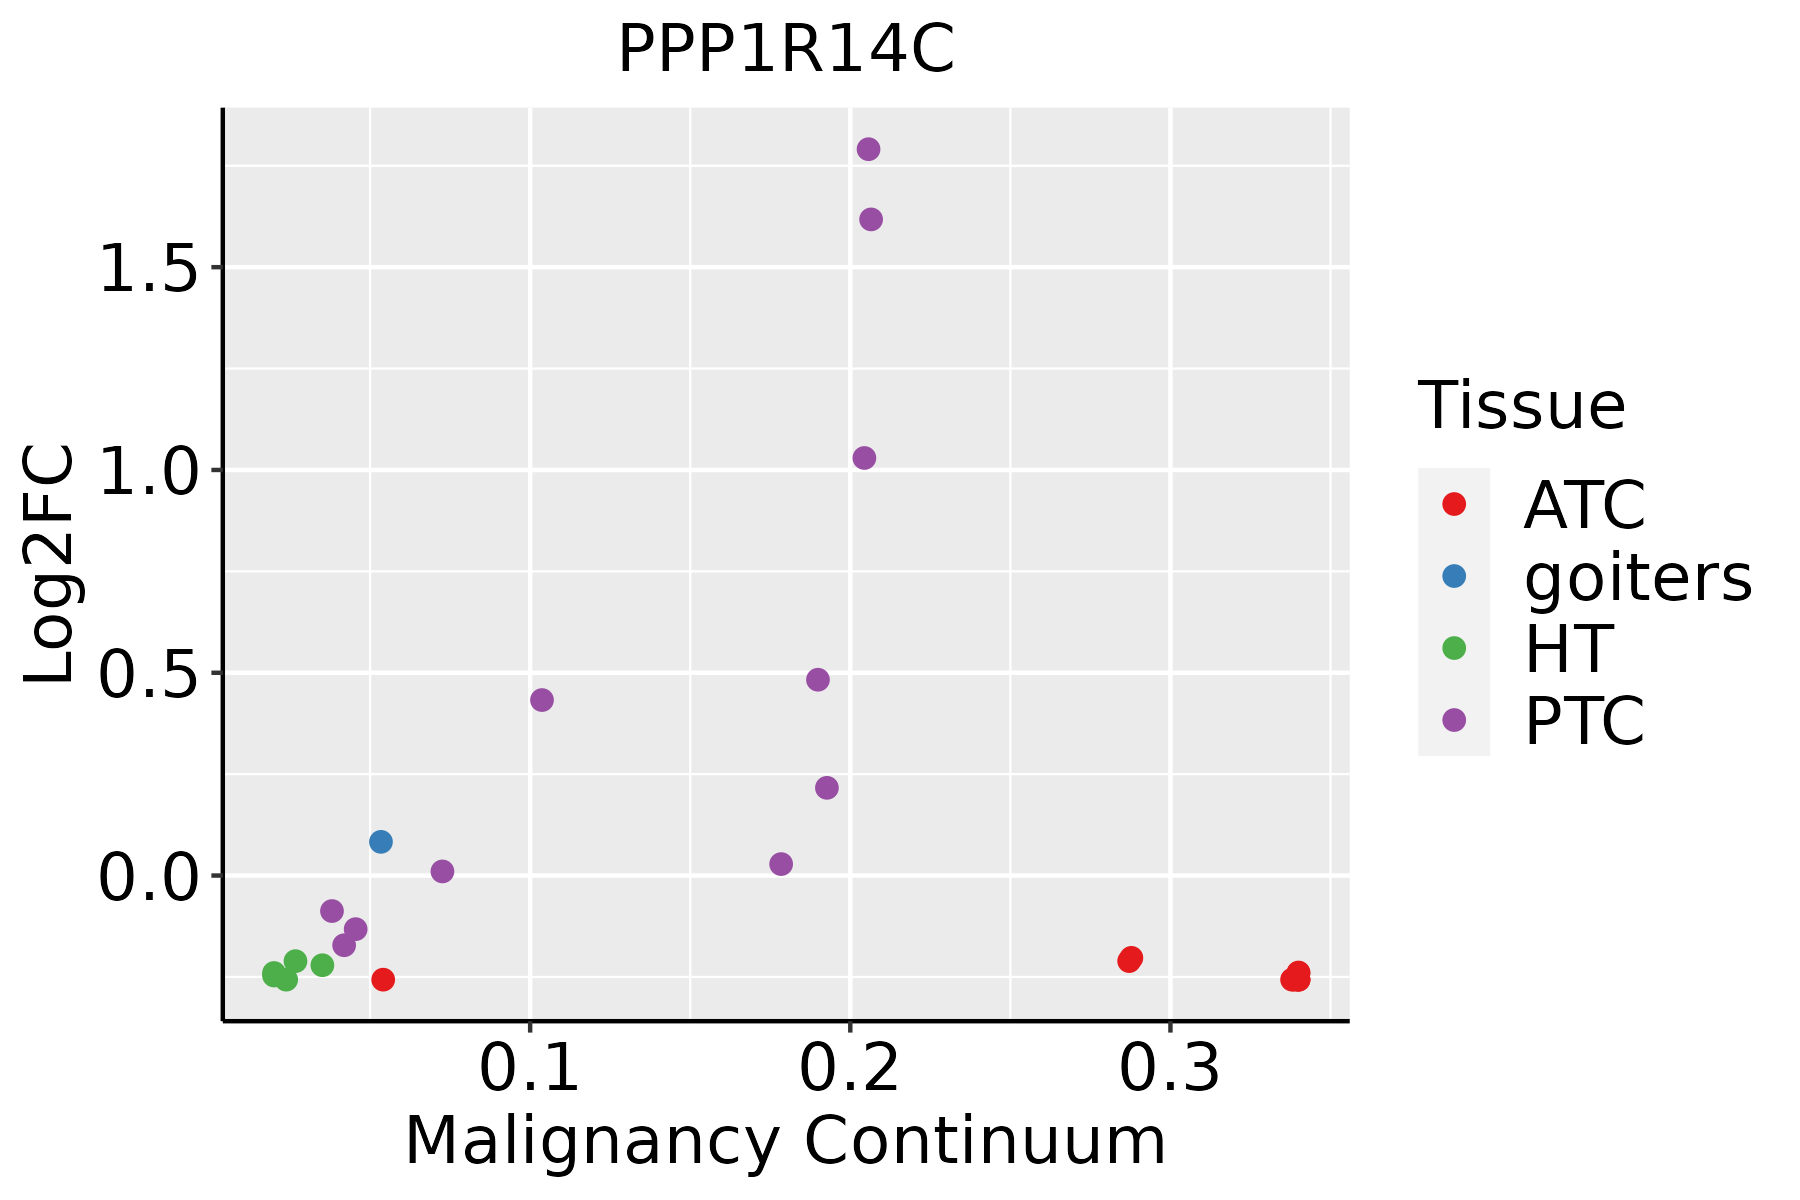 | ATC: Anaplastic thyroid cancer |
| HT: Hashimoto's thyroiditis | ||
| PTC: Papillary thyroid cancer |
| ∗log2FC in expression of this searched gene in stem-like cells from each diseased tissue sample relative to stem-like cells in normal samples in each tissue plotted against the malignancy continuum. Samples are colored based on if they are from different disease stage. |
Top |
Malignant transformation related pathway analysis |
| Find out the enriched GO biological processes and KEGG pathways involved in transition from healthy to precancer to cancer |
| Tissue | Disease Stage | Enriched GO biological Processes |
| Colorectum | AD |  |
| Colorectum | SER |  |
| Colorectum | MSS |  |
| Colorectum | MSI-H |  |
| Colorectum | FAP |  |
| ∗Top 15 enriched GO BP terms are showed in the bar plot of each disease state in each tissue. Each row represents a significant GO biological process which is colored according to the -log10(p.adjust). |
| Page: 1 2 3 4 5 6 7 8 9 |
| GO ID | Tissue | Disease Stage | Description | Gene Ratio | Bg Ratio | pvalue | p.adjust | Count |
| Page: 1 |
| Pathway ID | Tissue | Disease Stage | Description | Gene Ratio | Bg Ratio | pvalue | p.adjust | qvalue | Count |
| Page: 1 |
Top |
Cell-cell communication analysis |
| Identification of potential cell-cell interactions between two cell types and their ligand-receptor pairs for different disease states |
| Ligand | Receptor | LRpair | Pathway | Tissue | Disease Stage |
| Page: 1 |
Top |
Single-cell gene regulatory network inference analysis |
| Find out the significant the regulons (TFs) and the target genes of each regulon across cell types for different disease states |
| TF | Cell Type | Tissue | Disease Stage | Target Gene | RSS | Regulon Activity |
| ∗The dot plots of a searched regulon are shown for all cell subpopulations in each disease state of each tissue based on the regulon specific score inferred using pySCENIC and by calculating the average expression. |
| Page: 1 |
Top |
Somatic mutation of malignant transformation related genes |
| Annotation of somatic variants for genes involved in malignant transformation |
| Hugo Symbol | Variant Class | Variant Classification | dbSNP RS | HGVSc | HGVSp | HGVSp Short | SWISSPROT | BIOTYPE | SIFT | PolyPhen | Tumor Sample Barcode | Tissue | Histology | Sex | Age | Stage | Therapy Types | Drugs | Outcome |
| PPP1R14C | SNV | Missense_Mutation | c.337N>G | p.Ile113Val | p.I113V | Q8TAE6 | protein_coding | tolerated(0.59) | benign(0.097) | TCGA-AA-3710-01 | Colorectum | colon adenocarcinoma | Female | >=65 | I/II | Unknown | Unknown | SD | |
| PPP1R14C | SNV | Missense_Mutation | c.346C>A | p.Leu116Ile | p.L116I | Q8TAE6 | protein_coding | deleterious(0) | probably_damaging(0.999) | TCGA-AP-A059-01 | Endometrium | uterine corpus endometrioid carcinoma | Female | >=65 | I/II | Unknown | Unknown | SD | |
| PPP1R14C | SNV | Missense_Mutation | c.346C>A | p.Leu116Ile | p.L116I | Q8TAE6 | protein_coding | deleterious(0) | probably_damaging(0.999) | TCGA-AP-A1DV-01 | Endometrium | uterine corpus endometrioid carcinoma | Female | <65 | I/II | Unknown | Unknown | SD | |
| PPP1R14C | SNV | Missense_Mutation | novel | c.256N>A | p.Val86Met | p.V86M | Q8TAE6 | protein_coding | tolerated(0.12) | possibly_damaging(0.906) | TCGA-AX-A2HA-01 | Endometrium | uterine corpus endometrioid carcinoma | Female | <65 | I/II | Unknown | Unknown | SD |
| PPP1R14C | SNV | Missense_Mutation | c.356N>T | p.Ala119Val | p.A119V | Q8TAE6 | protein_coding | tolerated(0.77) | benign(0.042) | TCGA-D1-A174-01 | Endometrium | uterine corpus endometrioid carcinoma | Female | <65 | I/II | Unknown | Unknown | SD | |
| PPP1R14C | SNV | Missense_Mutation | novel | c.161N>T | p.Ala54Val | p.A54V | Q8TAE6 | protein_coding | tolerated(0.25) | benign(0.042) | TCGA-EO-A22X-01 | Endometrium | uterine corpus endometrioid carcinoma | Female | <65 | III/IV | Unspecific | Carboplatin | Complete Response |
| PPP1R14C | SNV | Missense_Mutation | novel | c.382N>C | p.Lys128Gln | p.K128Q | Q8TAE6 | protein_coding | tolerated(0.06) | possibly_damaging(0.905) | TCGA-EO-A3AV-01 | Endometrium | uterine corpus endometrioid carcinoma | Female | <65 | III/IV | Chemotherapy | carboplatin | CR |
| PPP1R14C | SNV | Missense_Mutation | novel | c.428N>G | p.Phe143Cys | p.F143C | Q8TAE6 | protein_coding | deleterious(0) | probably_damaging(0.998) | TCGA-EO-A3B0-01 | Endometrium | uterine corpus endometrioid carcinoma | Female | <65 | III/IV | Unknown | Unknown | SD |
| PPP1R14C | SNV | Missense_Mutation | c.449G>T | p.Arg150Leu | p.R150L | Q8TAE6 | protein_coding | deleterious(0) | probably_damaging(0.974) | TCGA-EY-A1GF-01 | Endometrium | uterine corpus endometrioid carcinoma | Female | >=65 | I/II | Unknown | Unknown | SD | |
| PPP1R14C | SNV | Missense_Mutation | rs766379125 | c.449G>A | p.Arg150Gln | p.R150Q | Q8TAE6 | protein_coding | deleterious(0.02) | probably_damaging(0.955) | TCGA-WW-A8ZI-01 | Prostate | prostate adenocarcinoma | Male | >=65 | 8 | Unknown | Unknown | SD |
| Page: 1 2 |
Top |
Related drugs of malignant transformation related genes |
| Identification of chemicals and drugs interact with genes involved in malignant transfromation |
| (DGIdb 4.0) |
| Entrez ID | Symbol | Category | Interaction Types | Drug Claim Name | Drug Name | PMIDs |
| Page: 1 |

Copyright 2023-Present -The University of Texas Health Science Center at Houston |