
|
|||||
|
 | |
| |
| |
| |
| |
| |
|
Gene: PPP1R14A |
Gene summary for PPP1R14A |
| Gene information | Species | Human | Gene symbol | PPP1R14A | Gene ID | 94274 |
| Gene name | protein phosphatase 1 regulatory inhibitor subunit 14A | |
| Gene Alias | CPI-17 | |
| Cytomap | 19q13.2 | |
| Gene Type | protein-coding | GO ID | GO:0006793 | UniProtAcc | Q96A00 |
Top |
Malignant transformation analysis |
| Identification of the aberrant gene expression in precancerous and cancerous lesions by comparing the gene expression of stem-like cells in diseased tissues with normal stem cells |
| Entrez ID | Symbol | Replicates | Species | Organ | Tissue | Adj P-value | Log2FC | Malignancy |
| 94274 | PPP1R14A | AEH-subject1 | Human | Endometrium | AEH | 4.08e-18 | -4.57e-01 | -0.3059 |
| 94274 | PPP1R14A | AEH-subject2 | Human | Endometrium | AEH | 2.14e-22 | -4.76e-01 | -0.2525 |
| 94274 | PPP1R14A | AEH-subject3 | Human | Endometrium | AEH | 1.87e-16 | -4.16e-01 | -0.2576 |
| 94274 | PPP1R14A | AEH-subject4 | Human | Endometrium | AEH | 1.52e-07 | -3.32e-01 | -0.2657 |
| 94274 | PPP1R14A | AEH-subject5 | Human | Endometrium | AEH | 1.94e-20 | -4.62e-01 | -0.2953 |
| 94274 | PPP1R14A | EEC-subject1 | Human | Endometrium | EEC | 8.58e-12 | -3.49e-01 | -0.2682 |
| 94274 | PPP1R14A | EEC-subject2 | Human | Endometrium | EEC | 3.20e-21 | -4.60e-01 | -0.2607 |
| 94274 | PPP1R14A | EEC-subject3 | Human | Endometrium | EEC | 3.40e-33 | -4.13e-01 | -0.2525 |
| 94274 | PPP1R14A | EEC-subject4 | Human | Endometrium | EEC | 1.12e-13 | -3.81e-01 | -0.2571 |
| 94274 | PPP1R14A | EEC-subject5 | Human | Endometrium | EEC | 1.21e-23 | -4.70e-01 | -0.249 |
| 94274 | PPP1R14A | GSM5276934 | Human | Endometrium | EEC | 2.23e-13 | -3.63e-01 | -0.0913 |
| 94274 | PPP1R14A | GSM5276937 | Human | Endometrium | EEC | 7.34e-15 | -4.24e-01 | -0.0897 |
| 94274 | PPP1R14A | GSM6177620_NYU_UCEC1_lib1_lib1 | Human | Endometrium | EEC | 4.13e-22 | -4.90e-01 | -0.1869 |
| 94274 | PPP1R14A | GSM6177620_NYU_UCEC1_lib2_lib2 | Human | Endometrium | EEC | 4.06e-20 | -4.84e-01 | -0.1875 |
| 94274 | PPP1R14A | GSM6177620_NYU_UCEC1_lib3_lib3 | Human | Endometrium | EEC | 7.87e-26 | -5.02e-01 | -0.1883 |
| 94274 | PPP1R14A | GSM6177621_NYU_UCEC2_lib1_lib1 | Human | Endometrium | EEC | 1.90e-23 | -3.79e-01 | -0.1934 |
| 94274 | PPP1R14A | GSM6177622_NYU_UCEC3_lib1_lib1 | Human | Endometrium | EEC | 1.95e-33 | -5.02e-01 | -0.1917 |
| 94274 | PPP1R14A | GSM6177622_NYU_UCEC3_lib2_lib2 | Human | Endometrium | EEC | 1.52e-28 | -4.90e-01 | -0.1916 |
| 94274 | PPP1R14A | GSM6177623_NYU_UCEC3_Vis | Human | Endometrium | EEC | 1.22e-21 | -4.61e-01 | -0.1269 |
| 94274 | PPP1R14A | LZE22T | Human | Esophagus | ESCC | 1.57e-03 | 2.74e-01 | 0.068 |
| Page: 1 2 3 |
| Tissue | Expression Dynamics | Abbreviation |
| Endometrium | 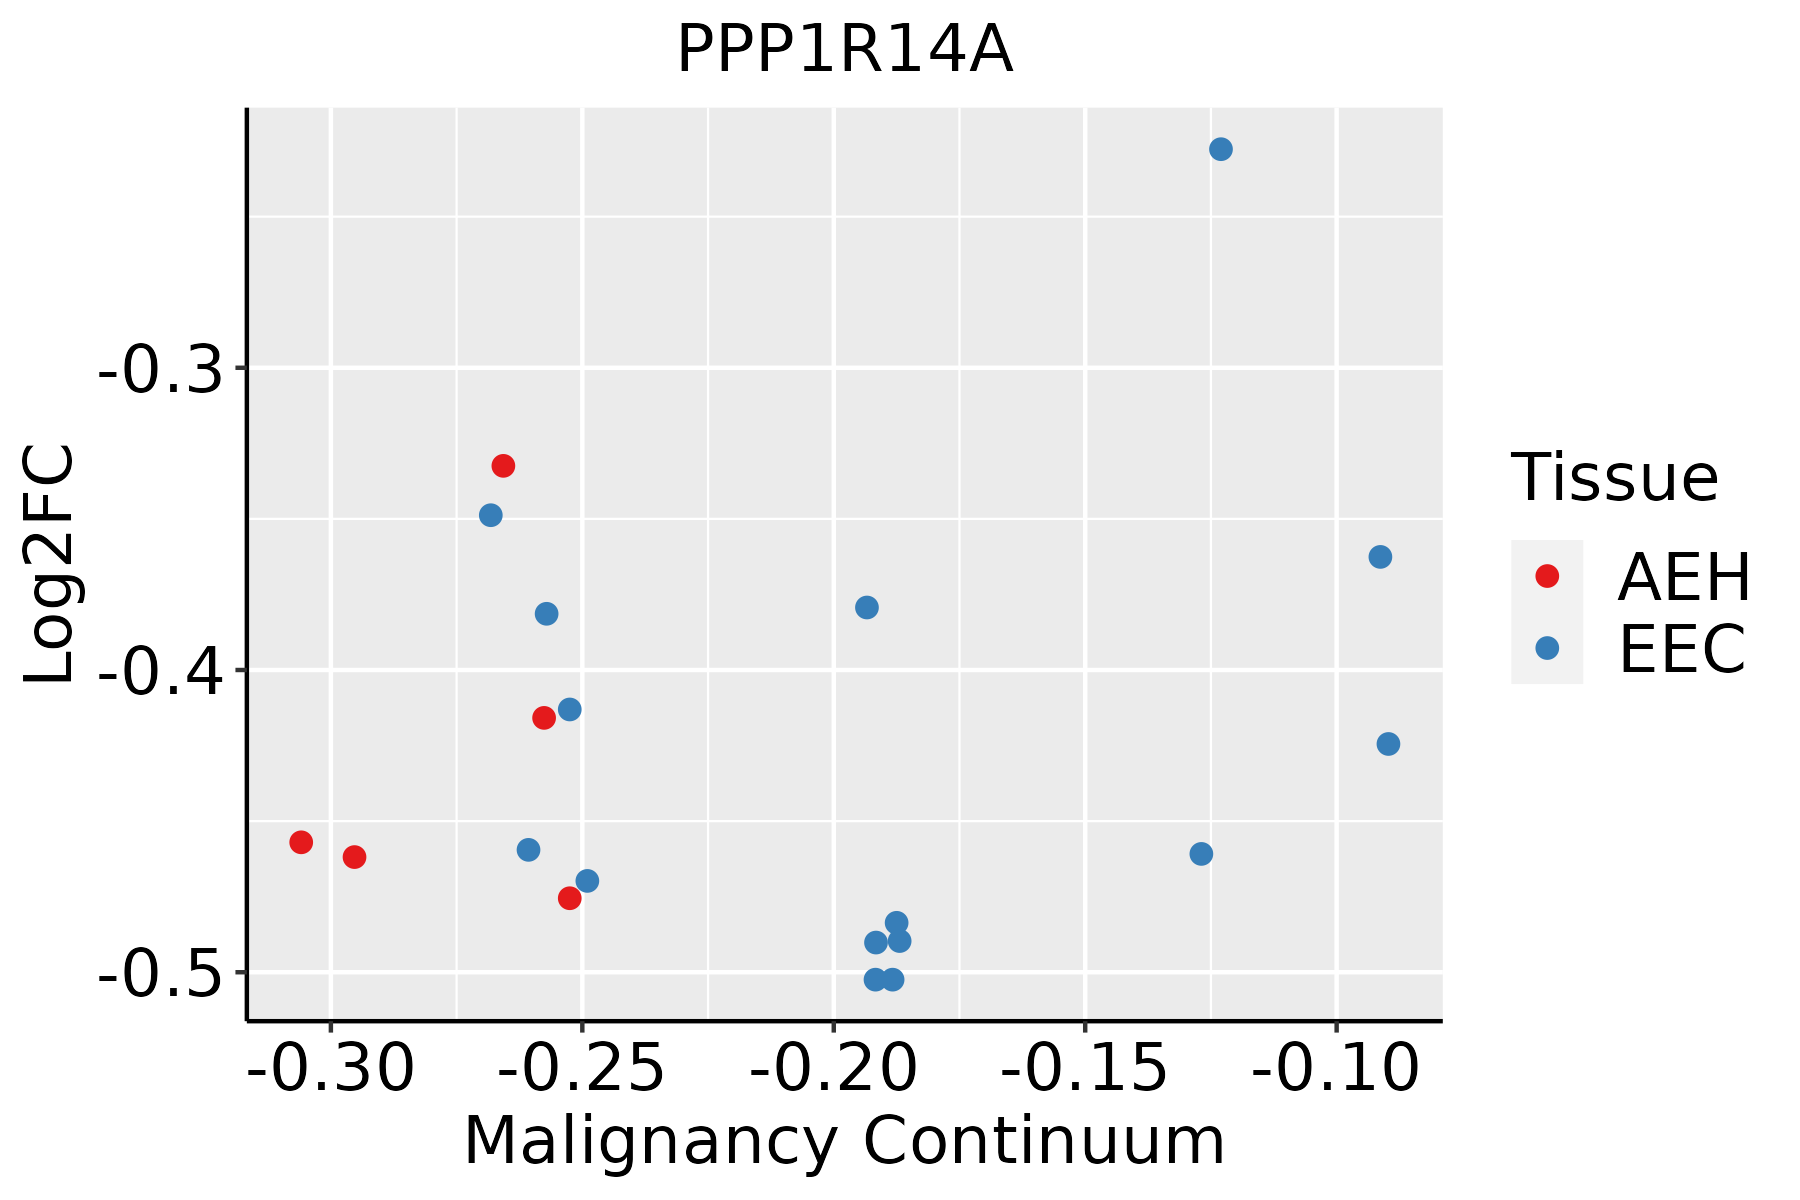 | AEH: Atypical endometrial hyperplasia |
| EEC: Endometrioid Cancer | ||
| Esophagus | 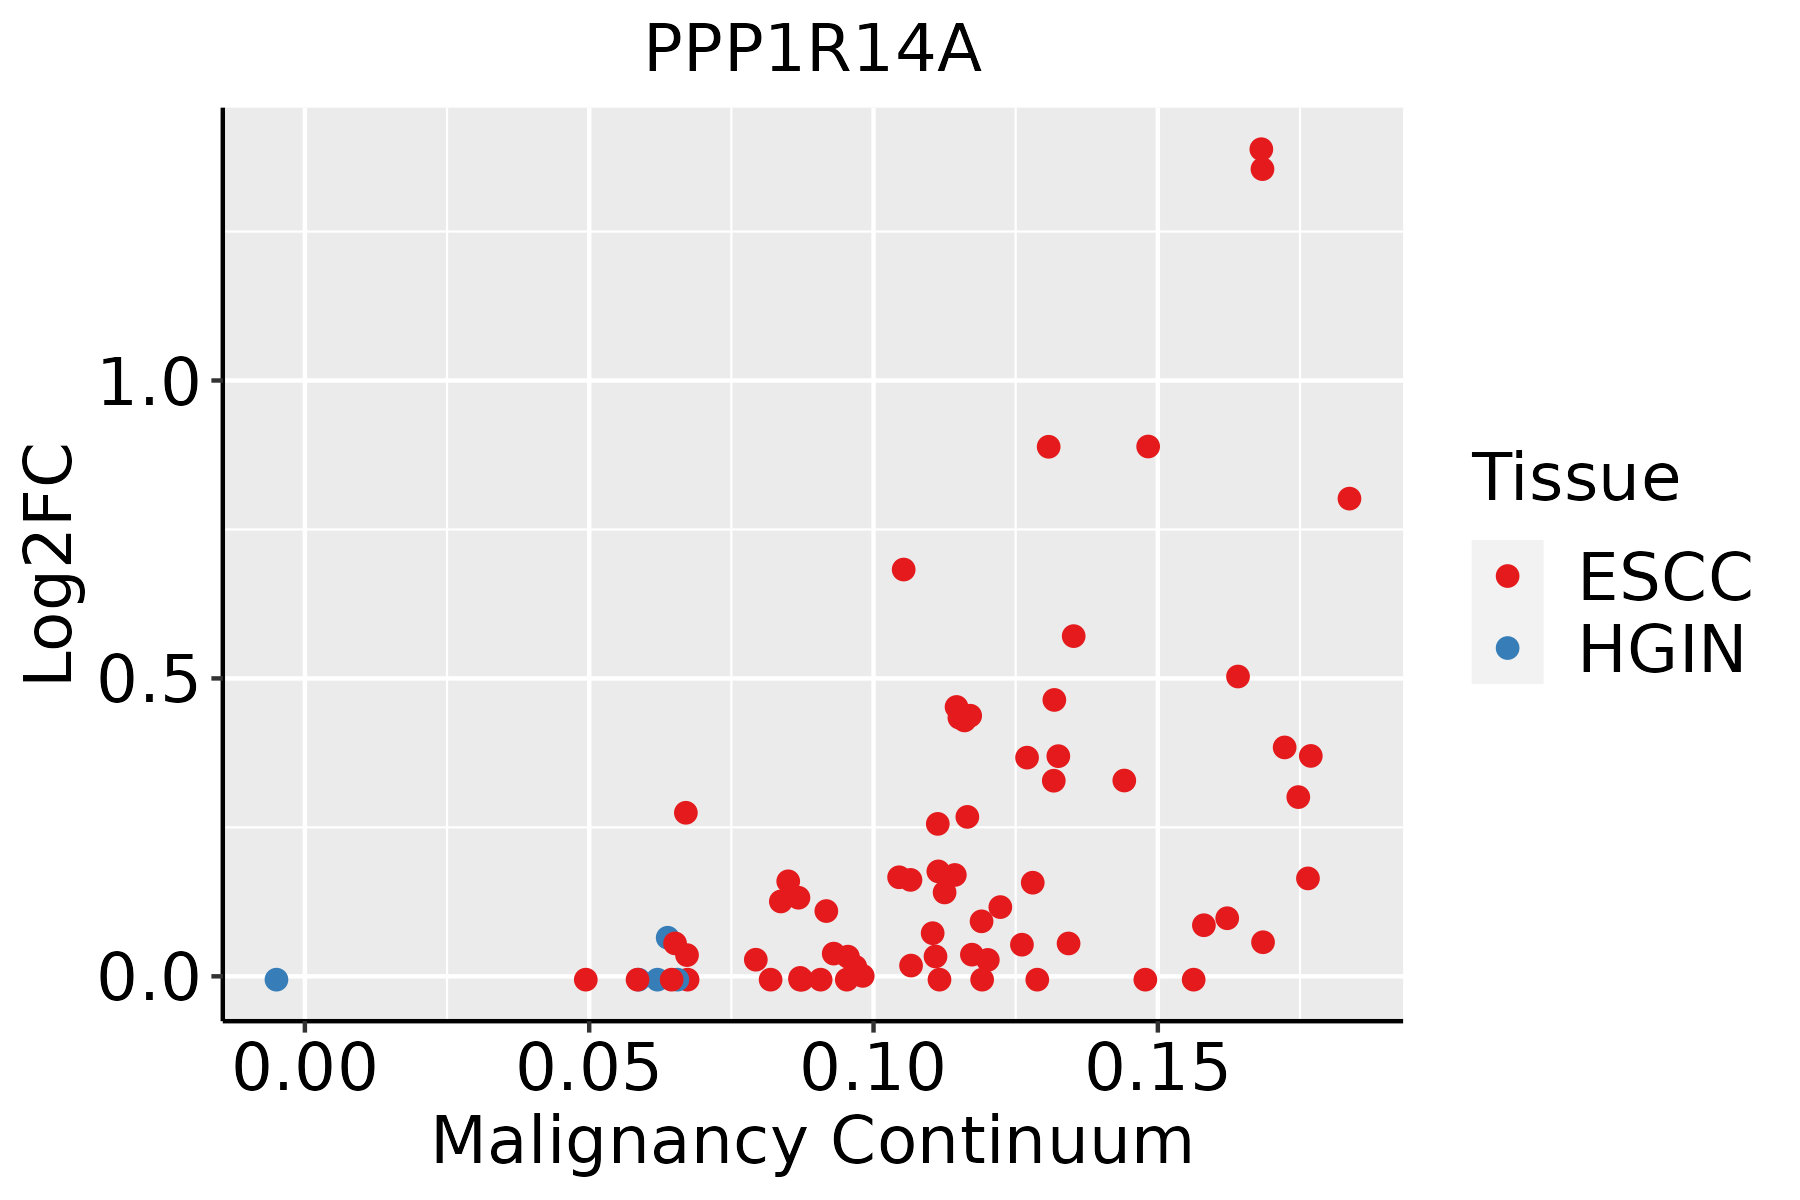 | ESCC: Esophageal squamous cell carcinoma |
| HGIN: High-grade intraepithelial neoplasias | ||
| LGIN: Low-grade intraepithelial neoplasias | ||
| Liver | 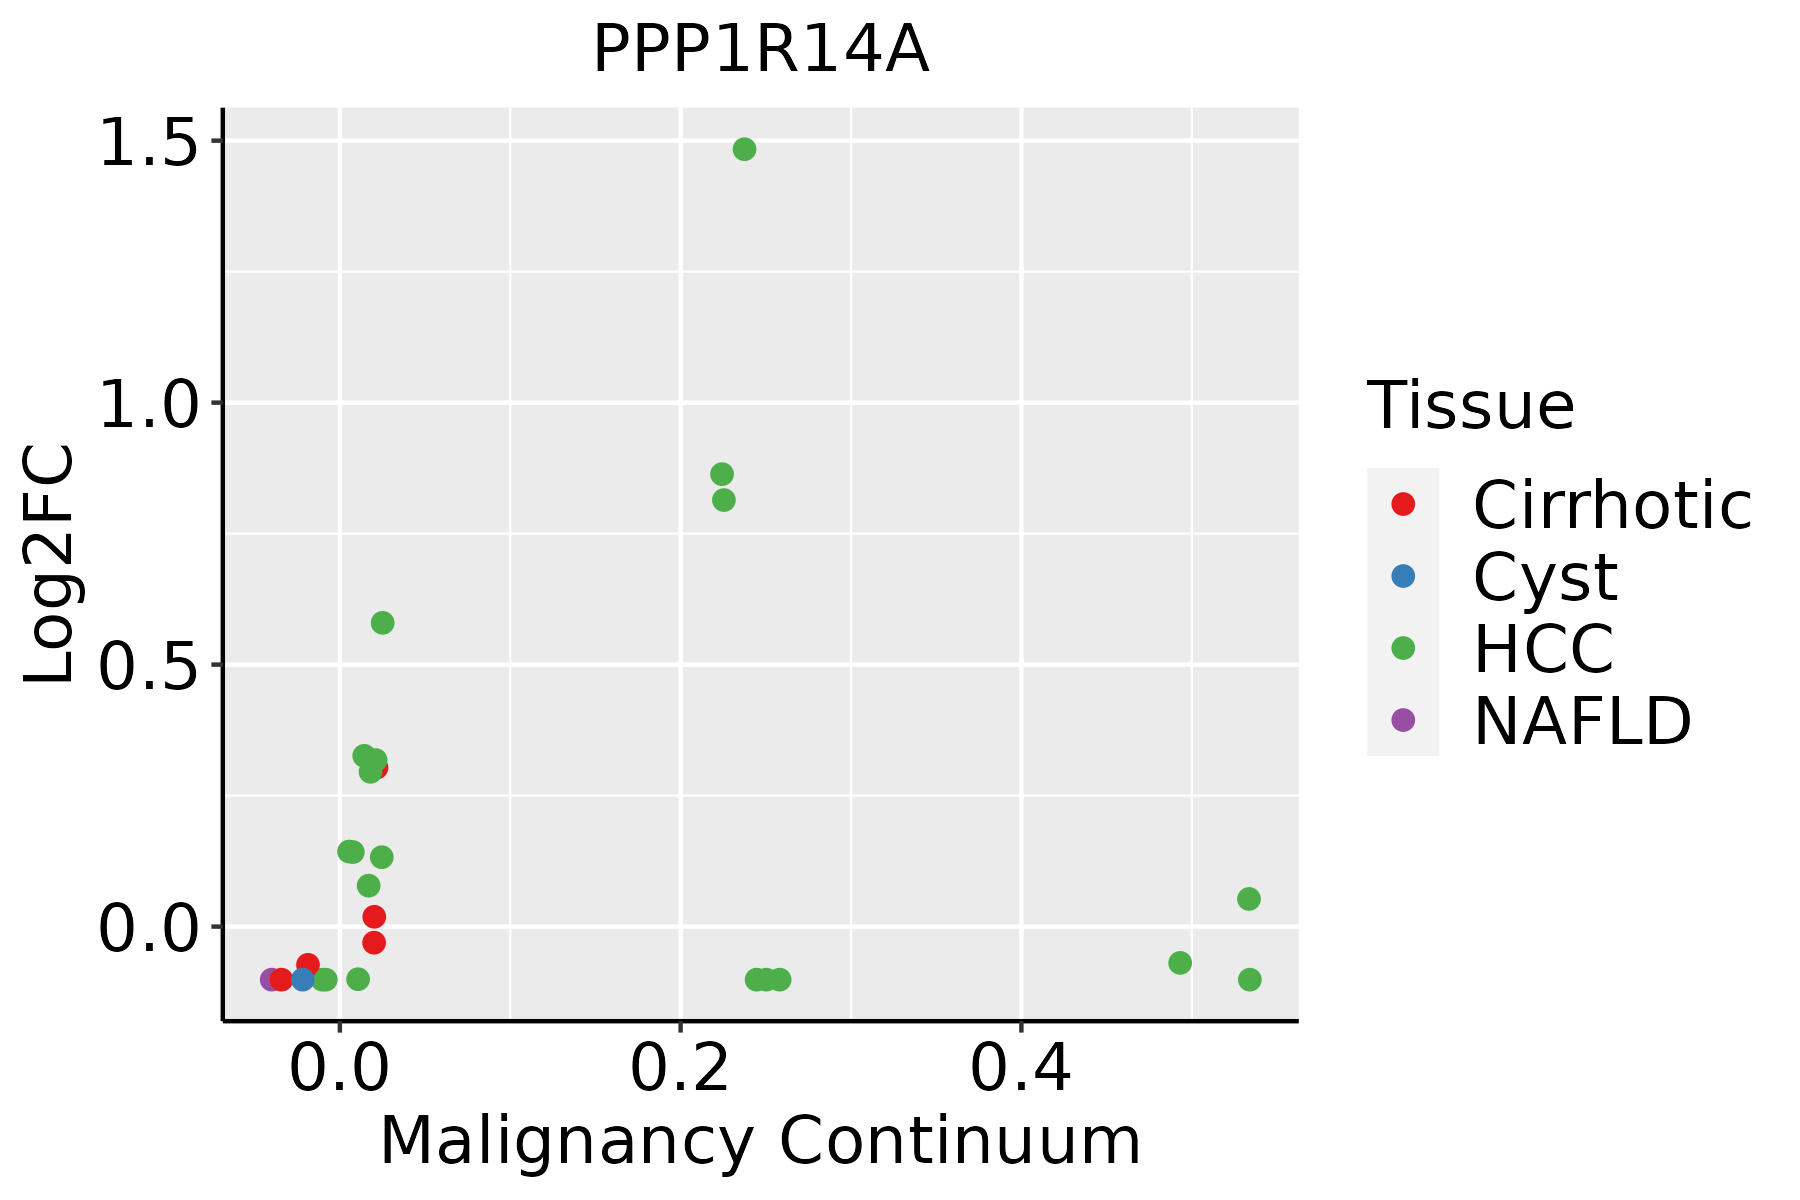 | HCC: Hepatocellular carcinoma |
| NAFLD: Non-alcoholic fatty liver disease | ||
| Thyroid | 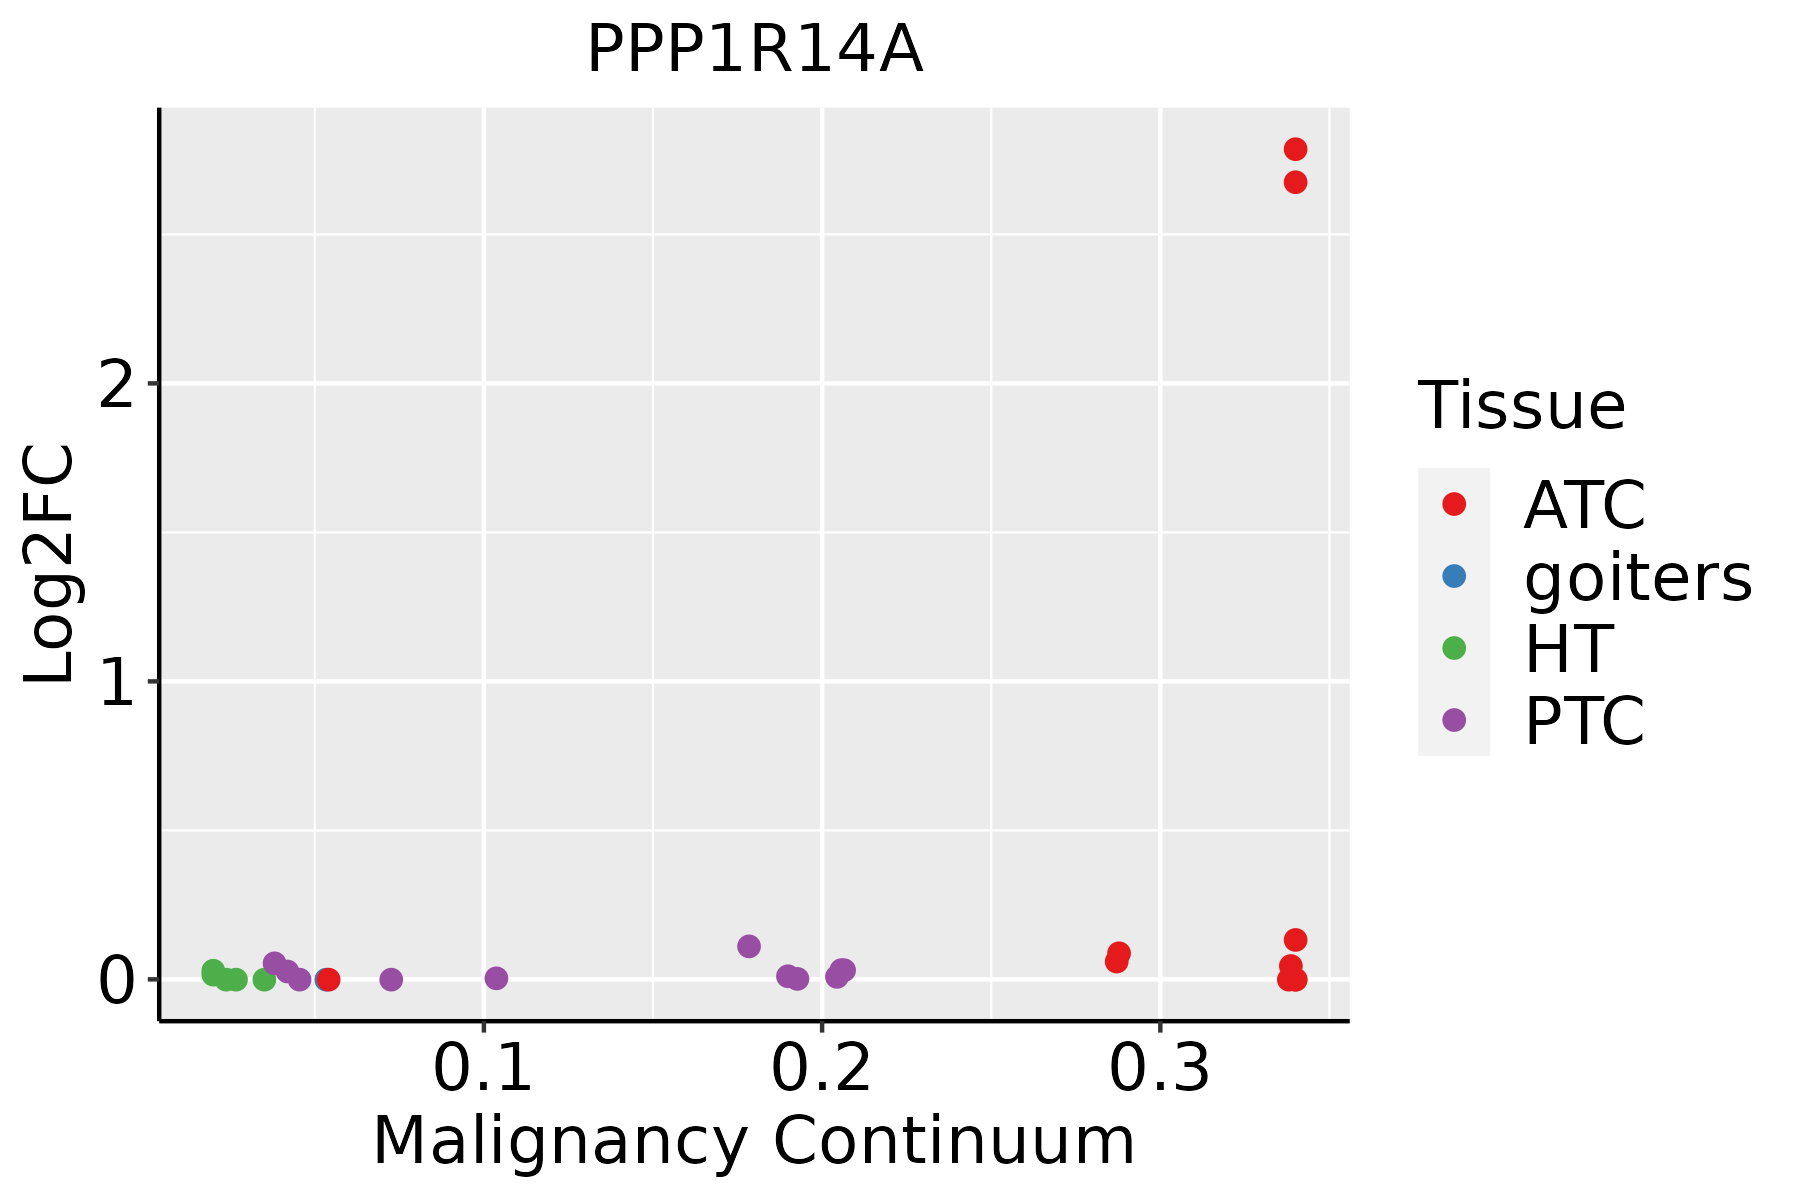 | ATC: Anaplastic thyroid cancer |
| HT: Hashimoto's thyroiditis | ||
| PTC: Papillary thyroid cancer |
| ∗log2FC in expression of this searched gene in stem-like cells from each diseased tissue sample relative to stem-like cells in normal samples in each tissue plotted against the malignancy continuum. Samples are colored based on if they are from different disease stage. |
Top |
Malignant transformation related pathway analysis |
| Find out the enriched GO biological processes and KEGG pathways involved in transition from healthy to precancer to cancer |
| Tissue | Disease Stage | Enriched GO biological Processes |
| Colorectum | AD |  |
| Colorectum | SER |  |
| Colorectum | MSS |  |
| Colorectum | MSI-H |  |
| Colorectum | FAP |  |
| ∗Top 15 enriched GO BP terms are showed in the bar plot of each disease state in each tissue. Each row represents a significant GO biological process which is colored according to the -log10(p.adjust). |
| Page: 1 2 3 4 5 6 7 8 9 |
| GO ID | Tissue | Disease Stage | Description | Gene Ratio | Bg Ratio | pvalue | p.adjust | Count |
| Page: 1 |
| Pathway ID | Tissue | Disease Stage | Description | Gene Ratio | Bg Ratio | pvalue | p.adjust | qvalue | Count |
| Page: 1 |
Top |
Cell-cell communication analysis |
| Identification of potential cell-cell interactions between two cell types and their ligand-receptor pairs for different disease states |
| Ligand | Receptor | LRpair | Pathway | Tissue | Disease Stage |
| Page: 1 |
Top |
Single-cell gene regulatory network inference analysis |
| Find out the significant the regulons (TFs) and the target genes of each regulon across cell types for different disease states |
| TF | Cell Type | Tissue | Disease Stage | Target Gene | RSS | Regulon Activity |
| ∗The dot plots of a searched regulon are shown for all cell subpopulations in each disease state of each tissue based on the regulon specific score inferred using pySCENIC and by calculating the average expression. |
| Page: 1 |
Top |
Somatic mutation of malignant transformation related genes |
| Annotation of somatic variants for genes involved in malignant transformation |
| Hugo Symbol | Variant Class | Variant Classification | dbSNP RS | HGVSc | HGVSp | HGVSp Short | SWISSPROT | BIOTYPE | SIFT | PolyPhen | Tumor Sample Barcode | Tissue | Histology | Sex | Age | Stage | Therapy Types | Drugs | Outcome |
| PPP1R14A | insertion | Frame_Shift_Ins | novel | c.225_226insTTTGCTTATGGCTTATACCTTTTTAGAGGAGGGAAGT | p.Asn76PhefsTer13 | p.N76Ffs*13 | Q96A00 | protein_coding | TCGA-A7-A0CE-01 | Breast | breast invasive carcinoma | Female | <65 | I/II | Chemotherapy | adriamycin | SD | ||
| PPP1R14A | SNV | Missense_Mutation | c.385N>A | p.Pro129Thr | p.P129T | Q96A00 | protein_coding | tolerated(0.45) | possibly_damaging(0.76) | TCGA-EK-A3GM-01 | Cervix | cervical & endocervical cancer | Female | >=65 | I/II | Unknown | Unknown | SD | |
| PPP1R14A | SNV | Missense_Mutation | c.143N>A | p.Arg48Gln | p.R48Q | Q96A00 | protein_coding | deleterious(0.01) | probably_damaging(0.909) | TCGA-A6-2686-01 | Colorectum | colon adenocarcinoma | Female | >=65 | I/II | Unknown | Unknown | SD | |
| PPP1R14A | SNV | Missense_Mutation | c.106N>T | p.Arg36Cys | p.R36C | Q96A00 | protein_coding | deleterious(0) | probably_damaging(0.999) | TCGA-AD-6889-01 | Colorectum | colon adenocarcinoma | Male | >=65 | I/II | Chemotherapy | xeloda | PD | |
| PPP1R14A | SNV | Missense_Mutation | rs778078888 | c.438N>A | p.His146Gln | p.H146Q | Q96A00 | protein_coding | tolerated_low_confidence(0.27) | benign(0.007) | TCGA-D5-6540-01 | Colorectum | colon adenocarcinoma | Male | >=65 | I/II | Unknown | Unknown | SD |
| PPP1R14A | SNV | Missense_Mutation | novel | c.346C>A | p.Gln116Lys | p.Q116K | Q96A00 | protein_coding | tolerated(0.1) | benign(0.001) | TCGA-F5-6814-01 | Colorectum | rectum adenocarcinoma | Male | <65 | I/II | Unknown | Unknown | SD |
| PPP1R14A | SNV | Missense_Mutation | c.308N>A | p.Pro103His | p.P103H | Q96A00 | protein_coding | deleterious(0) | benign(0.353) | TCGA-AP-A051-01 | Endometrium | uterine corpus endometrioid carcinoma | Female | >=65 | I/II | Unknown | Unknown | SD | |
| PPP1R14A | SNV | Missense_Mutation | c.130C>T | p.Arg44Trp | p.R44W | Q96A00 | protein_coding | deleterious(0) | probably_damaging(0.981) | TCGA-AP-A1DK-01 | Endometrium | uterine corpus endometrioid carcinoma | Female | <65 | I/II | Unknown | Unknown | SD | |
| PPP1R14A | SNV | Missense_Mutation | rs576186615 | c.217N>A | p.Asp73Asn | p.D73N | Q96A00 | protein_coding | tolerated(0.07) | probably_damaging(0.954) | TCGA-AX-A2HC-01 | Endometrium | uterine corpus endometrioid carcinoma | Female | <65 | III/IV | Chemotherapy | paclitaxel | PD |
| PPP1R14A | SNV | Missense_Mutation | novel | c.295N>C | p.Ser99Pro | p.S99P | Q96A00 | protein_coding | tolerated(0.06) | possibly_damaging(0.522) | TCGA-D1-A175-01 | Endometrium | uterine corpus endometrioid carcinoma | Female | <65 | I/II | Chemotherapy | paclitaxel | SD |
| Page: 1 2 |
Top |
Related drugs of malignant transformation related genes |
| Identification of chemicals and drugs interact with genes involved in malignant transfromation |
| (DGIdb 4.0) |
| Entrez ID | Symbol | Category | Interaction Types | Drug Claim Name | Drug Name | PMIDs |
| Page: 1 |

Copyright 2023-Present -The University of Texas Health Science Center at Houston |