
|
|||||
|
 | |
| |
| |
| |
| |
| |
|
Gene: PPP1R13L |
Gene summary for PPP1R13L |
| Gene information | Species | Human | Gene symbol | PPP1R13L | Gene ID | 10848 |
| Gene name | protein phosphatase 1 regulatory subunit 13 like | |
| Gene Alias | IASPP | |
| Cytomap | 19q13.32 | |
| Gene Type | protein-coding | GO ID | GO:0000122 | UniProtAcc | A0A024R0Q5 |
Top |
Malignant transformation analysis |
| Identification of the aberrant gene expression in precancerous and cancerous lesions by comparing the gene expression of stem-like cells in diseased tissues with normal stem cells |
| Entrez ID | Symbol | Replicates | Species | Organ | Tissue | Adj P-value | Log2FC | Malignancy |
| 10848 | PPP1R13L | CA_HPV_1 | Human | Cervix | CC | 2.57e-03 | -1.51e-01 | 0.0264 |
| 10848 | PPP1R13L | CCI_1 | Human | Cervix | CC | 3.71e-05 | 5.46e-01 | 0.528 |
| 10848 | PPP1R13L | CCI_2 | Human | Cervix | CC | 1.56e-08 | 8.17e-01 | 0.5249 |
| 10848 | PPP1R13L | CCI_3 | Human | Cervix | CC | 9.21e-11 | 7.44e-01 | 0.516 |
| 10848 | PPP1R13L | Tumor | Human | Cervix | CC | 4.24e-05 | 3.62e-01 | 0.1241 |
| 10848 | PPP1R13L | sample3 | Human | Cervix | CC | 3.22e-17 | 4.41e-01 | 0.1387 |
| 10848 | PPP1R13L | T3 | Human | Cervix | CC | 2.31e-16 | 4.27e-01 | 0.1389 |
| 10848 | PPP1R13L | LZE4T | Human | Esophagus | ESCC | 1.51e-03 | 1.39e-01 | 0.0811 |
| 10848 | PPP1R13L | LZE20T | Human | Esophagus | ESCC | 4.99e-11 | 3.05e-01 | 0.0662 |
| 10848 | PPP1R13L | LZE22D1 | Human | Esophagus | HGIN | 8.46e-03 | 2.94e-01 | 0.0595 |
| 10848 | PPP1R13L | LZE22T | Human | Esophagus | ESCC | 7.24e-04 | 4.30e-01 | 0.068 |
| 10848 | PPP1R13L | LZE24T | Human | Esophagus | ESCC | 7.09e-18 | 6.43e-01 | 0.0596 |
| 10848 | PPP1R13L | LZE21T | Human | Esophagus | ESCC | 3.57e-03 | 2.34e-01 | 0.0655 |
| 10848 | PPP1R13L | P1T-E | Human | Esophagus | ESCC | 2.79e-09 | 8.90e-01 | 0.0875 |
| 10848 | PPP1R13L | P2T-E | Human | Esophagus | ESCC | 1.22e-17 | 4.01e-01 | 0.1177 |
| 10848 | PPP1R13L | P4T-E | Human | Esophagus | ESCC | 3.44e-11 | 2.67e-01 | 0.1323 |
| 10848 | PPP1R13L | P5T-E | Human | Esophagus | ESCC | 1.43e-16 | 3.69e-01 | 0.1327 |
| 10848 | PPP1R13L | P8T-E | Human | Esophagus | ESCC | 3.48e-71 | 1.40e+00 | 0.0889 |
| 10848 | PPP1R13L | P9T-E | Human | Esophagus | ESCC | 2.21e-05 | 1.40e-01 | 0.1131 |
| 10848 | PPP1R13L | P10T-E | Human | Esophagus | ESCC | 3.65e-42 | 8.09e-01 | 0.116 |
| Page: 1 2 3 4 5 6 7 |
| Tissue | Expression Dynamics | Abbreviation |
| Cervix |  | CC: Cervix cancer |
| HSIL_HPV: HPV-infected high-grade squamous intraepithelial lesions | ||
| N_HPV: HPV-infected normal cervix | ||
| Esophagus | 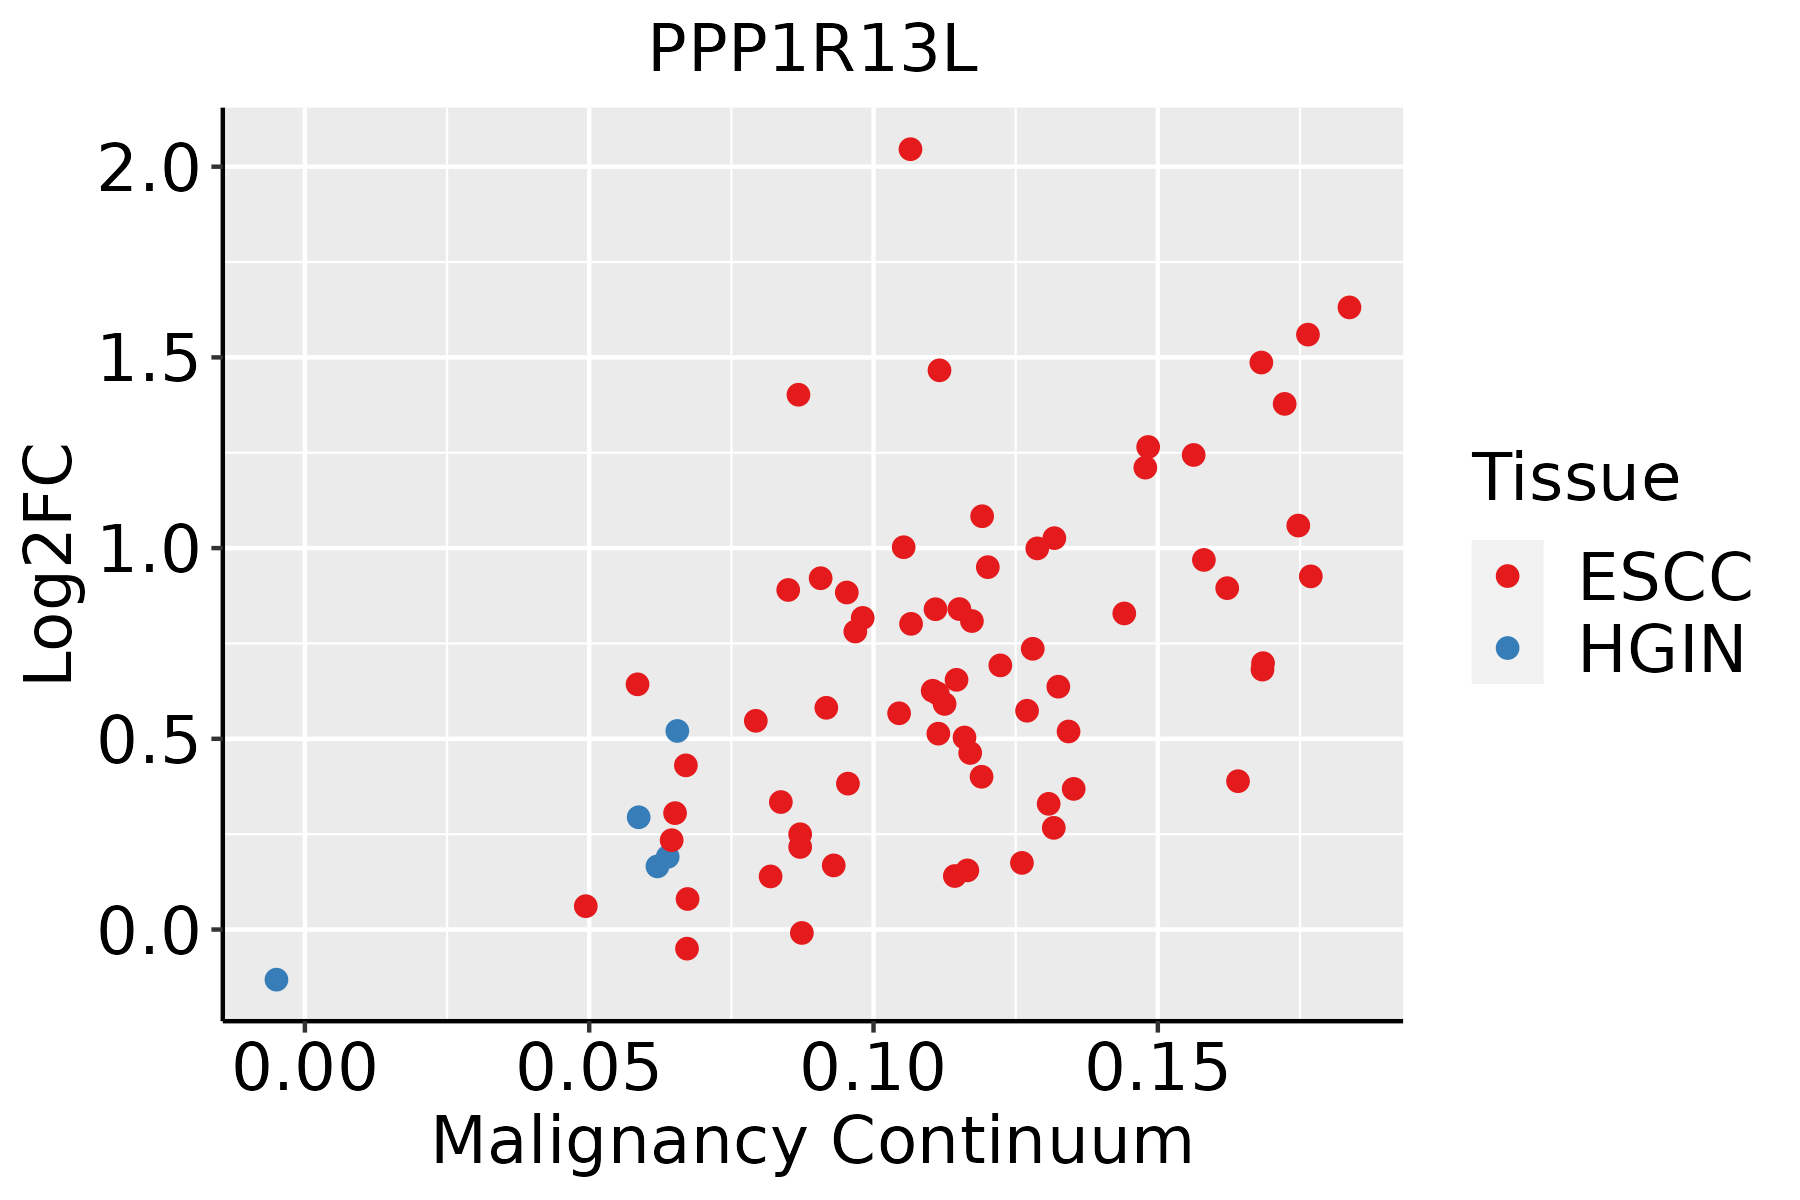 | ESCC: Esophageal squamous cell carcinoma |
| HGIN: High-grade intraepithelial neoplasias | ||
| LGIN: Low-grade intraepithelial neoplasias | ||
| Liver | 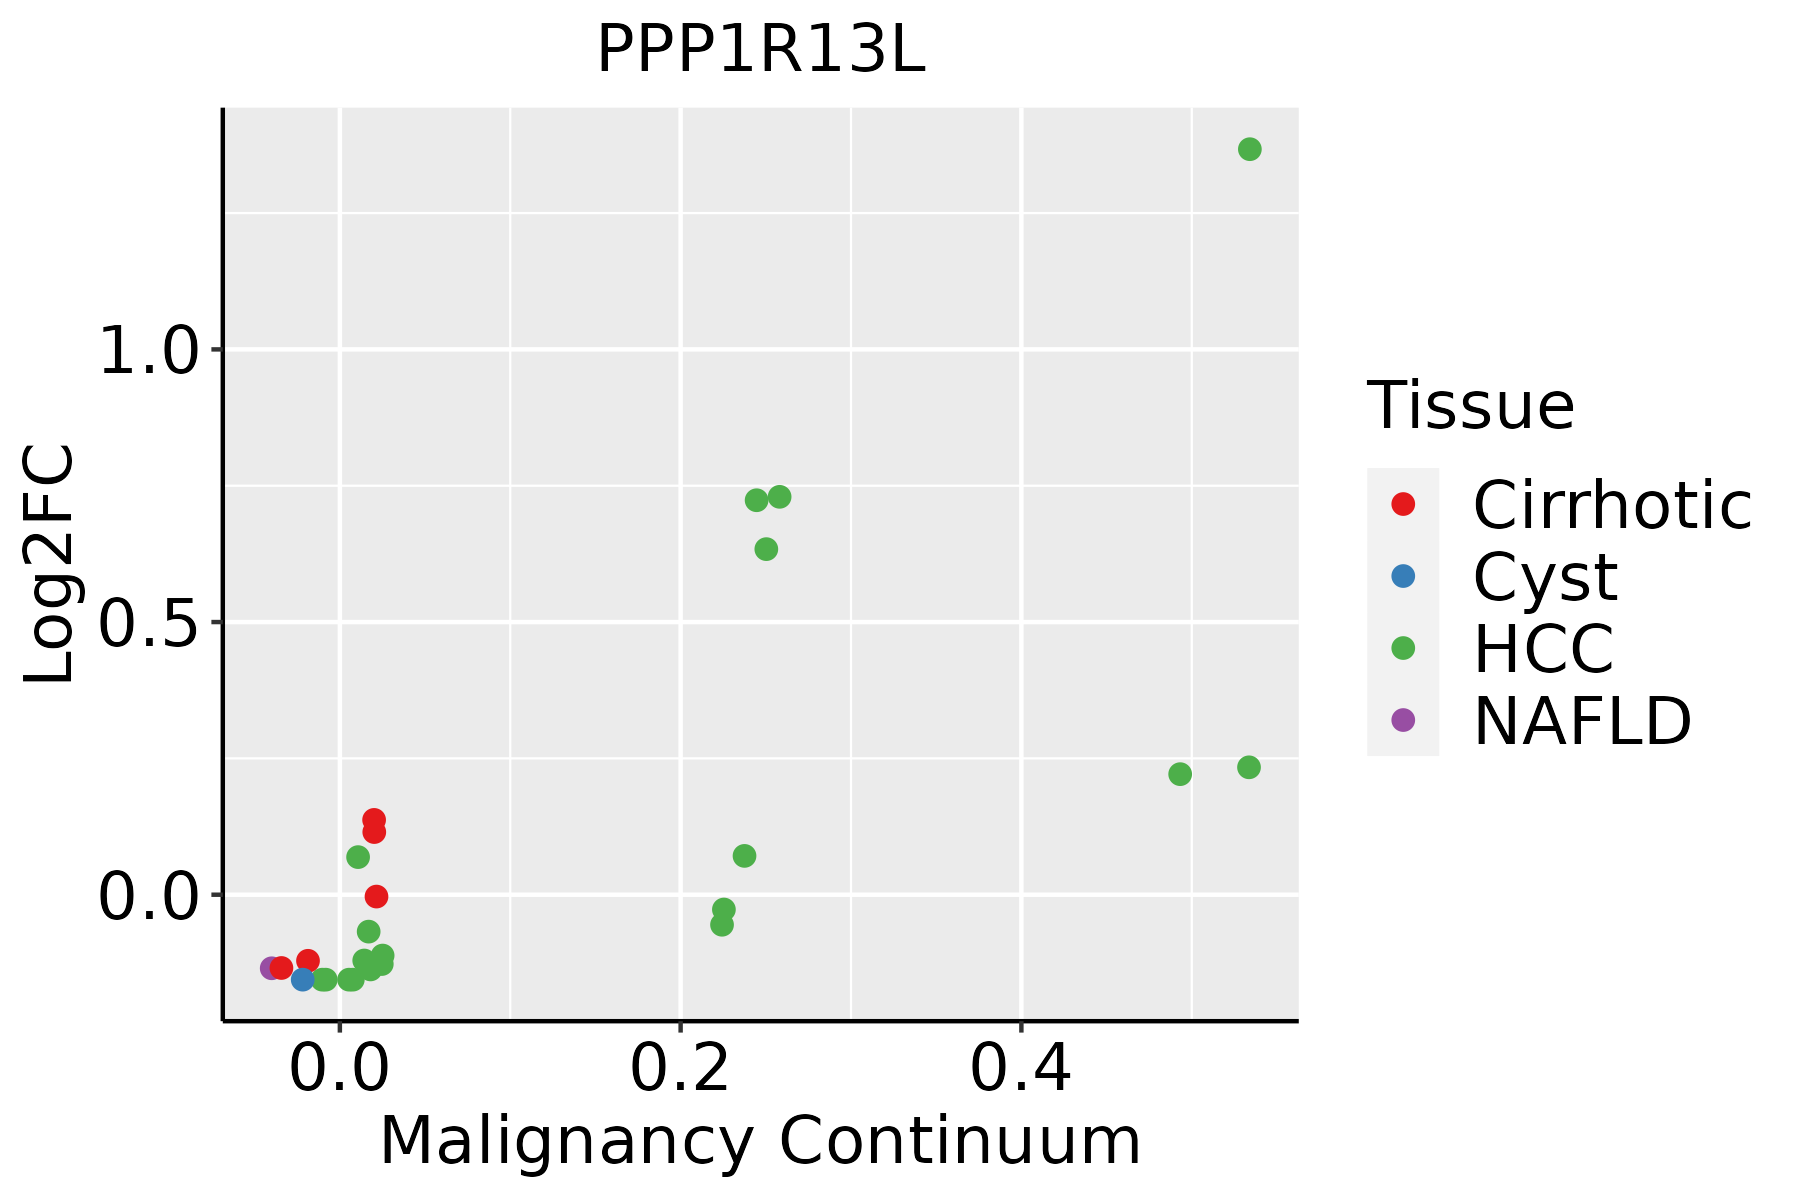 | HCC: Hepatocellular carcinoma |
| NAFLD: Non-alcoholic fatty liver disease | ||
| Oral Cavity |  | EOLP: Erosive Oral lichen planus |
| LP: leukoplakia | ||
| NEOLP: Non-erosive oral lichen planus | ||
| OSCC: Oral squamous cell carcinoma | ||
| Skin | 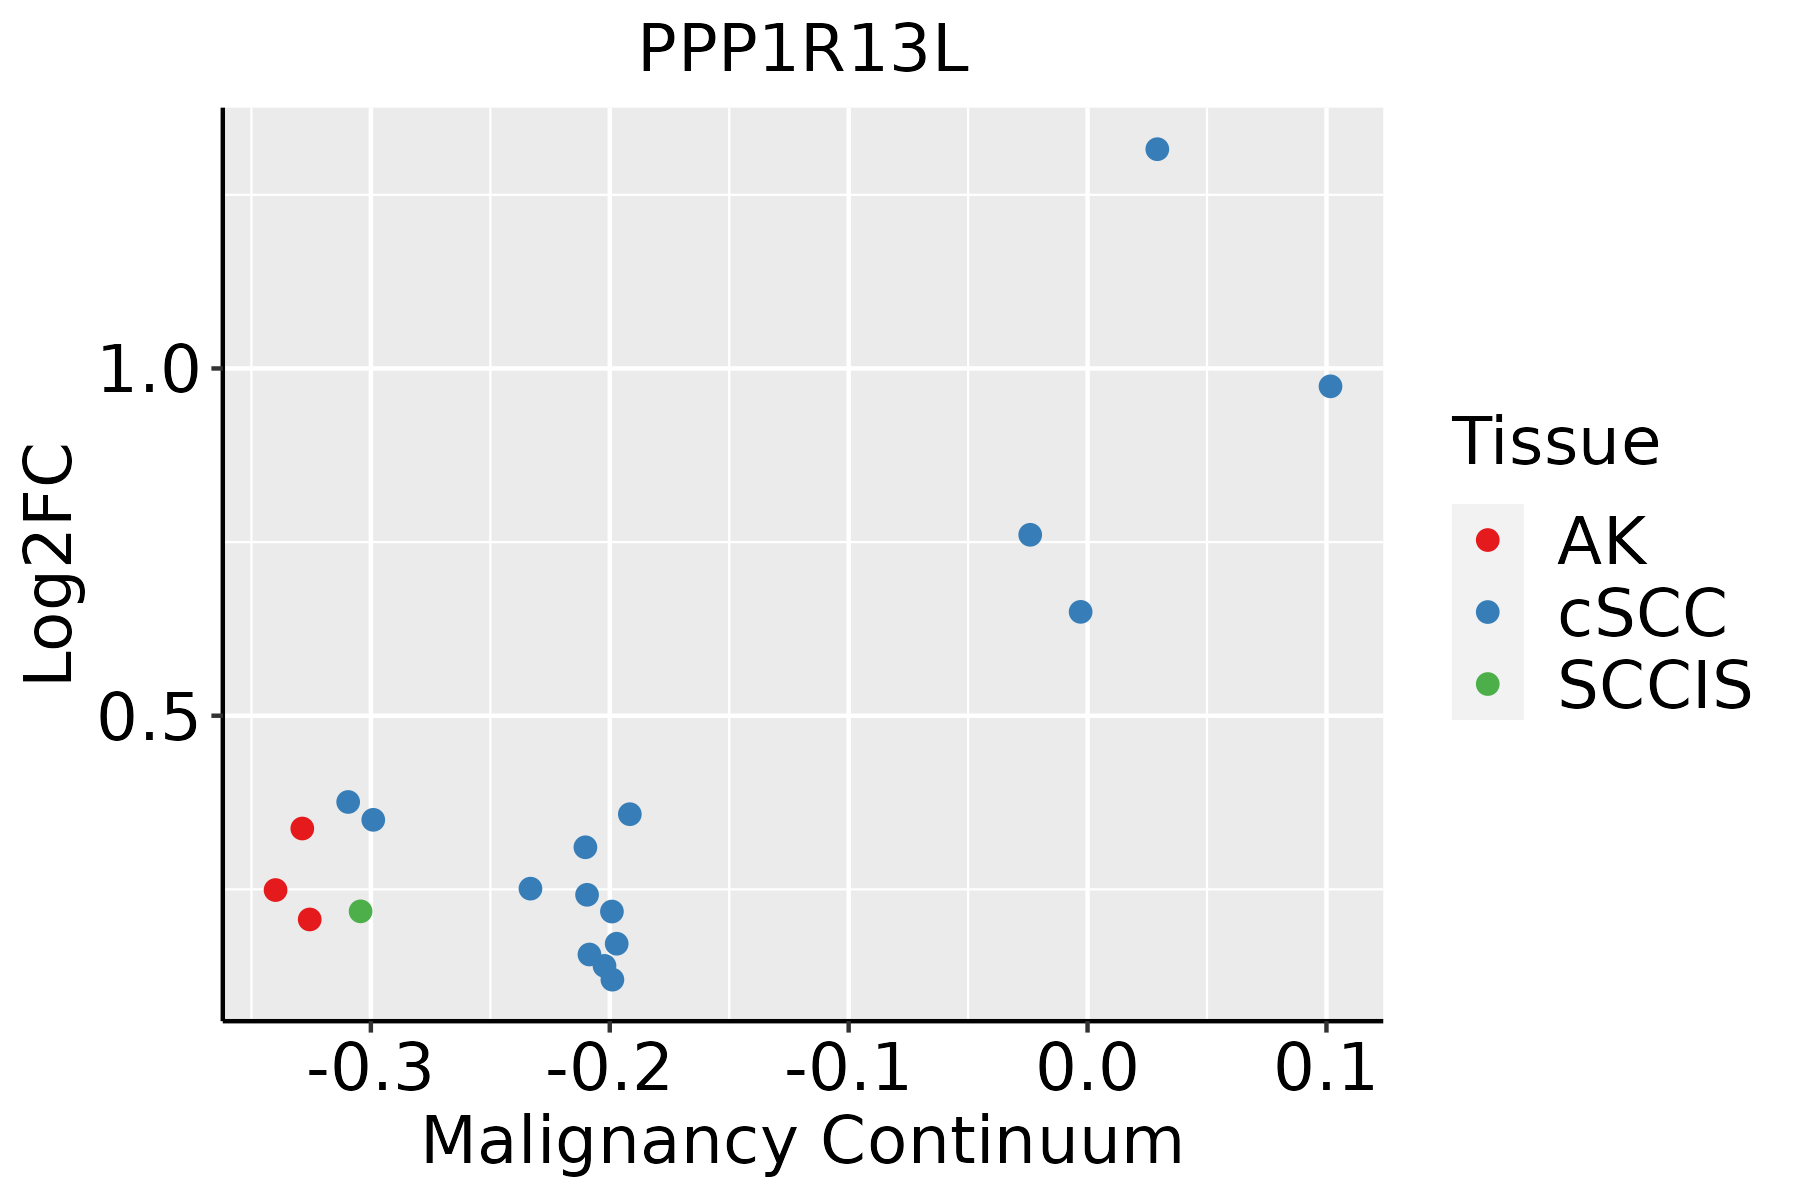 | AK: Actinic keratosis |
| cSCC: Cutaneous squamous cell carcinoma | ||
| SCCIS:squamous cell carcinoma in situ | ||
| Thyroid |  | ATC: Anaplastic thyroid cancer |
| HT: Hashimoto's thyroiditis | ||
| PTC: Papillary thyroid cancer |
| ∗log2FC in expression of this searched gene in stem-like cells from each diseased tissue sample relative to stem-like cells in normal samples in each tissue plotted against the malignancy continuum. Samples are colored based on if they are from different disease stage. |
Top |
Malignant transformation related pathway analysis |
| Find out the enriched GO biological processes and KEGG pathways involved in transition from healthy to precancer to cancer |
| Tissue | Disease Stage | Enriched GO biological Processes |
| Colorectum | AD |  |
| Colorectum | SER |  |
| Colorectum | MSS |  |
| Colorectum | MSI-H |  |
| Colorectum | FAP |  |
| ∗Top 15 enriched GO BP terms are showed in the bar plot of each disease state in each tissue. Each row represents a significant GO biological process which is colored according to the -log10(p.adjust). |
| Page: 1 2 3 4 5 6 7 8 9 |
| GO ID | Tissue | Disease Stage | Description | Gene Ratio | Bg Ratio | pvalue | p.adjust | Count |
| GO:00605375 | Cervix | CC | muscle tissue development | 76/2311 | 403/18723 | 9.76e-05 | 1.27e-03 | 76 |
| GO:00147064 | Cervix | CC | striated muscle tissue development | 72/2311 | 384/18723 | 1.76e-04 | 2.07e-03 | 72 |
| GO:00097915 | Cervix | CC | post-embryonic development | 20/2311 | 80/18723 | 1.40e-03 | 1.10e-02 | 20 |
| GO:0150063 | Cervix | CC | visual system development | 63/2311 | 375/18723 | 6.58e-03 | 3.65e-02 | 63 |
| GO:0001654 | Cervix | CC | eye development | 62/2311 | 371/18723 | 7.83e-03 | 4.13e-02 | 62 |
| GO:0048880 | Cervix | CC | sensory system development | 63/2311 | 381/18723 | 9.29e-03 | 4.66e-02 | 63 |
| GO:00605379 | Esophagus | HGIN | muscle tissue development | 76/2587 | 403/18723 | 2.67e-03 | 2.63e-02 | 76 |
| GO:00147068 | Esophagus | HGIN | striated muscle tissue development | 72/2587 | 384/18723 | 3.94e-03 | 3.56e-02 | 72 |
| GO:00097919 | Esophagus | ESCC | post-embryonic development | 56/8552 | 80/18723 | 9.08e-06 | 8.71e-05 | 56 |
| GO:00352647 | Esophagus | ESCC | multicellular organism growth | 80/8552 | 132/18723 | 3.84e-04 | 2.22e-03 | 80 |
| GO:00485687 | Esophagus | ESCC | embryonic organ development | 228/8552 | 427/18723 | 7.28e-04 | 3.79e-03 | 228 |
| GO:00423033 | Esophagus | ESCC | molting cycle | 64/8552 | 107/18723 | 2.24e-03 | 9.85e-03 | 64 |
| GO:00426333 | Esophagus | ESCC | hair cycle | 64/8552 | 107/18723 | 2.24e-03 | 9.85e-03 | 64 |
| GO:006053716 | Esophagus | ESCC | muscle tissue development | 211/8552 | 403/18723 | 3.84e-03 | 1.56e-02 | 211 |
| GO:001470615 | Esophagus | ESCC | striated muscle tissue development | 197/8552 | 384/18723 | 1.46e-02 | 4.74e-02 | 197 |
| GO:003526411 | Liver | Cirrhotic | multicellular organism growth | 47/4634 | 132/18723 | 3.40e-03 | 1.89e-02 | 47 |
| GO:003526421 | Liver | HCC | multicellular organism growth | 70/7958 | 132/18723 | 9.29e-03 | 3.57e-02 | 70 |
| GO:00097918 | Oral cavity | OSCC | post-embryonic development | 51/7305 | 80/18723 | 6.43e-06 | 7.13e-05 | 51 |
| GO:00605378 | Oral cavity | OSCC | muscle tissue development | 185/7305 | 403/18723 | 2.60e-03 | 1.14e-02 | 185 |
| GO:00147067 | Oral cavity | OSCC | striated muscle tissue development | 174/7305 | 384/18723 | 6.45e-03 | 2.40e-02 | 174 |
| Page: 1 2 3 |
| Pathway ID | Tissue | Disease Stage | Description | Gene Ratio | Bg Ratio | pvalue | p.adjust | qvalue | Count |
| Page: 1 |
Top |
Cell-cell communication analysis |
| Identification of potential cell-cell interactions between two cell types and their ligand-receptor pairs for different disease states |
| Ligand | Receptor | LRpair | Pathway | Tissue | Disease Stage |
| Page: 1 |
Top |
Single-cell gene regulatory network inference analysis |
| Find out the significant the regulons (TFs) and the target genes of each regulon across cell types for different disease states |
| TF | Cell Type | Tissue | Disease Stage | Target Gene | RSS | Regulon Activity |
| ∗The dot plots of a searched regulon are shown for all cell subpopulations in each disease state of each tissue based on the regulon specific score inferred using pySCENIC and by calculating the average expression. |
| Page: 1 |
Top |
Somatic mutation of malignant transformation related genes |
| Annotation of somatic variants for genes involved in malignant transformation |
| Hugo Symbol | Variant Class | Variant Classification | dbSNP RS | HGVSc | HGVSp | HGVSp Short | SWISSPROT | BIOTYPE | SIFT | PolyPhen | Tumor Sample Barcode | Tissue | Histology | Sex | Age | Stage | Therapy Types | Drugs | Outcome |
| PPP1R13L | SNV | Missense_Mutation | novel | c.2021N>T | p.Ser674Phe | p.S674F | Q8WUF5 | protein_coding | deleterious(0.02) | benign(0.276) | TCGA-A2-A0YK-01 | Breast | breast invasive carcinoma | Female | <65 | I/II | Chemotherapy | cytoxan | SD |
| PPP1R13L | SNV | Missense_Mutation | c.329N>A | p.Ser110Asn | p.S110N | Q8WUF5 | protein_coding | deleterious(0) | benign(0) | TCGA-A7-A0DA-01 | Breast | breast invasive carcinoma | Female | <65 | I/II | Chemotherapy | adriamycin | SD | |
| PPP1R13L | SNV | Missense_Mutation | c.2337N>G | p.Phe779Leu | p.F779L | Q8WUF5 | protein_coding | tolerated(0.05) | benign(0.385) | TCGA-AC-A23H-01 | Breast | breast invasive carcinoma | Female | >=65 | I/II | Unknown | Unknown | PD | |
| PPP1R13L | SNV | Missense_Mutation | c.2044G>A | p.Ala682Thr | p.A682T | Q8WUF5 | protein_coding | tolerated(0.39) | benign(0.003) | TCGA-AO-A128-01 | Breast | breast invasive carcinoma | Female | <65 | I/II | Chemotherapy | doxorubicin | SD | |
| PPP1R13L | insertion | Frame_Shift_Ins | novel | c.1563_1564insTGGGAGTCTTGGCCACA | p.Lys522TrpfsTer121 | p.K522Wfs*121 | Q8WUF5 | protein_coding | TCGA-AN-A0FY-01 | Breast | breast invasive carcinoma | Female | <65 | I/II | Unknown | Unknown | SD | ||
| PPP1R13L | SNV | Missense_Mutation | rs752411649 | c.1391N>T | p.Pro464Leu | p.P464L | Q8WUF5 | protein_coding | tolerated(0.1) | possibly_damaging(0.838) | TCGA-EA-A439-01 | Cervix | cervical & endocervical cancer | Female | <65 | I/II | Unknown | Unknown | PD |
| PPP1R13L | insertion | Frame_Shift_Ins | novel | c.732_733insACCCT | p.Arg245ThrfsTer132 | p.R245Tfs*132 | Q8WUF5 | protein_coding | TCGA-DS-A1OB-01 | Cervix | cervical & endocervical cancer | Female | <65 | I/II | Chemotherapy | carboplatin | PD | ||
| PPP1R13L | insertion | Frame_Shift_Ins | novel | c.731_732insCCTTCCGGGGG | p.Arg245LeufsTer134 | p.R245Lfs*134 | Q8WUF5 | protein_coding | TCGA-DS-A1OB-01 | Cervix | cervical & endocervical cancer | Female | <65 | I/II | Chemotherapy | carboplatin | PD | ||
| PPP1R13L | SNV | Missense_Mutation | c.2099N>T | p.Ala700Val | p.A700V | Q8WUF5 | protein_coding | deleterious(0) | probably_damaging(0.998) | TCGA-AA-3492-01 | Colorectum | colon adenocarcinoma | Female | >=65 | I/II | Unknown | Unknown | SD | |
| PPP1R13L | SNV | Missense_Mutation | c.727C>T | p.Arg243Cys | p.R243C | Q8WUF5 | protein_coding | deleterious(0) | benign(0.353) | TCGA-AA-3864-01 | Colorectum | colon adenocarcinoma | Male | >=65 | I/II | Unknown | Unknown | SD |
| Page: 1 2 3 4 5 6 7 8 |
Top |
Related drugs of malignant transformation related genes |
| Identification of chemicals and drugs interact with genes involved in malignant transfromation |
| (DGIdb 4.0) |
| Entrez ID | Symbol | Category | Interaction Types | Drug Claim Name | Drug Name | PMIDs |
| 10848 | PPP1R13L | TRANSCRIPTION FACTOR BINDING | gemcitabine | GEMCITABINE | ||
| 10848 | PPP1R13L | TRANSCRIPTION FACTOR BINDING | Platinum compounds | 19203783 | ||
| 10848 | PPP1R13L | TRANSCRIPTION FACTOR BINDING | cisplatin | CISPLATIN |
| Page: 1 |

Copyright 2023-Present -The University of Texas Health Science Center at Houston |