| Tissue | Expression Dynamics | Abbreviation |
| Cervix | 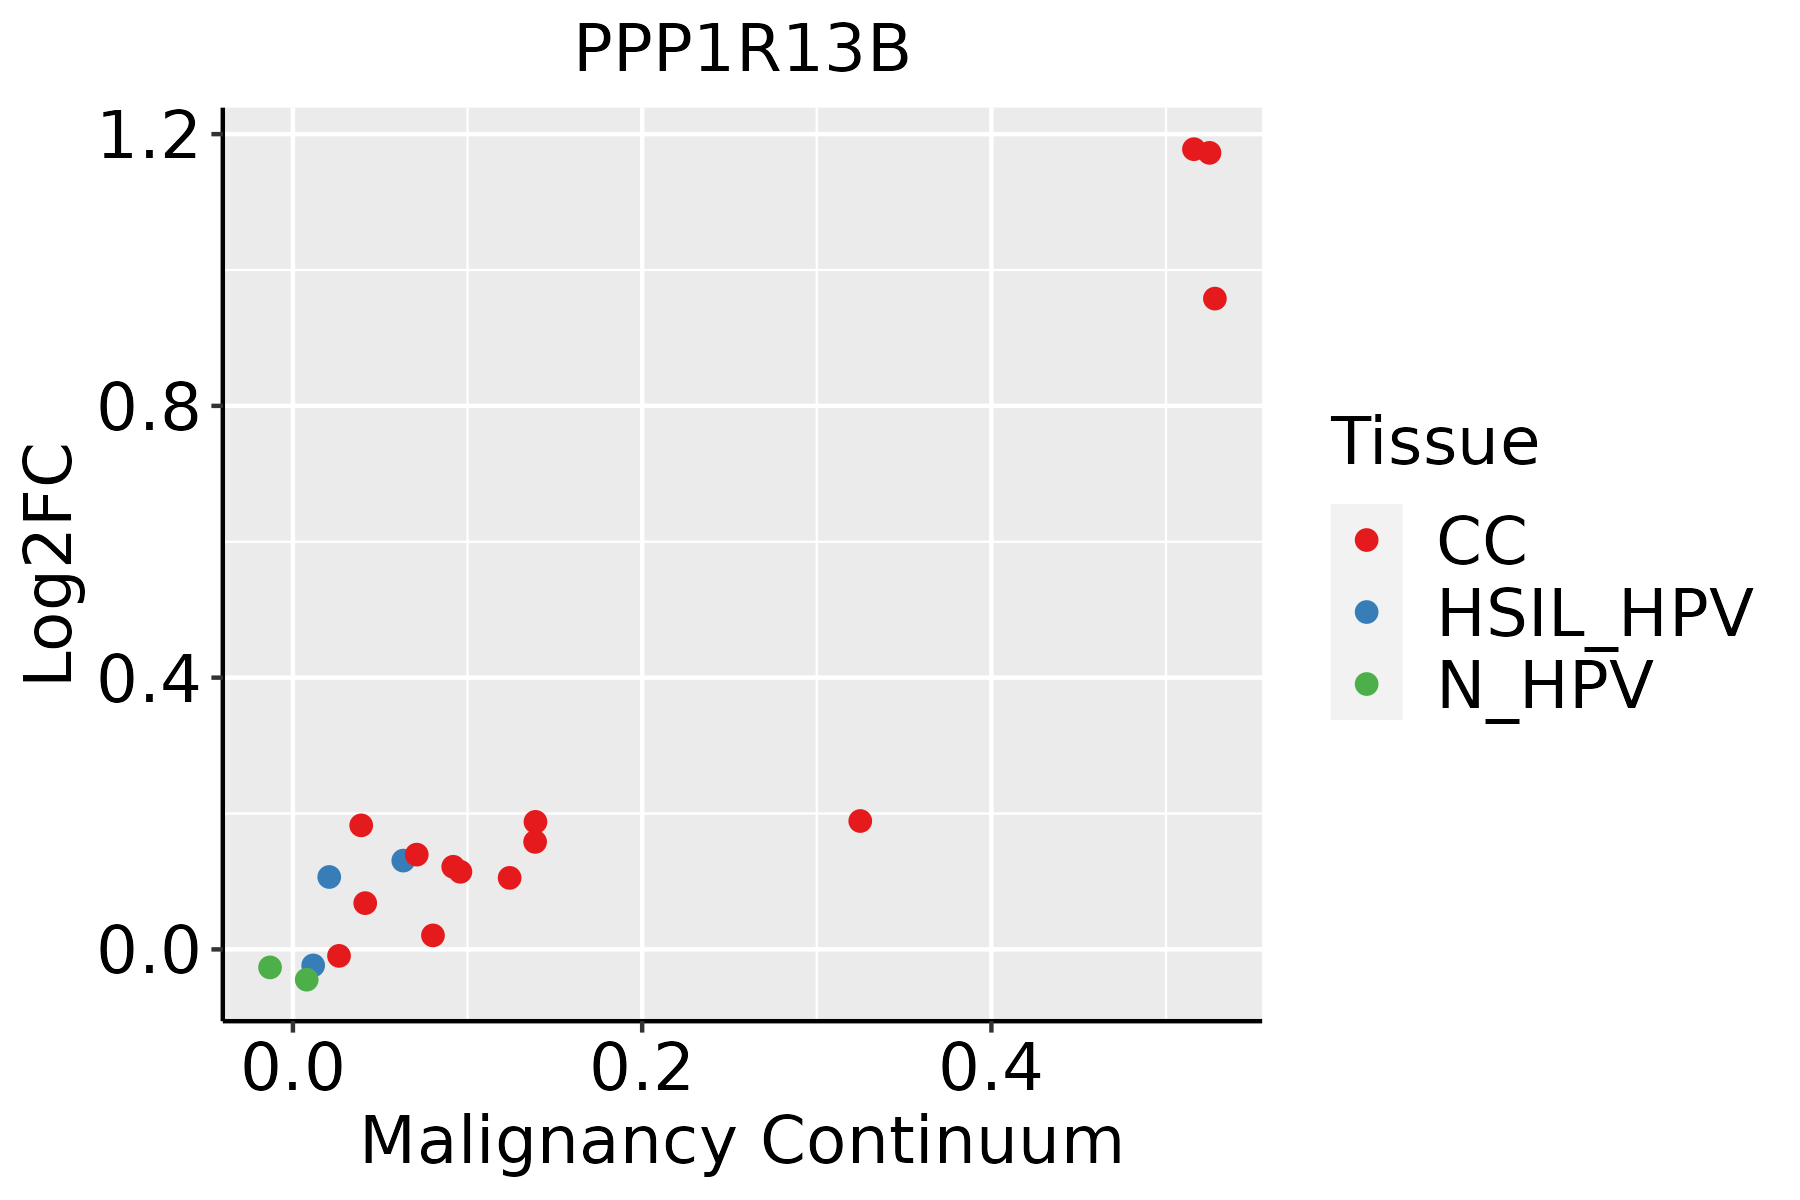 | CC: Cervix cancer |
| HSIL_HPV: HPV-infected high-grade squamous intraepithelial lesions |
| N_HPV: HPV-infected normal cervix |
| Colorectum (GSE201348) |  | FAP: Familial adenomatous polyposis |
| CRC: Colorectal cancer |
| Colorectum (HTA11) |  | AD: Adenomas |
| SER: Sessile serrated lesions |
| MSI-H: Microsatellite-high colorectal cancer |
| MSS: Microsatellite stable colorectal cancer |
| Endometrium | 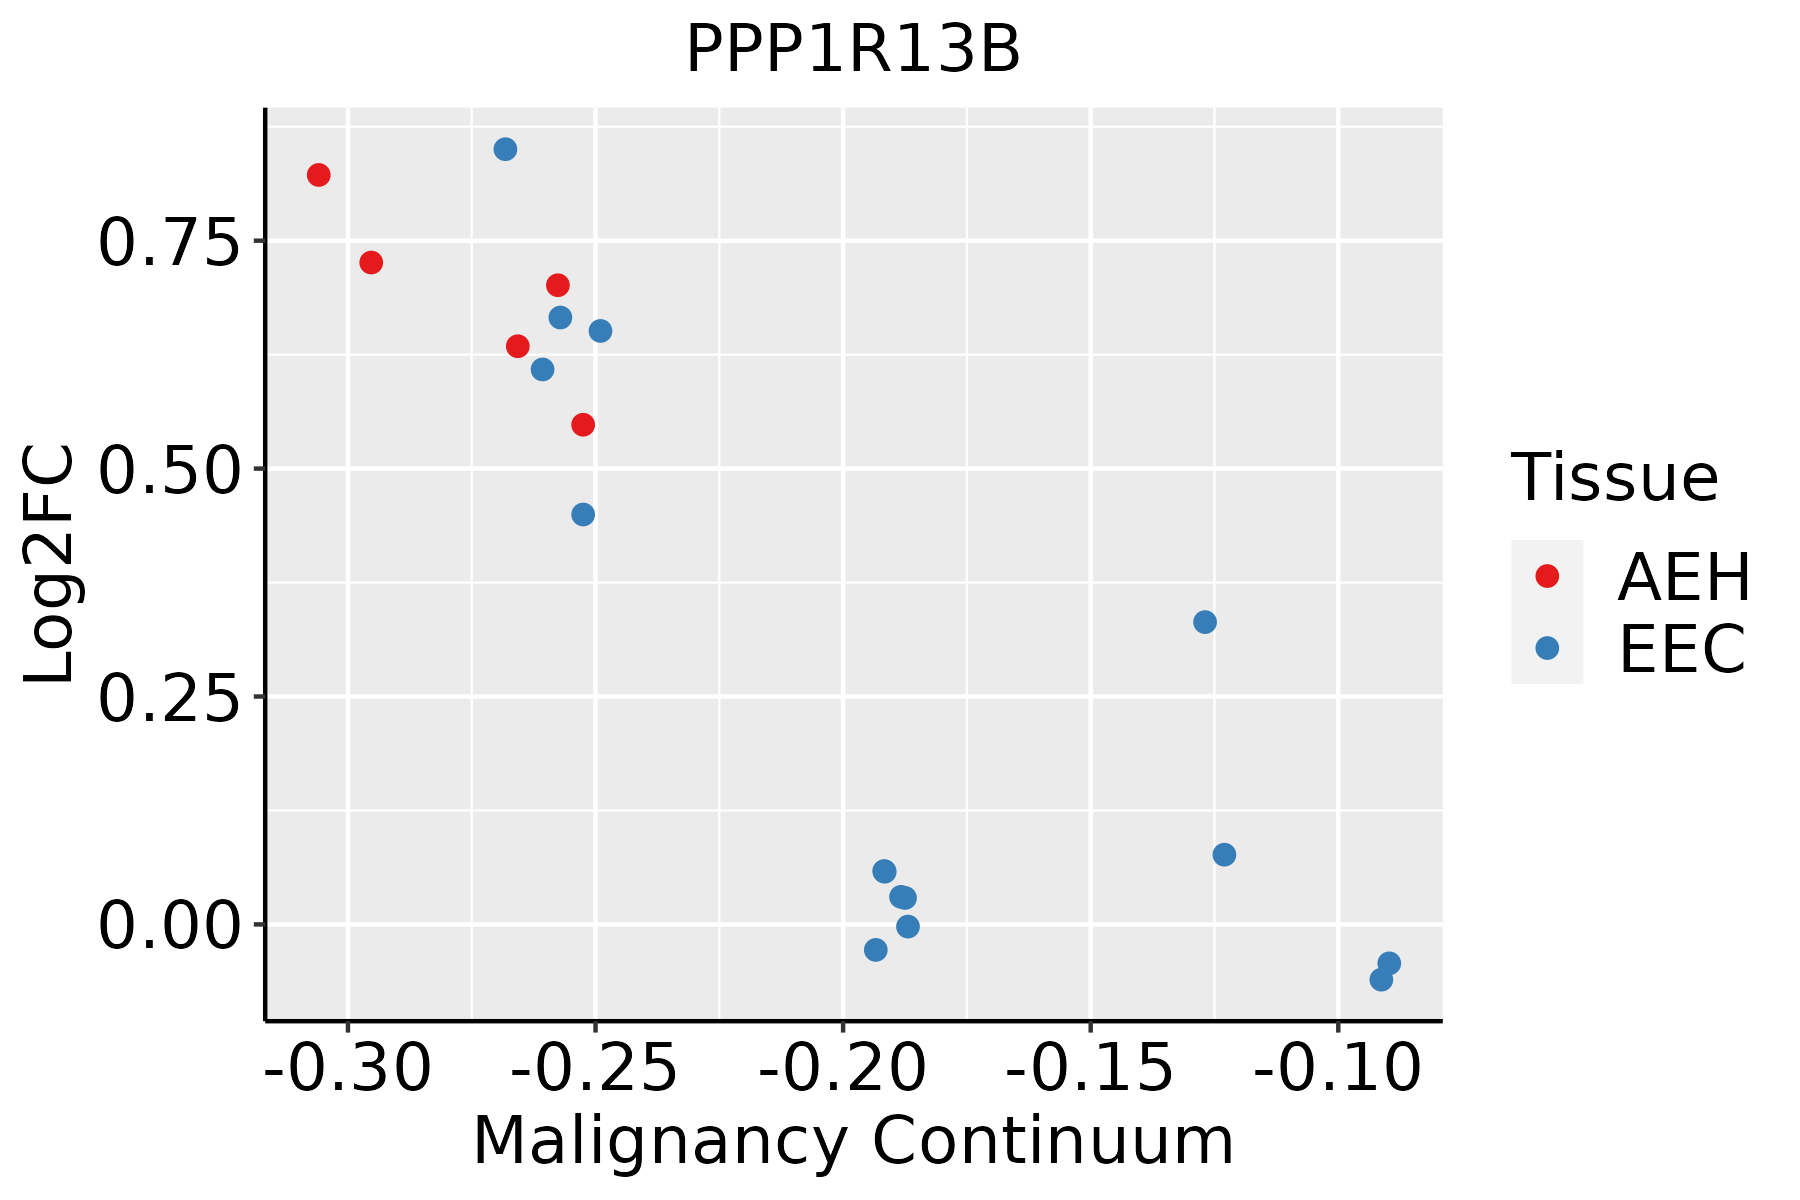 | AEH: Atypical endometrial hyperplasia |
| EEC: Endometrioid Cancer |
| Esophagus | 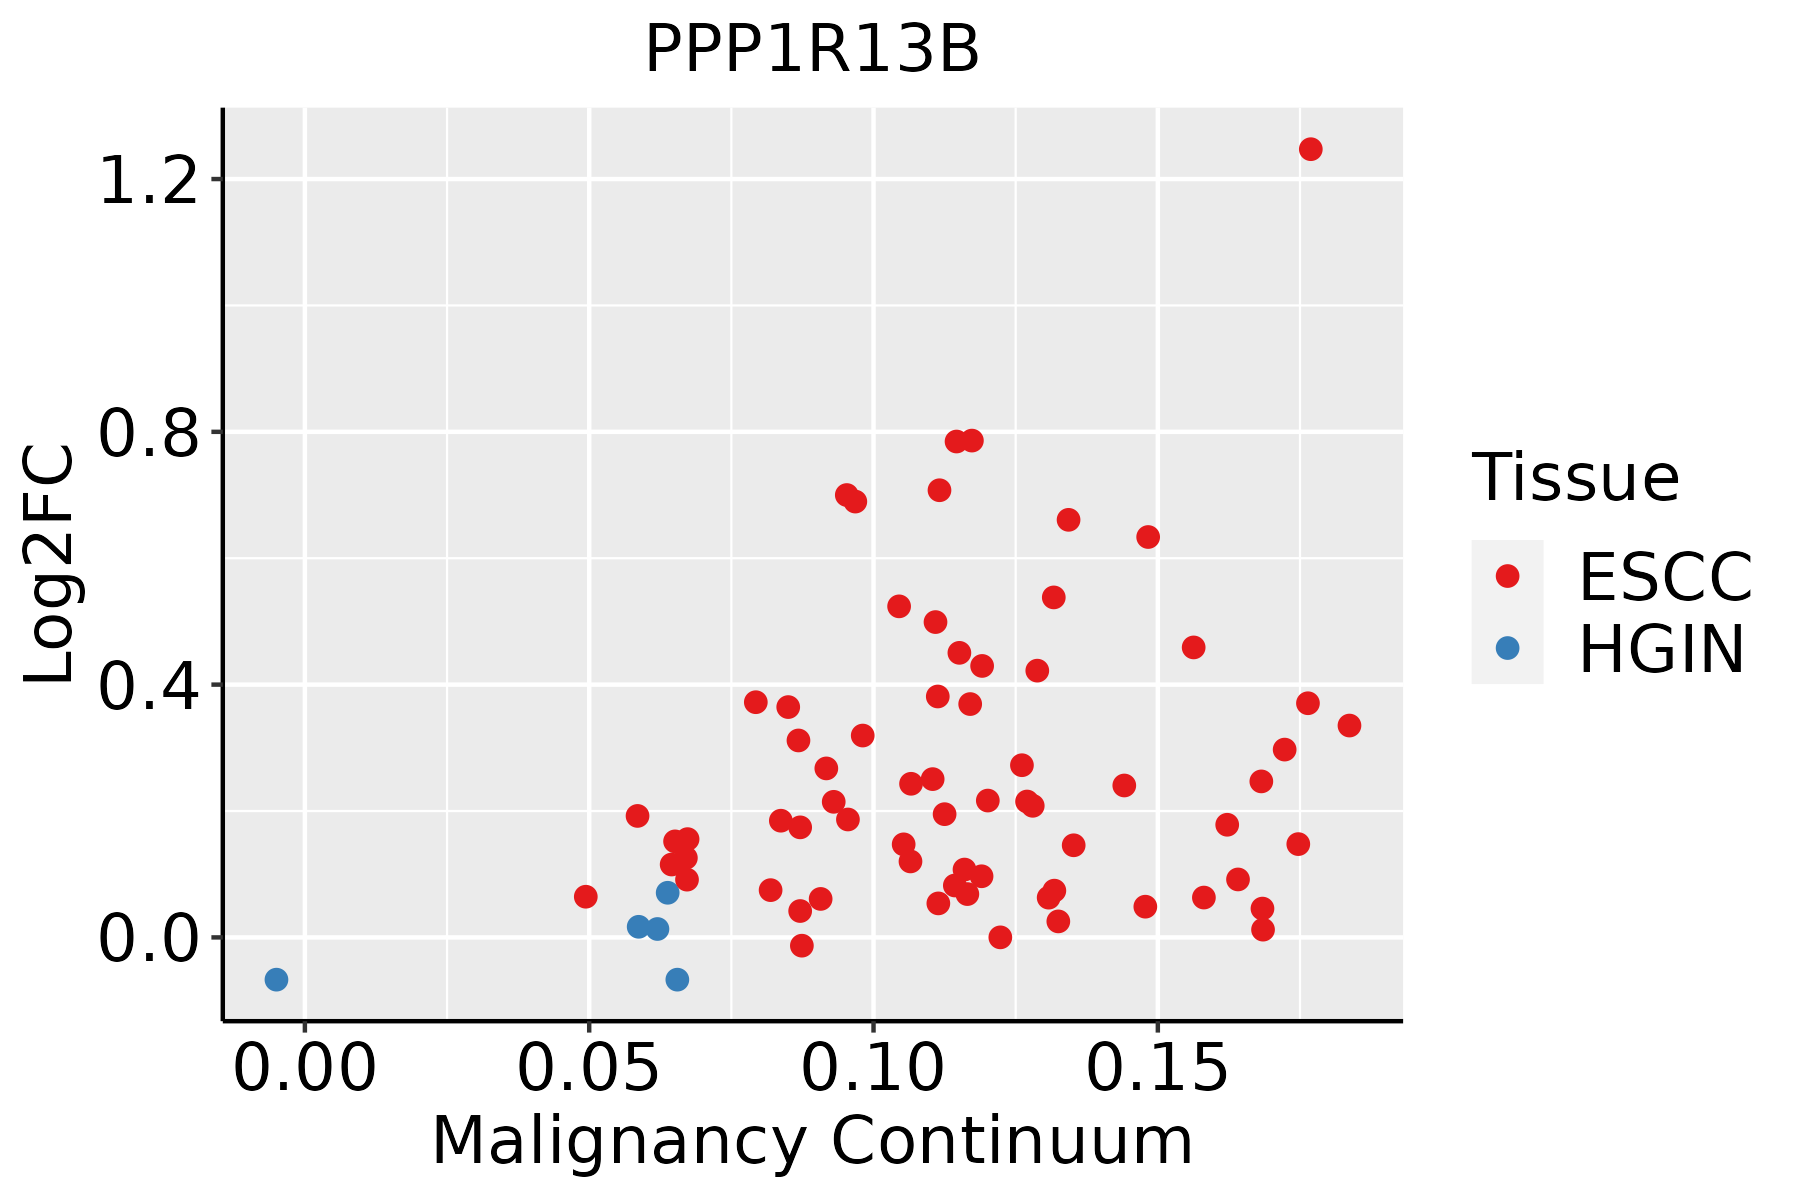 | ESCC: Esophageal squamous cell carcinoma |
| HGIN: High-grade intraepithelial neoplasias |
| LGIN: Low-grade intraepithelial neoplasias |
| Lung | 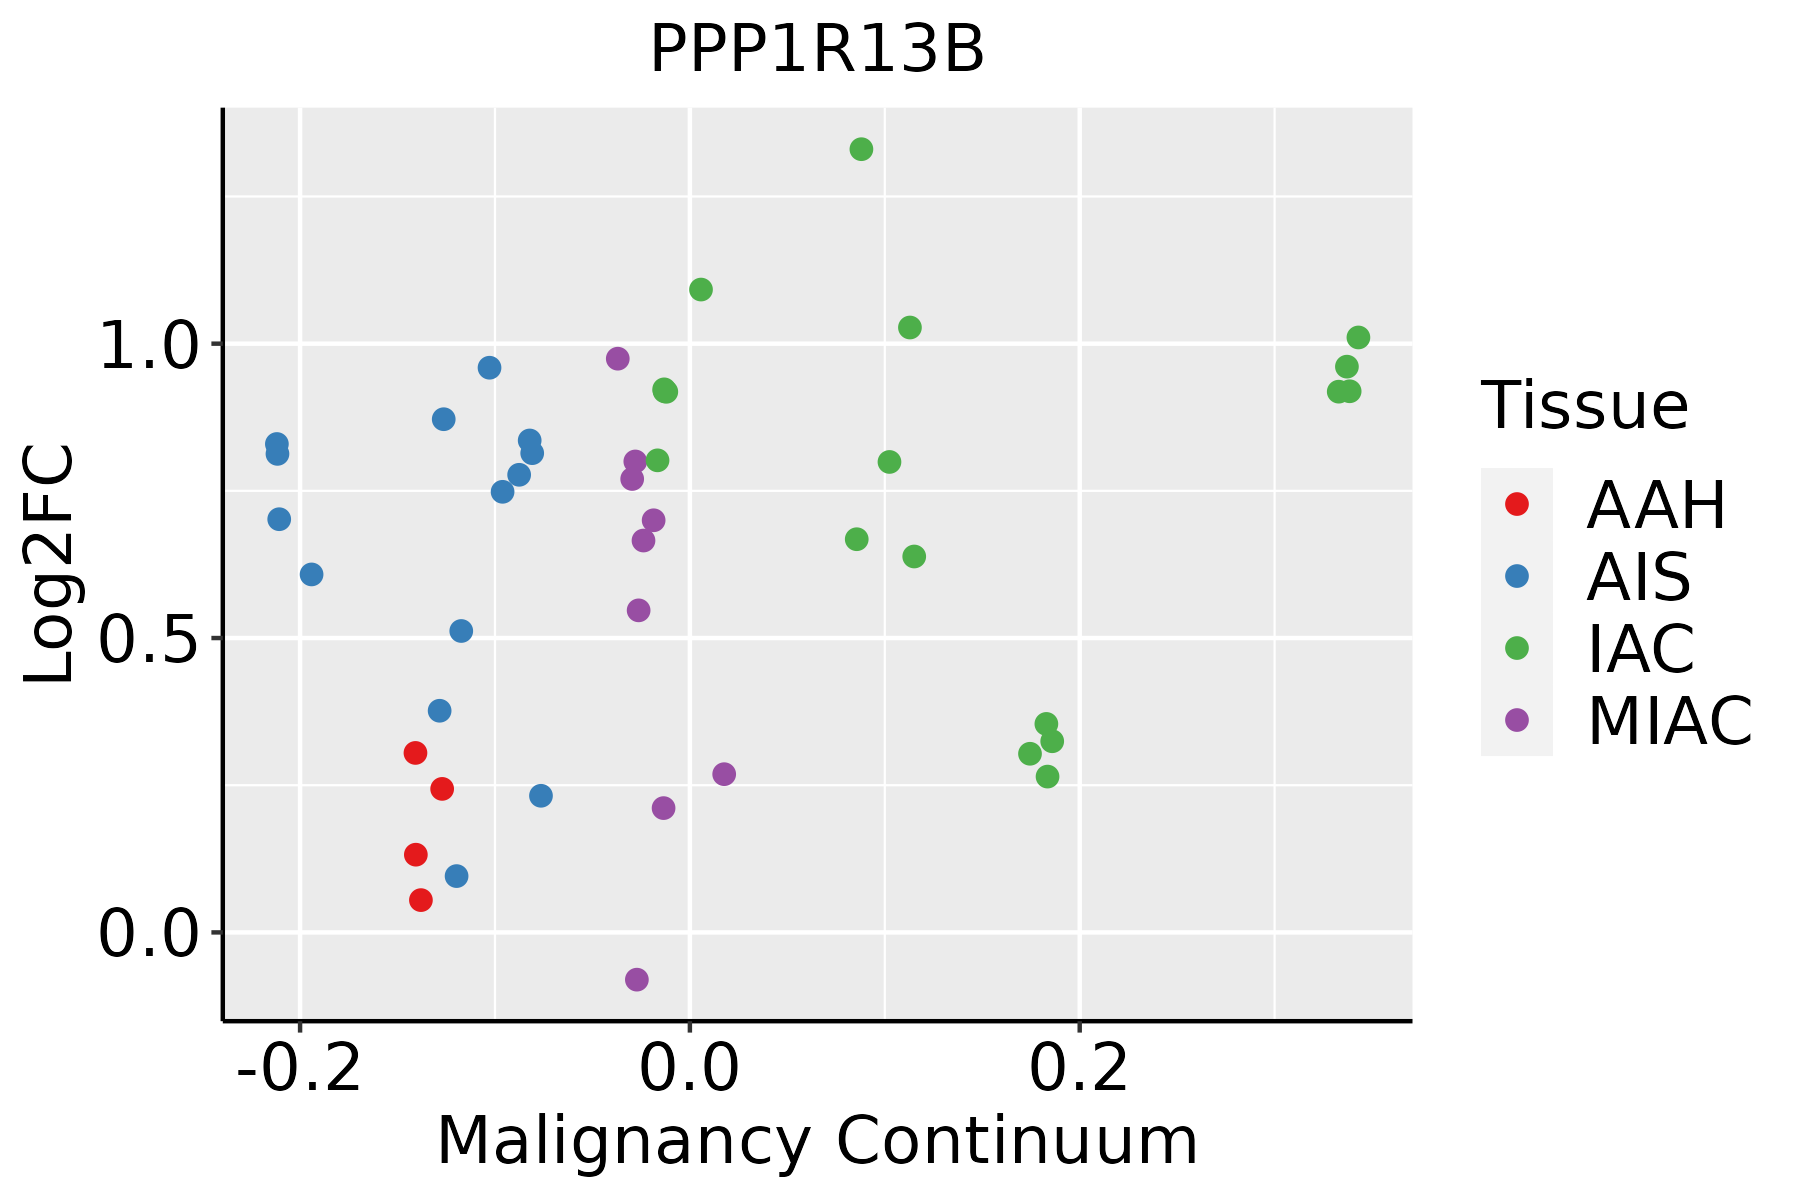 | AAH: Atypical adenomatous hyperplasia |
| AIS: Adenocarcinoma in situ |
| IAC: Invasive lung adenocarcinoma |
| MIA: Minimally invasive adenocarcinoma |
| Prostate | 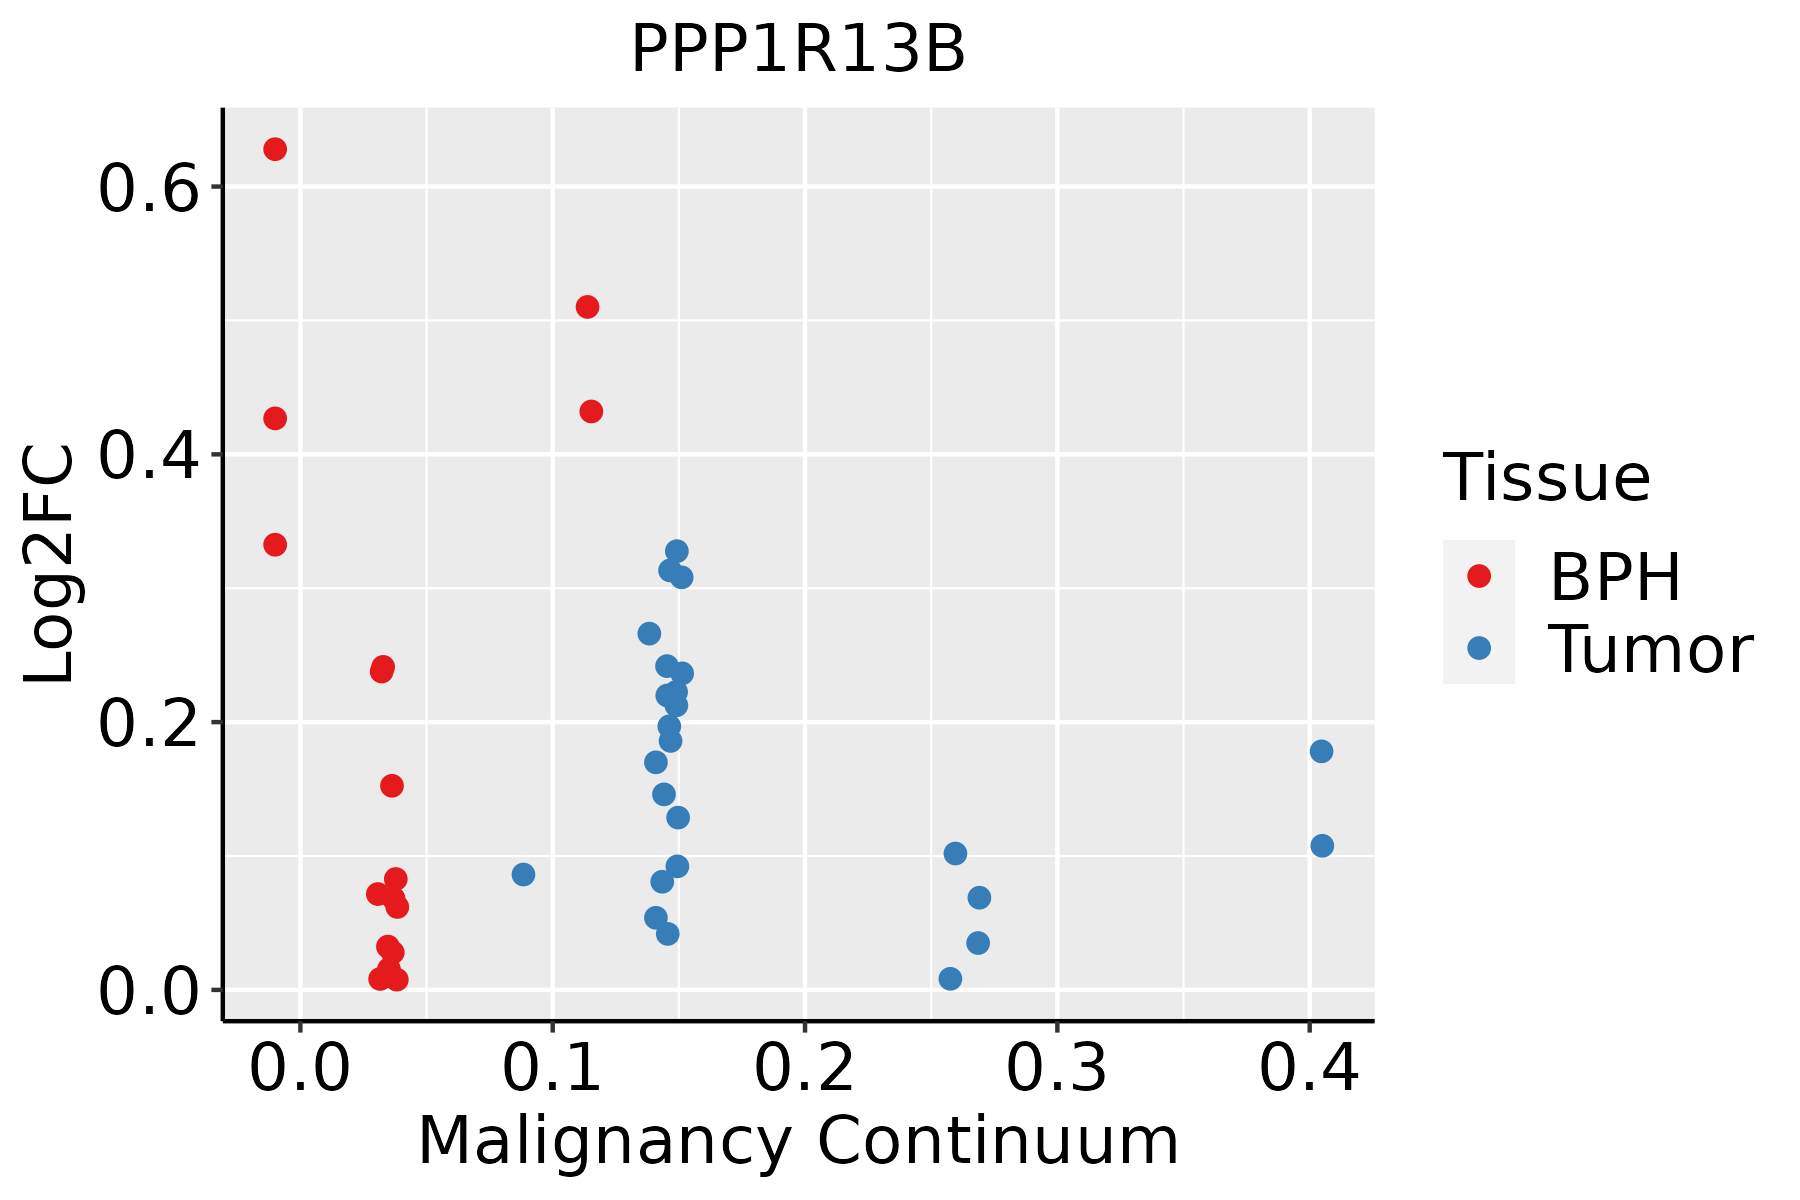 | BPH: Benign Prostatic Hyperplasia |
| Skin | 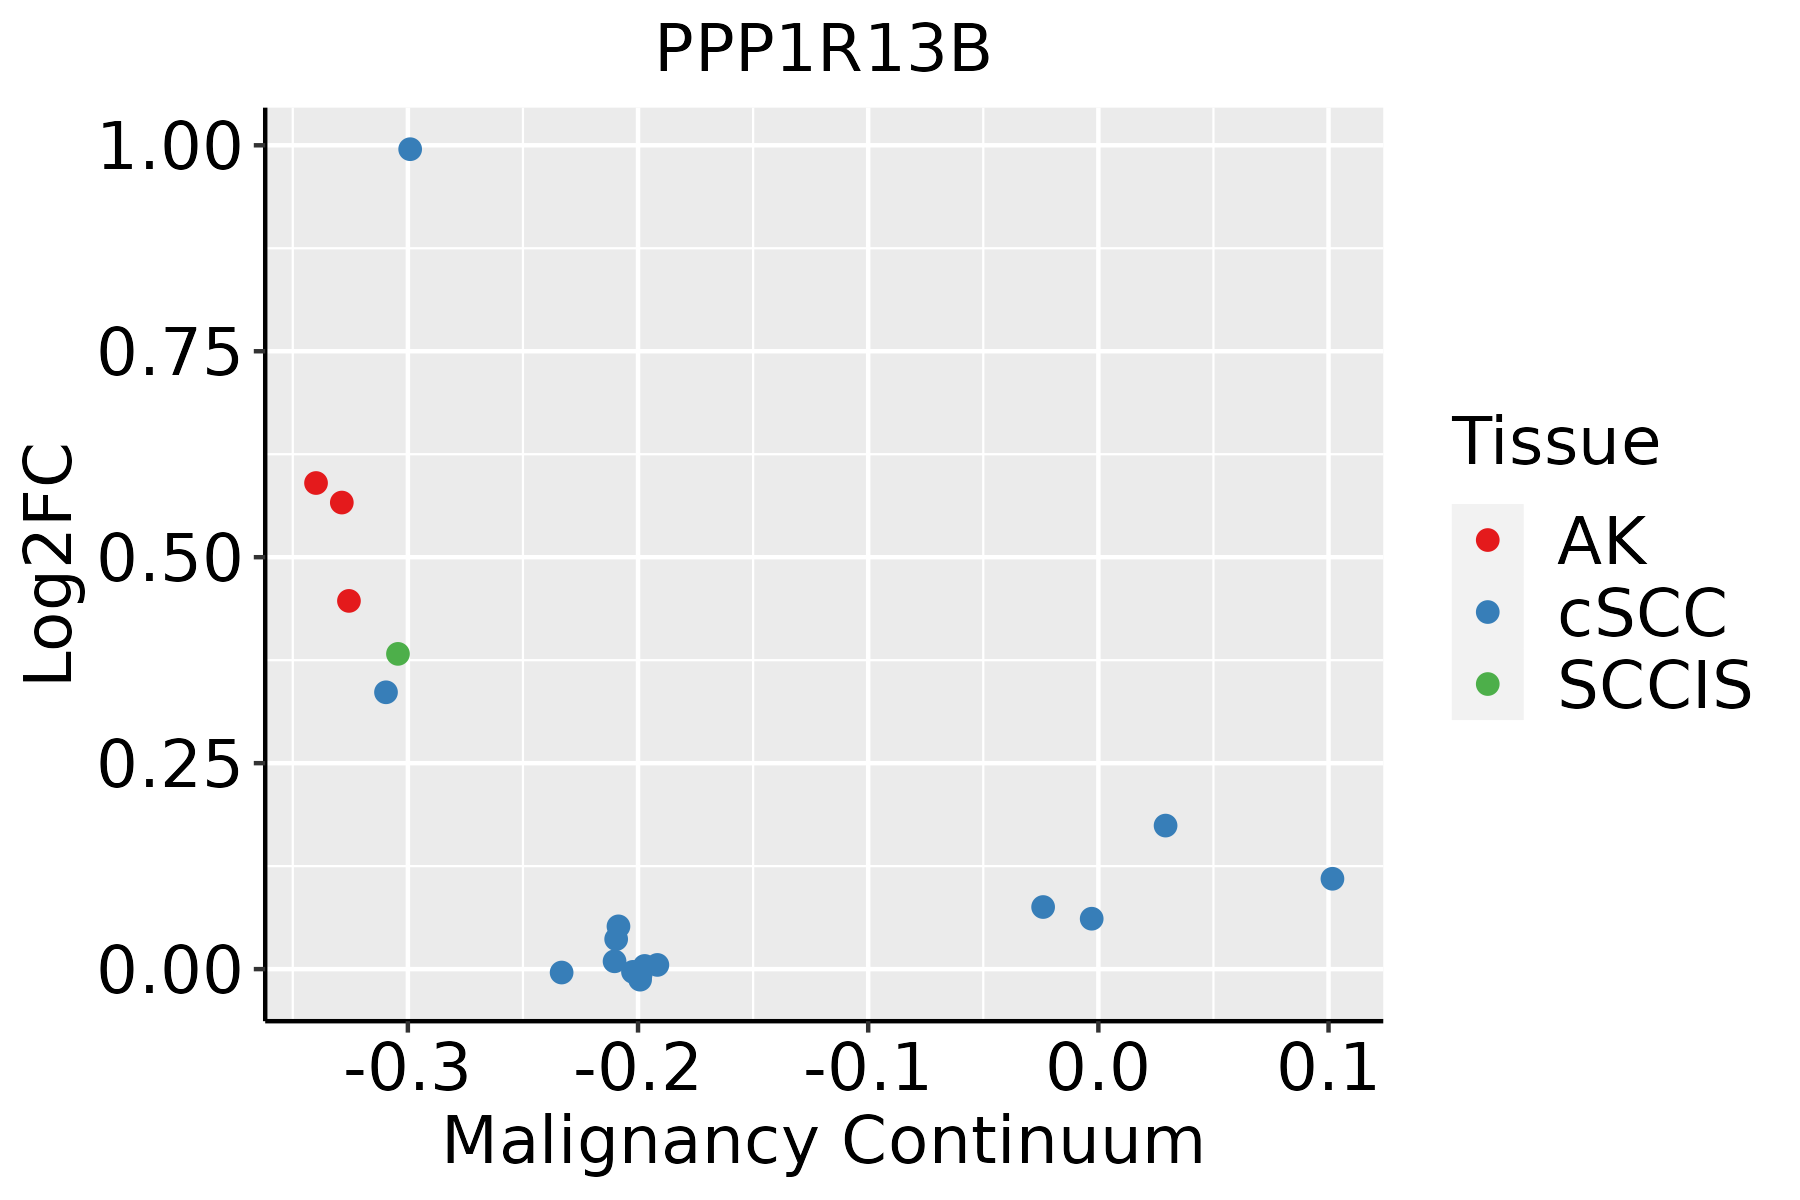 | AK: Actinic keratosis |
| cSCC: Cutaneous squamous cell carcinoma |
| SCCIS:squamous cell carcinoma in situ |
| Thyroid | 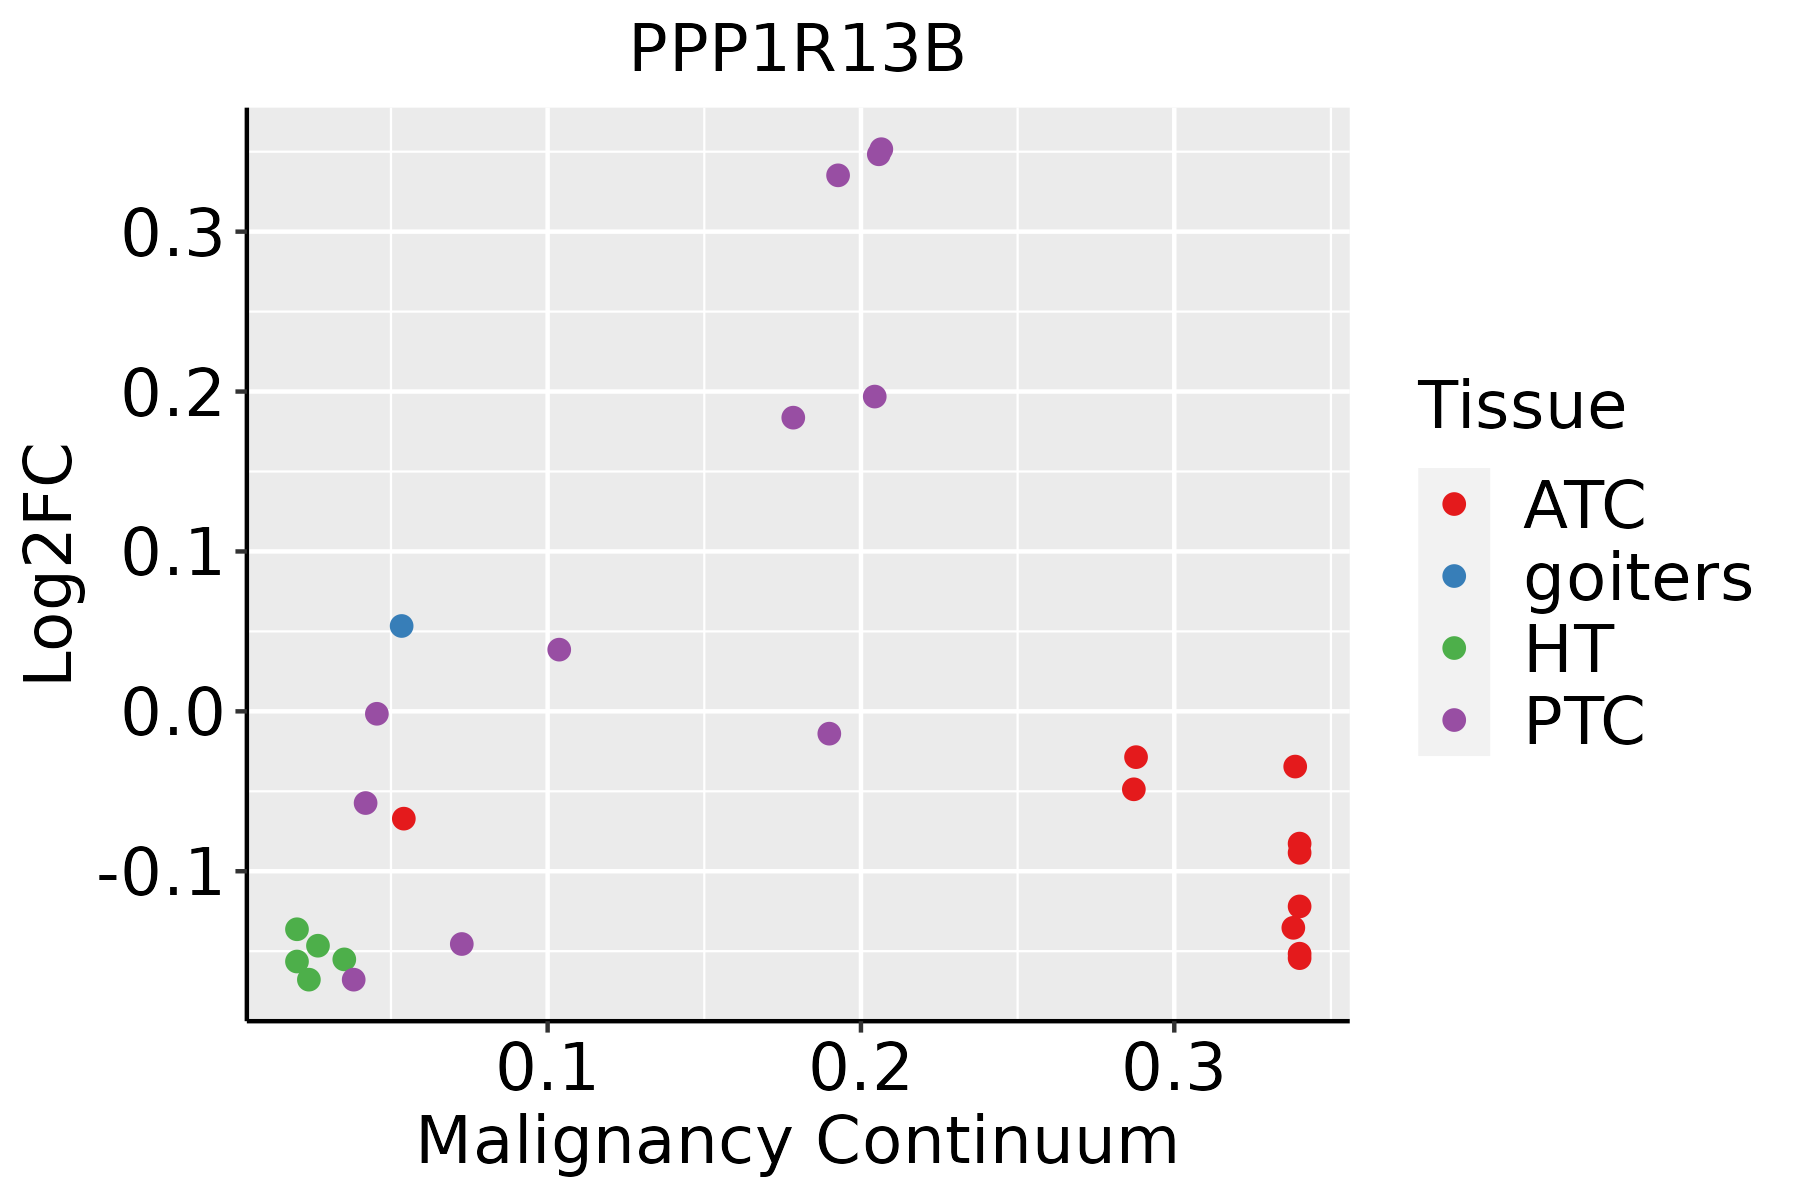 | ATC: Anaplastic thyroid cancer |
| HT: Hashimoto's thyroiditis |
| PTC: Papillary thyroid cancer |
| GO ID | Tissue | Disease Stage | Description | Gene Ratio | Bg Ratio | pvalue | p.adjust | Count |
| GO:009719310 | Cervix | CC | intrinsic apoptotic signaling pathway | 85/2311 | 288/18723 | 4.56e-15 | 6.46e-12 | 85 |
| GO:00723329 | Cervix | CC | intrinsic apoptotic signaling pathway by p53 class mediator | 23/2311 | 76/18723 | 2.76e-05 | 4.60e-04 | 23 |
| GO:007233110 | Cervix | CC | signal transduction by p53 class mediator | 38/2311 | 163/18723 | 7.06e-05 | 9.85e-04 | 38 |
| GO:007099710 | Cervix | CC | neuron death | 70/2311 | 361/18723 | 7.50e-05 | 1.03e-03 | 70 |
| GO:190121610 | Cervix | CC | positive regulation of neuron death | 26/2311 | 97/18723 | 8.64e-05 | 1.15e-03 | 26 |
| GO:190121410 | Cervix | CC | regulation of neuron death | 61/2311 | 319/18723 | 3.11e-04 | 3.31e-03 | 61 |
| GO:00457862 | Cervix | CC | negative regulation of cell cycle | 67/2311 | 385/18723 | 2.21e-03 | 1.59e-02 | 67 |
| GO:0097193 | Colorectum | AD | intrinsic apoptotic signaling pathway | 108/3918 | 288/18723 | 6.25e-11 | 6.41e-09 | 108 |
| GO:0070997 | Colorectum | AD | neuron death | 114/3918 | 361/18723 | 1.13e-06 | 3.72e-05 | 114 |
| GO:0072331 | Colorectum | AD | signal transduction by p53 class mediator | 58/3918 | 163/18723 | 1.04e-05 | 2.40e-04 | 58 |
| GO:1901214 | Colorectum | AD | regulation of neuron death | 99/3918 | 319/18723 | 1.26e-05 | 2.76e-04 | 99 |
| GO:0072332 | Colorectum | AD | intrinsic apoptotic signaling pathway by p53 class mediator | 30/3918 | 76/18723 | 1.72e-04 | 2.33e-03 | 30 |
| GO:1901216 | Colorectum | AD | positive regulation of neuron death | 32/3918 | 97/18723 | 3.74e-03 | 2.63e-02 | 32 |
| GO:00971932 | Colorectum | MSS | intrinsic apoptotic signaling pathway | 102/3467 | 288/18723 | 6.06e-12 | 9.82e-10 | 102 |
| GO:00709972 | Colorectum | MSS | neuron death | 97/3467 | 361/18723 | 5.21e-05 | 9.31e-04 | 97 |
| GO:00723312 | Colorectum | MSS | signal transduction by p53 class mediator | 49/3467 | 163/18723 | 2.30e-04 | 3.19e-03 | 49 |
| GO:00723322 | Colorectum | MSS | intrinsic apoptotic signaling pathway by p53 class mediator | 27/3467 | 76/18723 | 3.31e-04 | 4.24e-03 | 27 |
| GO:19012142 | Colorectum | MSS | regulation of neuron death | 83/3467 | 319/18723 | 5.28e-04 | 5.99e-03 | 83 |
| GO:19012161 | Colorectum | MSS | positive regulation of neuron death | 30/3467 | 97/18723 | 2.15e-03 | 1.80e-02 | 30 |
| GO:00709974 | Colorectum | FAP | neuron death | 81/2622 | 361/18723 | 8.35e-06 | 2.46e-04 | 81 |
| Hugo Symbol | Variant Class | Variant Classification | dbSNP RS | HGVSc | HGVSp | HGVSp Short | SWISSPROT | BIOTYPE | SIFT | PolyPhen | Tumor Sample Barcode | Tissue | Histology | Sex | Age | Stage | Therapy Types | Drugs | Outcome |
| PPP1R13B | SNV | Missense_Mutation | | c.365C>A | p.Pro122Gln | p.P122Q | Q96KQ4 | protein_coding | tolerated(0.09) | possibly_damaging(0.453) | TCGA-A2-A0EM-01 | Breast | breast invasive carcinoma | Female | >=65 | I/II | Hormone Therapy | tamoxiphen | SD |
| PPP1R13B | SNV | Missense_Mutation | | c.10A>T | p.Met4Leu | p.M4L | Q96KQ4 | protein_coding | tolerated(0.09) | benign(0.222) | TCGA-A7-A26H-01 | Breast | breast invasive carcinoma | Female | >=65 | I/II | Hormone Therapy | anastrozole | PD |
| PPP1R13B | SNV | Missense_Mutation | novel | c.2557N>G | p.Leu853Val | p.L853V | Q96KQ4 | protein_coding | tolerated(0.62) | benign(0) | TCGA-AC-A23H-01 | Breast | breast invasive carcinoma | Female | >=65 | I/II | Unknown | Unknown | PD |
| PPP1R13B | SNV | Missense_Mutation | | c.1682N>T | p.Gly561Val | p.G561V | Q96KQ4 | protein_coding | tolerated(0.07) | possibly_damaging(0.711) | TCGA-AR-A24Q-01 | Breast | breast invasive carcinoma | Female | <65 | I/II | Chemotherapy | doxorubicin | SD |
| PPP1R13B | SNV | Missense_Mutation | | c.2102C>T | p.Ala701Val | p.A701V | Q96KQ4 | protein_coding | deleterious(0) | probably_damaging(0.99) | TCGA-BH-A0H3-01 | Breast | breast invasive carcinoma | Female | <65 | I/II | Unknown | Unknown | SD |
| PPP1R13B | insertion | Frame_Shift_Ins | novel | c.2931_2932insATTAAACAGTCACAAGTCATTTATTC | p.Ala978IlefsTer17 | p.A978Ifs*17 | Q96KQ4 | protein_coding | | | TCGA-A8-A08T-01 | Breast | breast invasive carcinoma | Female | <65 | III/IV | Unknown | Unknown | PD |
| PPP1R13B | insertion | Frame_Shift_Ins | novel | c.620_621insTGACAATGAGACCCTGTCTCAAAAAAAAATAAAAAGATCTCTTG | p.Gly208AspfsTer22 | p.G208Dfs*22 | Q96KQ4 | protein_coding | | | TCGA-A8-A09C-01 | Breast | breast invasive carcinoma | Female | >=65 | I/II | Unknown | Unknown | SD |
| PPP1R13B | insertion | Frame_Shift_Ins | novel | c.2708_2709insATGTGCCCAAAAACCTGCTG | p.Val904CysfsTer41 | p.V904Cfs*41 | Q96KQ4 | protein_coding | | | TCGA-AN-A03X-01 | Breast | breast invasive carcinoma | Female | >=65 | I/II | Unknown | Unknown | SD |
| PPP1R13B | deletion | Frame_Shift_Del | novel | c.2540delN | p.Gln847ArgfsTer24 | p.Q847Rfs*24 | Q96KQ4 | protein_coding | | | TCGA-D8-A27V-01 | Breast | breast invasive carcinoma | Female | <65 | I/II | Hormone Therapy | tamoxiphen | SD |
| PPP1R13B | SNV | Missense_Mutation | rs768657019 | c.3071N>T | p.Ala1024Val | p.A1024V | Q96KQ4 | protein_coding | tolerated(1) | benign(0) | TCGA-2W-A8YY-01 | Cervix | cervical & endocervical cancer | Female | <65 | I/II | Chemotherapy | cisplatin | CR |


