
|
|||||
|
 | |
| |
| |
| |
| |
| |
|
Gene: PPP1R12C |
Gene summary for PPP1R12C |
| Gene information | Species | Human | Gene symbol | PPP1R12C | Gene ID | 54776 |
| Gene name | protein phosphatase 1 regulatory subunit 12C | |
| Gene Alias | AAVS1 | |
| Cytomap | 19q13.42 | |
| Gene Type | protein-coding | GO ID | GO:0007154 | UniProtAcc | Q9BZL4 |
Top |
Malignant transformation analysis |
| Identification of the aberrant gene expression in precancerous and cancerous lesions by comparing the gene expression of stem-like cells in diseased tissues with normal stem cells |
| Entrez ID | Symbol | Replicates | Species | Organ | Tissue | Adj P-value | Log2FC | Malignancy |
| 54776 | PPP1R12C | HCC1_Meng | Human | Liver | HCC | 9.14e-17 | -5.87e-03 | 0.0246 |
| 54776 | PPP1R12C | HCC2_Meng | Human | Liver | HCC | 5.99e-12 | 1.16e-01 | 0.0107 |
| 54776 | PPP1R12C | HCC1 | Human | Liver | HCC | 5.31e-12 | 3.62e+00 | 0.5336 |
| 54776 | PPP1R12C | HCC2 | Human | Liver | HCC | 9.96e-21 | 3.07e+00 | 0.5341 |
| 54776 | PPP1R12C | HCC5 | Human | Liver | HCC | 6.07e-03 | 1.65e+00 | 0.4932 |
| 54776 | PPP1R12C | S014 | Human | Liver | HCC | 2.46e-06 | 2.20e-01 | 0.2254 |
| 54776 | PPP1R12C | S015 | Human | Liver | HCC | 3.05e-05 | 2.63e-01 | 0.2375 |
| 54776 | PPP1R12C | S016 | Human | Liver | HCC | 6.63e-07 | 2.31e-01 | 0.2243 |
| 54776 | PPP1R12C | S027 | Human | Liver | HCC | 5.11e-09 | 5.16e-01 | 0.2446 |
| 54776 | PPP1R12C | S028 | Human | Liver | HCC | 6.66e-17 | 4.97e-01 | 0.2503 |
| 54776 | PPP1R12C | S029 | Human | Liver | HCC | 9.64e-16 | 5.22e-01 | 0.2581 |
| 54776 | PPP1R12C | male-WTA | Human | Thyroid | PTC | 1.42e-14 | 1.86e-01 | 0.1037 |
| 54776 | PPP1R12C | PTC04 | Human | Thyroid | PTC | 7.20e-18 | 3.23e-01 | 0.1927 |
| 54776 | PPP1R12C | PTC05 | Human | Thyroid | PTC | 1.62e-12 | 3.90e-01 | 0.2065 |
| 54776 | PPP1R12C | PTC06 | Human | Thyroid | PTC | 1.74e-15 | 3.98e-01 | 0.2057 |
| 54776 | PPP1R12C | PTC07 | Human | Thyroid | PTC | 1.49e-12 | 2.36e-01 | 0.2044 |
| 54776 | PPP1R12C | ATC11 | Human | Thyroid | ATC | 3.08e-03 | 4.35e-01 | 0.3386 |
| 54776 | PPP1R12C | ATC12 | Human | Thyroid | ATC | 1.30e-08 | 2.18e-01 | 0.34 |
| 54776 | PPP1R12C | ATC13 | Human | Thyroid | ATC | 1.20e-28 | 4.58e-01 | 0.34 |
| 54776 | PPP1R12C | ATC2 | Human | Thyroid | ATC | 4.80e-21 | 1.20e+00 | 0.34 |
| Page: 1 2 |
| Tissue | Expression Dynamics | Abbreviation |
| Liver | 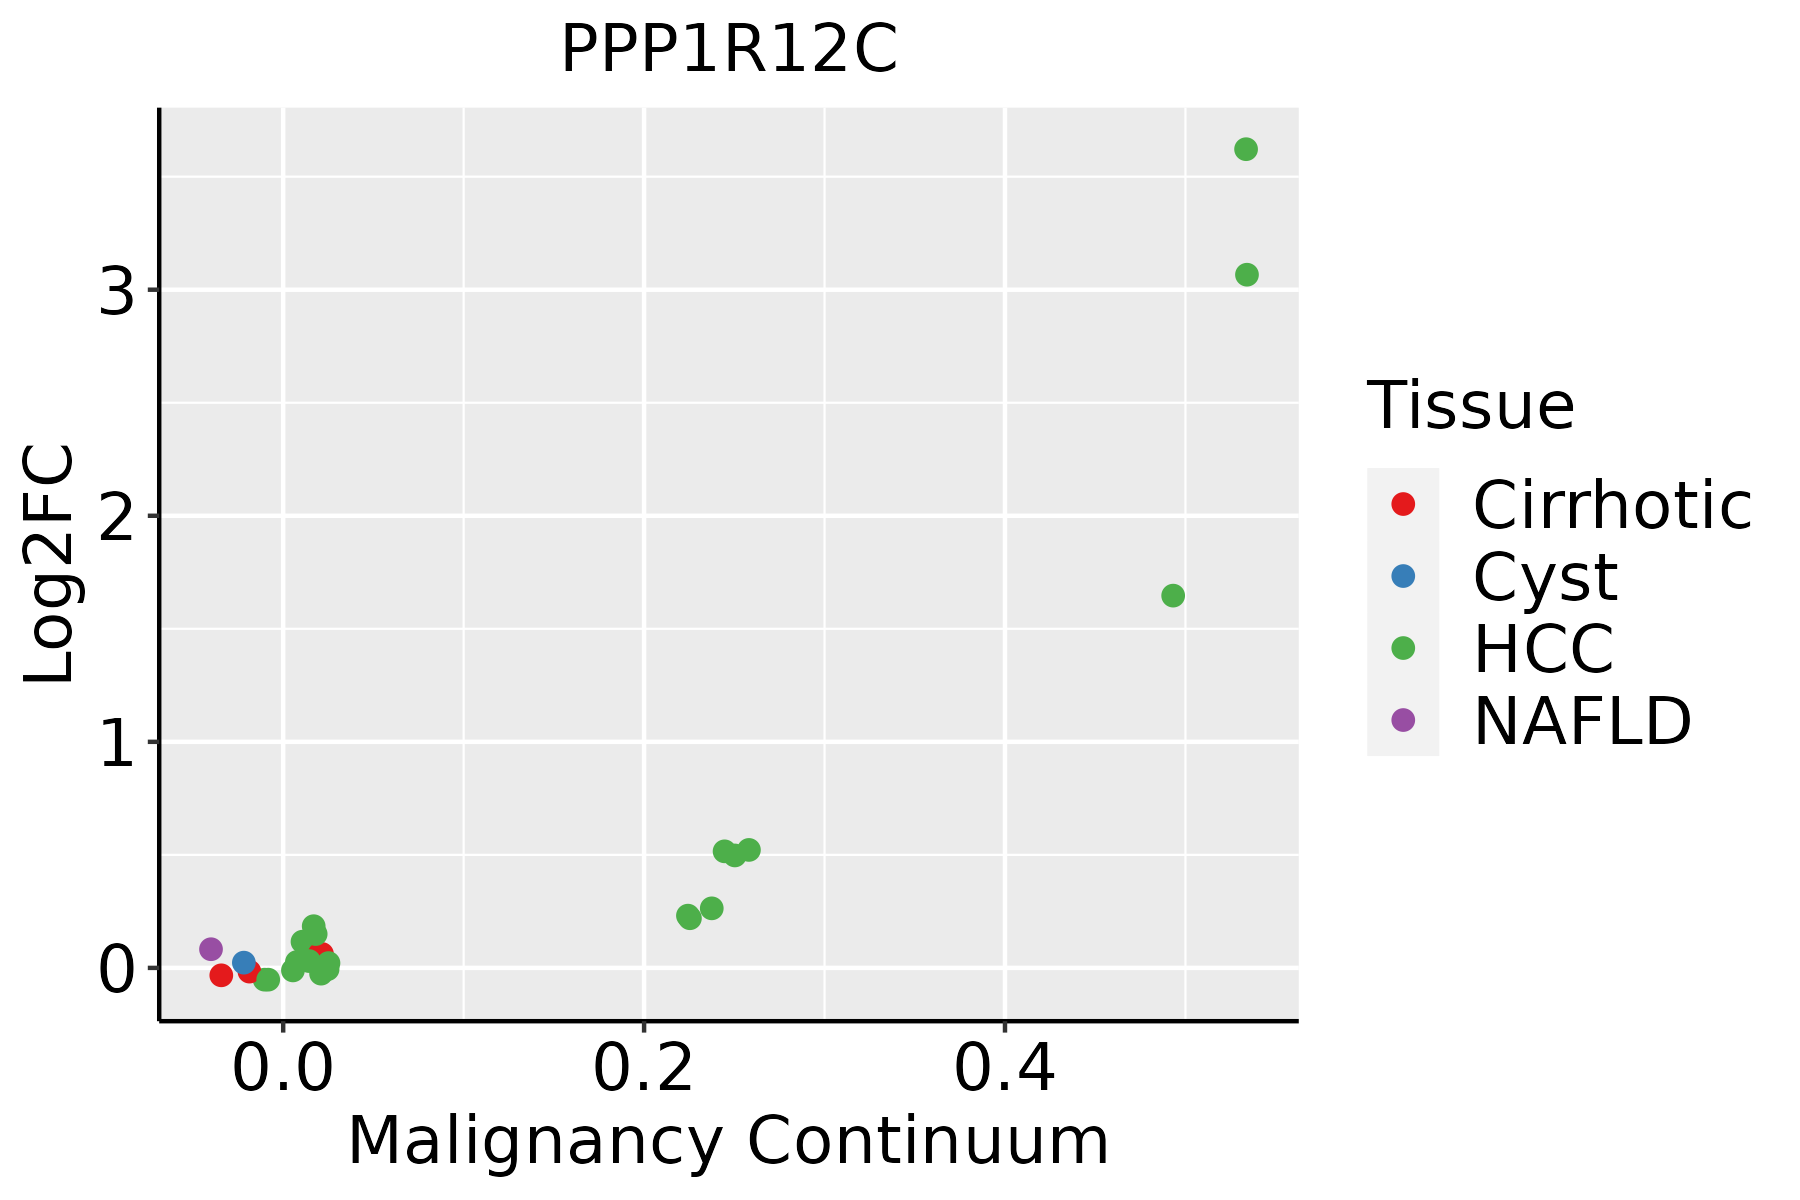 | HCC: Hepatocellular carcinoma |
| NAFLD: Non-alcoholic fatty liver disease | ||
| Thyroid | 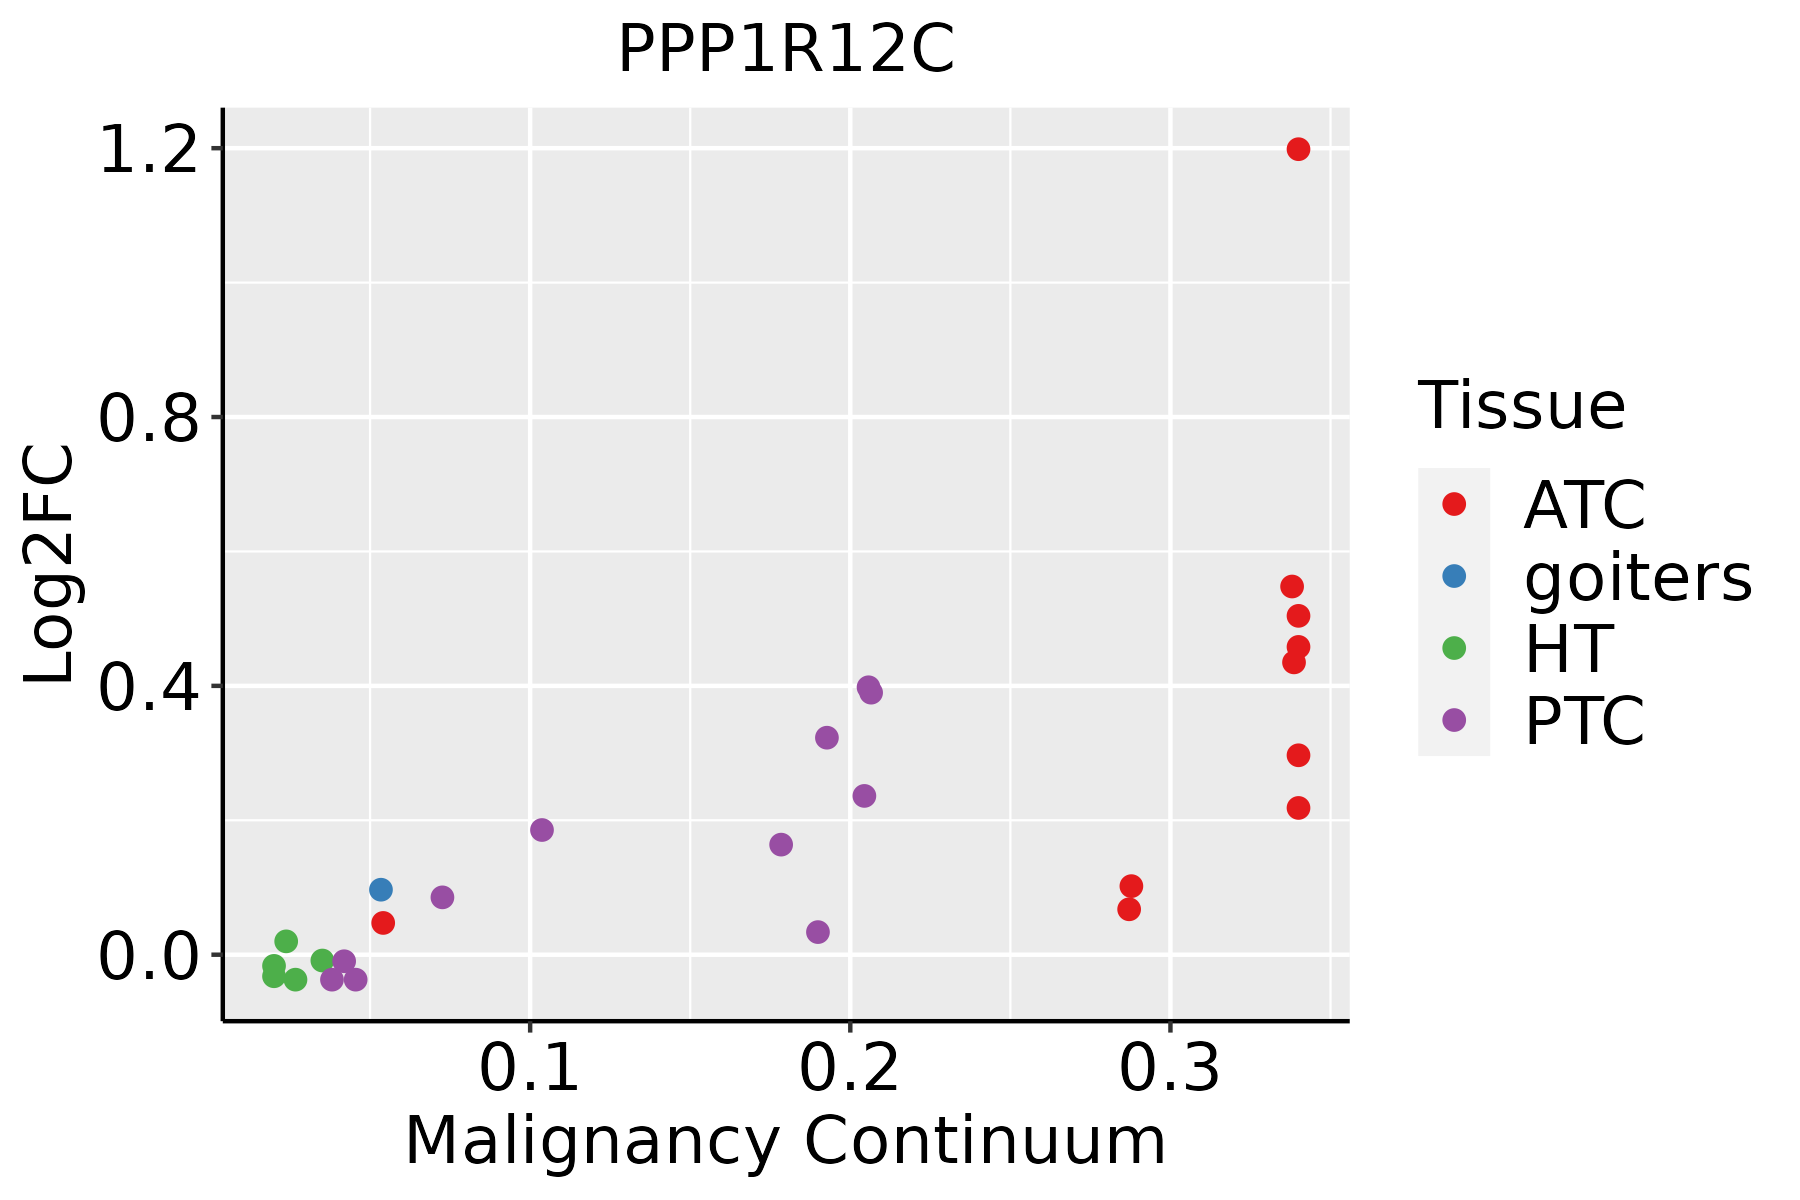 | ATC: Anaplastic thyroid cancer |
| HT: Hashimoto's thyroiditis | ||
| PTC: Papillary thyroid cancer |
| ∗log2FC in expression of this searched gene in stem-like cells from each diseased tissue sample relative to stem-like cells in normal samples in each tissue plotted against the malignancy continuum. Samples are colored based on if they are from different disease stage. |
Top |
Malignant transformation related pathway analysis |
| Find out the enriched GO biological processes and KEGG pathways involved in transition from healthy to precancer to cancer |
| Tissue | Disease Stage | Enriched GO biological Processes |
| Colorectum | AD |  |
| Colorectum | SER |  |
| Colorectum | MSS |  |
| Colorectum | MSI-H |  |
| Colorectum | FAP |  |
| ∗Top 15 enriched GO BP terms are showed in the bar plot of each disease state in each tissue. Each row represents a significant GO biological process which is colored according to the -log10(p.adjust). |
| Page: 1 2 3 4 5 6 7 8 9 |
| GO ID | Tissue | Disease Stage | Description | Gene Ratio | Bg Ratio | pvalue | p.adjust | Count |
| Page: 1 |
| Pathway ID | Tissue | Disease Stage | Description | Gene Ratio | Bg Ratio | pvalue | p.adjust | qvalue | Count |
| hsa0451041 | Liver | HCC | Focal adhesion | 125/4020 | 203/8465 | 3.12e-05 | 1.88e-04 | 1.04e-04 | 125 |
| hsa0481041 | Liver | HCC | Regulation of actin cytoskeleton | 134/4020 | 229/8465 | 4.48e-04 | 1.94e-03 | 1.08e-03 | 134 |
| hsa0520521 | Liver | HCC | Proteoglycans in cancer | 121/4020 | 205/8465 | 5.22e-04 | 2.18e-03 | 1.21e-03 | 121 |
| hsa0451051 | Liver | HCC | Focal adhesion | 125/4020 | 203/8465 | 3.12e-05 | 1.88e-04 | 1.04e-04 | 125 |
| hsa0481051 | Liver | HCC | Regulation of actin cytoskeleton | 134/4020 | 229/8465 | 4.48e-04 | 1.94e-03 | 1.08e-03 | 134 |
| hsa0520531 | Liver | HCC | Proteoglycans in cancer | 121/4020 | 205/8465 | 5.22e-04 | 2.18e-03 | 1.21e-03 | 121 |
| Page: 1 |
Top |
Cell-cell communication analysis |
| Identification of potential cell-cell interactions between two cell types and their ligand-receptor pairs for different disease states |
| Ligand | Receptor | LRpair | Pathway | Tissue | Disease Stage |
| Page: 1 |
Top |
Single-cell gene regulatory network inference analysis |
| Find out the significant the regulons (TFs) and the target genes of each regulon across cell types for different disease states |
| TF | Cell Type | Tissue | Disease Stage | Target Gene | RSS | Regulon Activity |
| ∗The dot plots of a searched regulon are shown for all cell subpopulations in each disease state of each tissue based on the regulon specific score inferred using pySCENIC and by calculating the average expression. |
| Page: 1 |
Top |
Somatic mutation of malignant transformation related genes |
| Annotation of somatic variants for genes involved in malignant transformation |
| Hugo Symbol | Variant Class | Variant Classification | dbSNP RS | HGVSc | HGVSp | HGVSp Short | SWISSPROT | BIOTYPE | SIFT | PolyPhen | Tumor Sample Barcode | Tissue | Histology | Sex | Age | Stage | Therapy Types | Drugs | Outcome |
| PPP1R12C | SNV | Missense_Mutation | c.2119N>T | p.Arg707Trp | p.R707W | Q9BZL4 | protein_coding | deleterious(0.03) | benign(0.353) | TCGA-E9-A1N3-01 | Breast | breast invasive carcinoma | Female | >=65 | III/IV | Chemotherapy | 5-fluorouracil | CR | |
| PPP1R12C | deletion | Frame_Shift_Del | novel | c.324delN | p.Cys109AlafsTer19 | p.C109Afs*19 | Q9BZL4 | protein_coding | TCGA-EW-A2FV-01 | Breast | breast invasive carcinoma | Female | <65 | III/IV | Chemotherapy | docetaxel | SD | ||
| PPP1R12C | SNV | Missense_Mutation | rs773125943 | c.2176N>A | p.Ala726Thr | p.A726T | Q9BZL4 | protein_coding | tolerated(0.39) | benign(0.299) | TCGA-2W-A8YY-01 | Cervix | cervical & endocervical cancer | Female | <65 | I/II | Chemotherapy | cisplatin | CR |
| PPP1R12C | SNV | Missense_Mutation | rs771184538 | c.1580N>A | p.Arg527Gln | p.R527Q | Q9BZL4 | protein_coding | tolerated(0.12) | benign(0.014) | TCGA-2W-A8YY-01 | Cervix | cervical & endocervical cancer | Female | <65 | I/II | Chemotherapy | cisplatin | CR |
| PPP1R12C | SNV | Missense_Mutation | novel | c.1052N>A | p.Arg351His | p.R351H | Q9BZL4 | protein_coding | deleterious(0) | possibly_damaging(0.869) | TCGA-2W-A8YY-01 | Cervix | cervical & endocervical cancer | Female | <65 | I/II | Chemotherapy | cisplatin | CR |
| PPP1R12C | SNV | Missense_Mutation | novel | c.679N>A | p.Gly227Ser | p.G227S | Q9BZL4 | protein_coding | deleterious(0) | probably_damaging(0.993) | TCGA-2W-A8YY-01 | Cervix | cervical & endocervical cancer | Female | <65 | I/II | Chemotherapy | cisplatin | CR |
| PPP1R12C | SNV | Missense_Mutation | rs762056914 | c.1418C>T | p.Pro473Leu | p.P473L | Q9BZL4 | protein_coding | deleterious(0) | benign(0.245) | TCGA-EA-A410-01 | Cervix | cervical & endocervical cancer | Female | <65 | I/II | Unknown | Unknown | SD |
| PPP1R12C | SNV | Missense_Mutation | c.766C>T | p.Arg256Trp | p.R256W | Q9BZL4 | protein_coding | deleterious(0) | probably_damaging(0.998) | TCGA-AY-6197-01 | Colorectum | colon adenocarcinoma | Male | <65 | I/II | Unknown | Unknown | SD | |
| PPP1R12C | SNV | Missense_Mutation | c.2315N>T | p.Ala772Val | p.A772V | Q9BZL4 | protein_coding | deleterious(0) | probably_damaging(0.986) | TCGA-G4-6320-01 | Colorectum | colon adenocarcinoma | Male | >=65 | III/IV | Chemotherapy | oxaliplatin | SD | |
| PPP1R12C | SNV | Missense_Mutation | c.1804N>A | p.Ser602Thr | p.S602T | Q9BZL4 | protein_coding | tolerated(0.1) | benign(0) | TCGA-G4-6586-01 | Colorectum | colon adenocarcinoma | Female | >=65 | I/II | Unknown | Unknown | SD |
| Page: 1 2 3 4 5 6 7 |
Top |
Related drugs of malignant transformation related genes |
| Identification of chemicals and drugs interact with genes involved in malignant transfromation |
| (DGIdb 4.0) |
| Entrez ID | Symbol | Category | Interaction Types | Drug Claim Name | Drug Name | PMIDs |
| Page: 1 |

Copyright 2023-Present -The University of Texas Health Science Center at Houston |