
|
|||||
|
 | |
| |
| |
| |
| |
| |
|
Gene: PPP1R11 |
Gene summary for PPP1R11 |
| Gene information | Species | Human | Gene symbol | PPP1R11 | Gene ID | 6992 |
| Gene name | protein phosphatase 1 regulatory inhibitor subunit 11 | |
| Gene Alias | CFAP255 | |
| Cytomap | 6p22.1 | |
| Gene Type | protein-coding | GO ID | GO:0001816 | UniProtAcc | A2BEK1 |
Top |
Malignant transformation analysis |
| Identification of the aberrant gene expression in precancerous and cancerous lesions by comparing the gene expression of stem-like cells in diseased tissues with normal stem cells |
| Entrez ID | Symbol | Replicates | Species | Organ | Tissue | Adj P-value | Log2FC | Malignancy |
| 6992 | PPP1R11 | LZE4T | Human | Esophagus | ESCC | 3.34e-18 | 4.49e-01 | 0.0811 |
| 6992 | PPP1R11 | LZE5T | Human | Esophagus | ESCC | 6.99e-03 | 2.50e-01 | 0.0514 |
| 6992 | PPP1R11 | LZE7T | Human | Esophagus | ESCC | 1.57e-07 | 4.93e-01 | 0.0667 |
| 6992 | PPP1R11 | LZE8T | Human | Esophagus | ESCC | 5.44e-09 | 4.89e-01 | 0.067 |
| 6992 | PPP1R11 | LZE20T | Human | Esophagus | ESCC | 3.74e-18 | 5.84e-01 | 0.0662 |
| 6992 | PPP1R11 | LZE22D1 | Human | Esophagus | HGIN | 4.11e-03 | 2.14e-01 | 0.0595 |
| 6992 | PPP1R11 | LZE22T | Human | Esophagus | ESCC | 2.80e-06 | 8.17e-01 | 0.068 |
| 6992 | PPP1R11 | LZE24T | Human | Esophagus | ESCC | 2.26e-31 | 8.76e-01 | 0.0596 |
| 6992 | PPP1R11 | LZE6T | Human | Esophagus | ESCC | 3.08e-11 | 6.50e-01 | 0.0845 |
| 6992 | PPP1R11 | P1T-E | Human | Esophagus | ESCC | 9.01e-16 | 9.09e-01 | 0.0875 |
| 6992 | PPP1R11 | P2T-E | Human | Esophagus | ESCC | 1.08e-41 | 7.03e-01 | 0.1177 |
| 6992 | PPP1R11 | P4T-E | Human | Esophagus | ESCC | 5.72e-37 | 8.72e-01 | 0.1323 |
| 6992 | PPP1R11 | P5T-E | Human | Esophagus | ESCC | 5.05e-26 | 4.57e-01 | 0.1327 |
| 6992 | PPP1R11 | P8T-E | Human | Esophagus | ESCC | 3.49e-38 | 5.58e-01 | 0.0889 |
| 6992 | PPP1R11 | P9T-E | Human | Esophagus | ESCC | 2.32e-14 | 3.82e-01 | 0.1131 |
| 6992 | PPP1R11 | P10T-E | Human | Esophagus | ESCC | 1.46e-33 | 4.62e-01 | 0.116 |
| 6992 | PPP1R11 | P11T-E | Human | Esophagus | ESCC | 3.99e-23 | 7.71e-01 | 0.1426 |
| 6992 | PPP1R11 | P12T-E | Human | Esophagus | ESCC | 2.97e-38 | 6.28e-01 | 0.1122 |
| 6992 | PPP1R11 | P15T-E | Human | Esophagus | ESCC | 4.98e-28 | 6.47e-01 | 0.1149 |
| 6992 | PPP1R11 | P16T-E | Human | Esophagus | ESCC | 4.37e-30 | 5.51e-01 | 0.1153 |
| Page: 1 2 3 4 5 6 |
| Tissue | Expression Dynamics | Abbreviation |
| Esophagus | 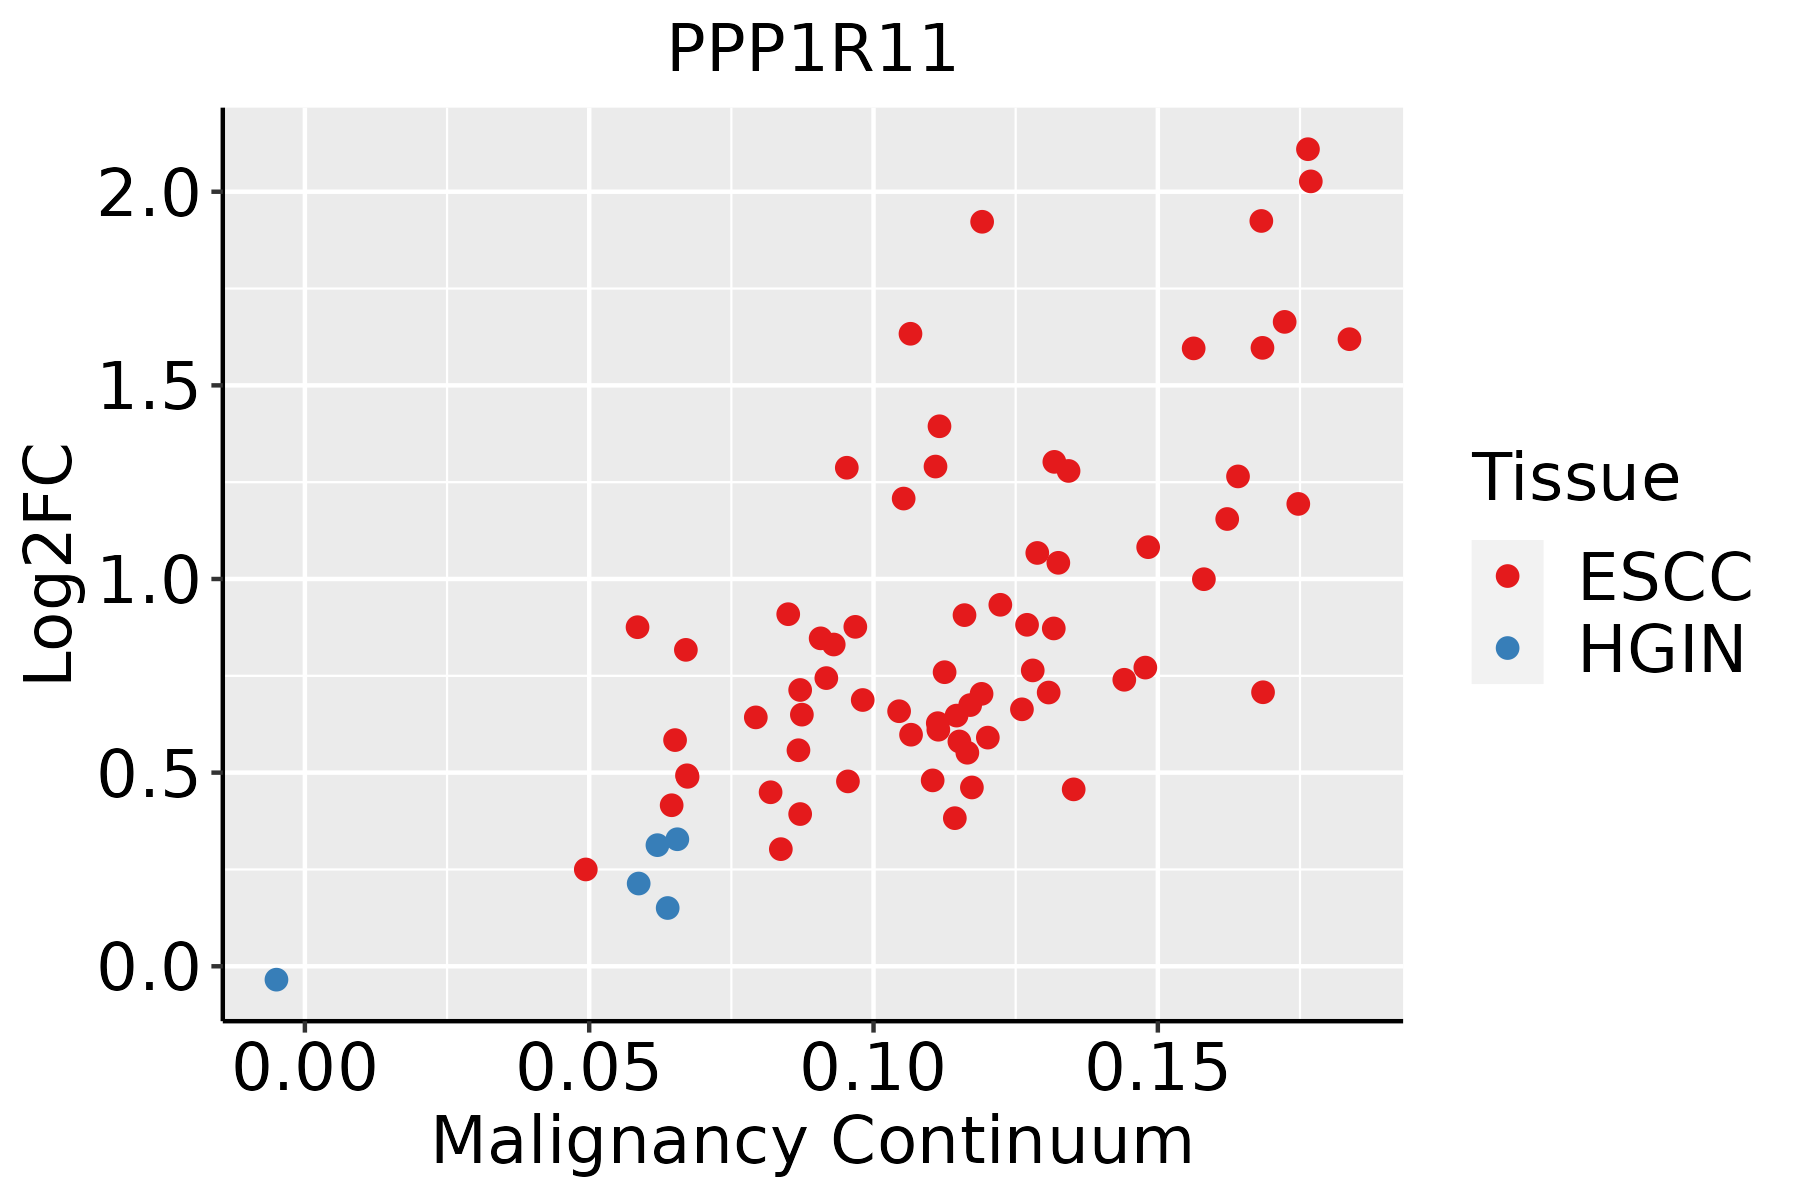 | ESCC: Esophageal squamous cell carcinoma |
| HGIN: High-grade intraepithelial neoplasias | ||
| LGIN: Low-grade intraepithelial neoplasias | ||
| Liver | 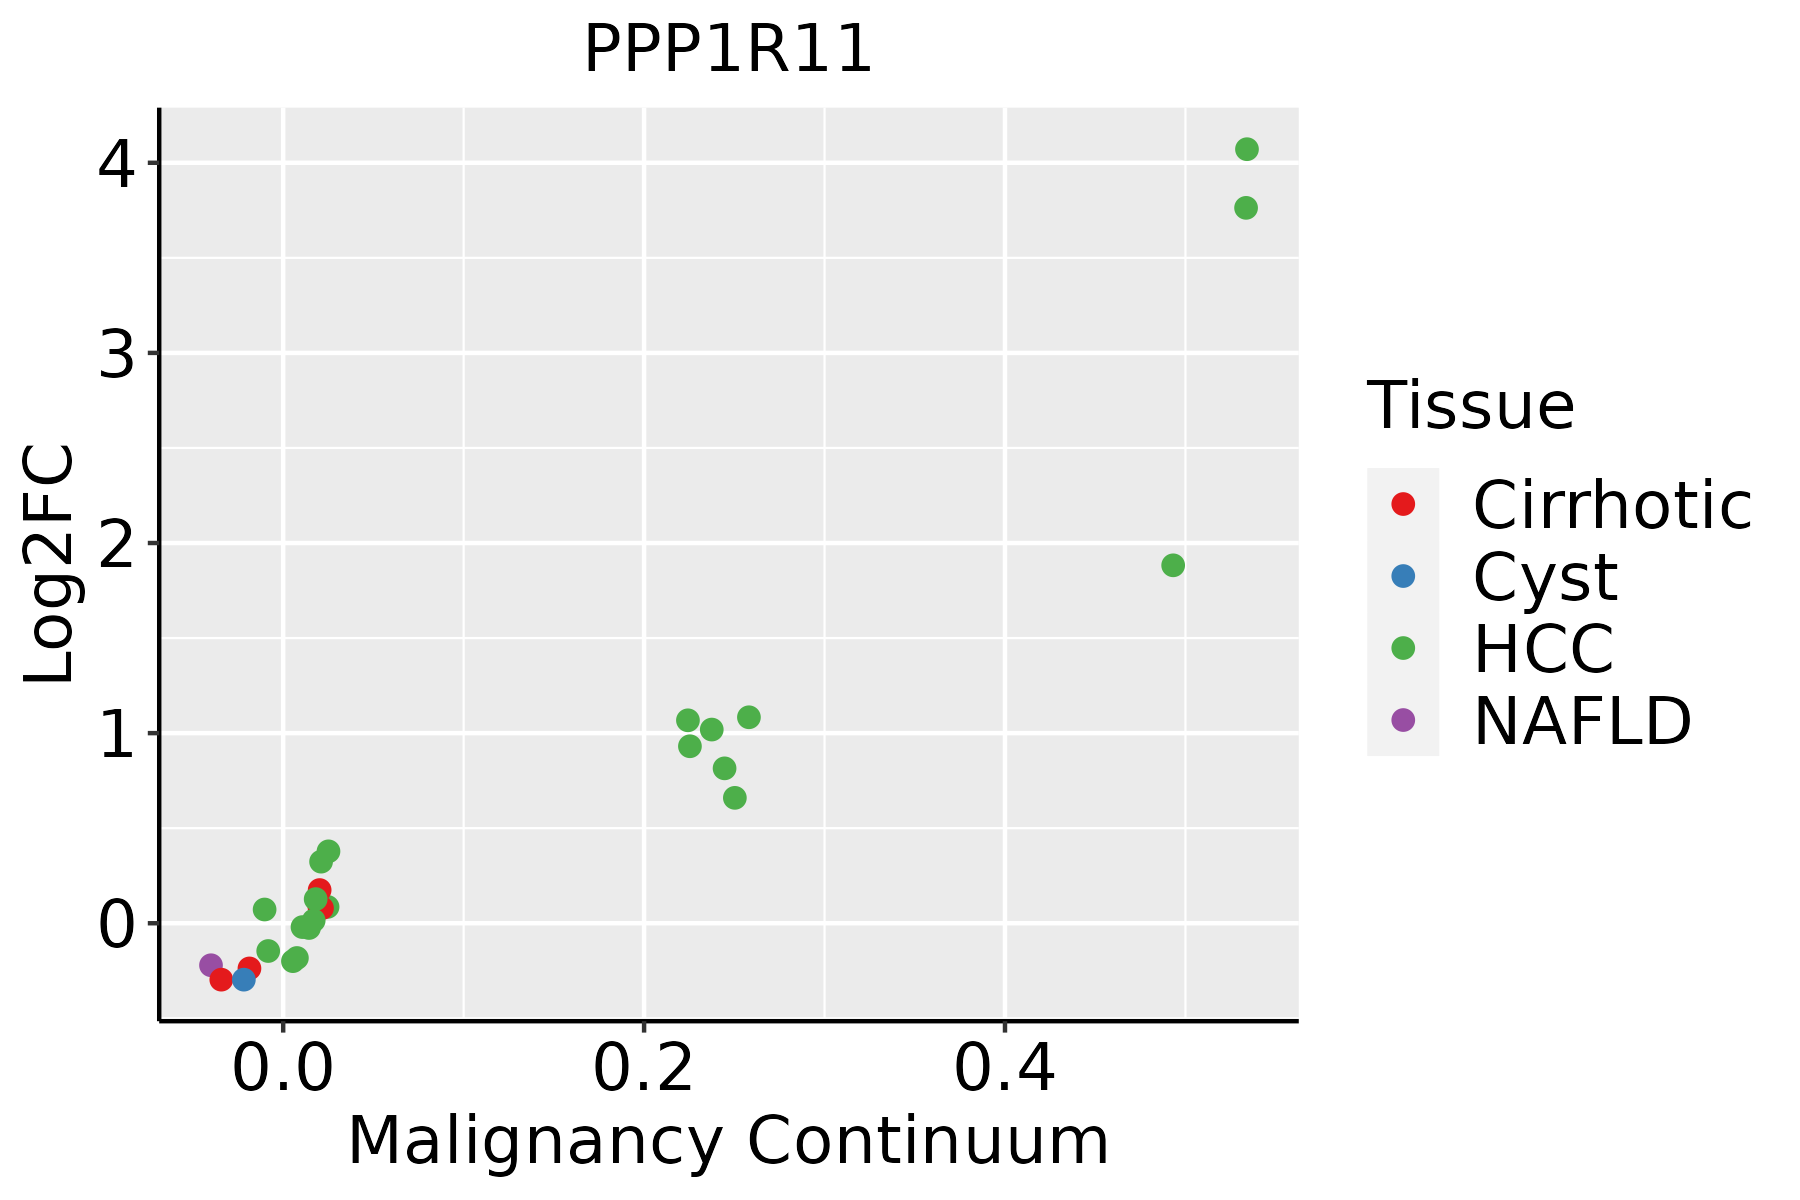 | HCC: Hepatocellular carcinoma |
| NAFLD: Non-alcoholic fatty liver disease | ||
| Oral Cavity | 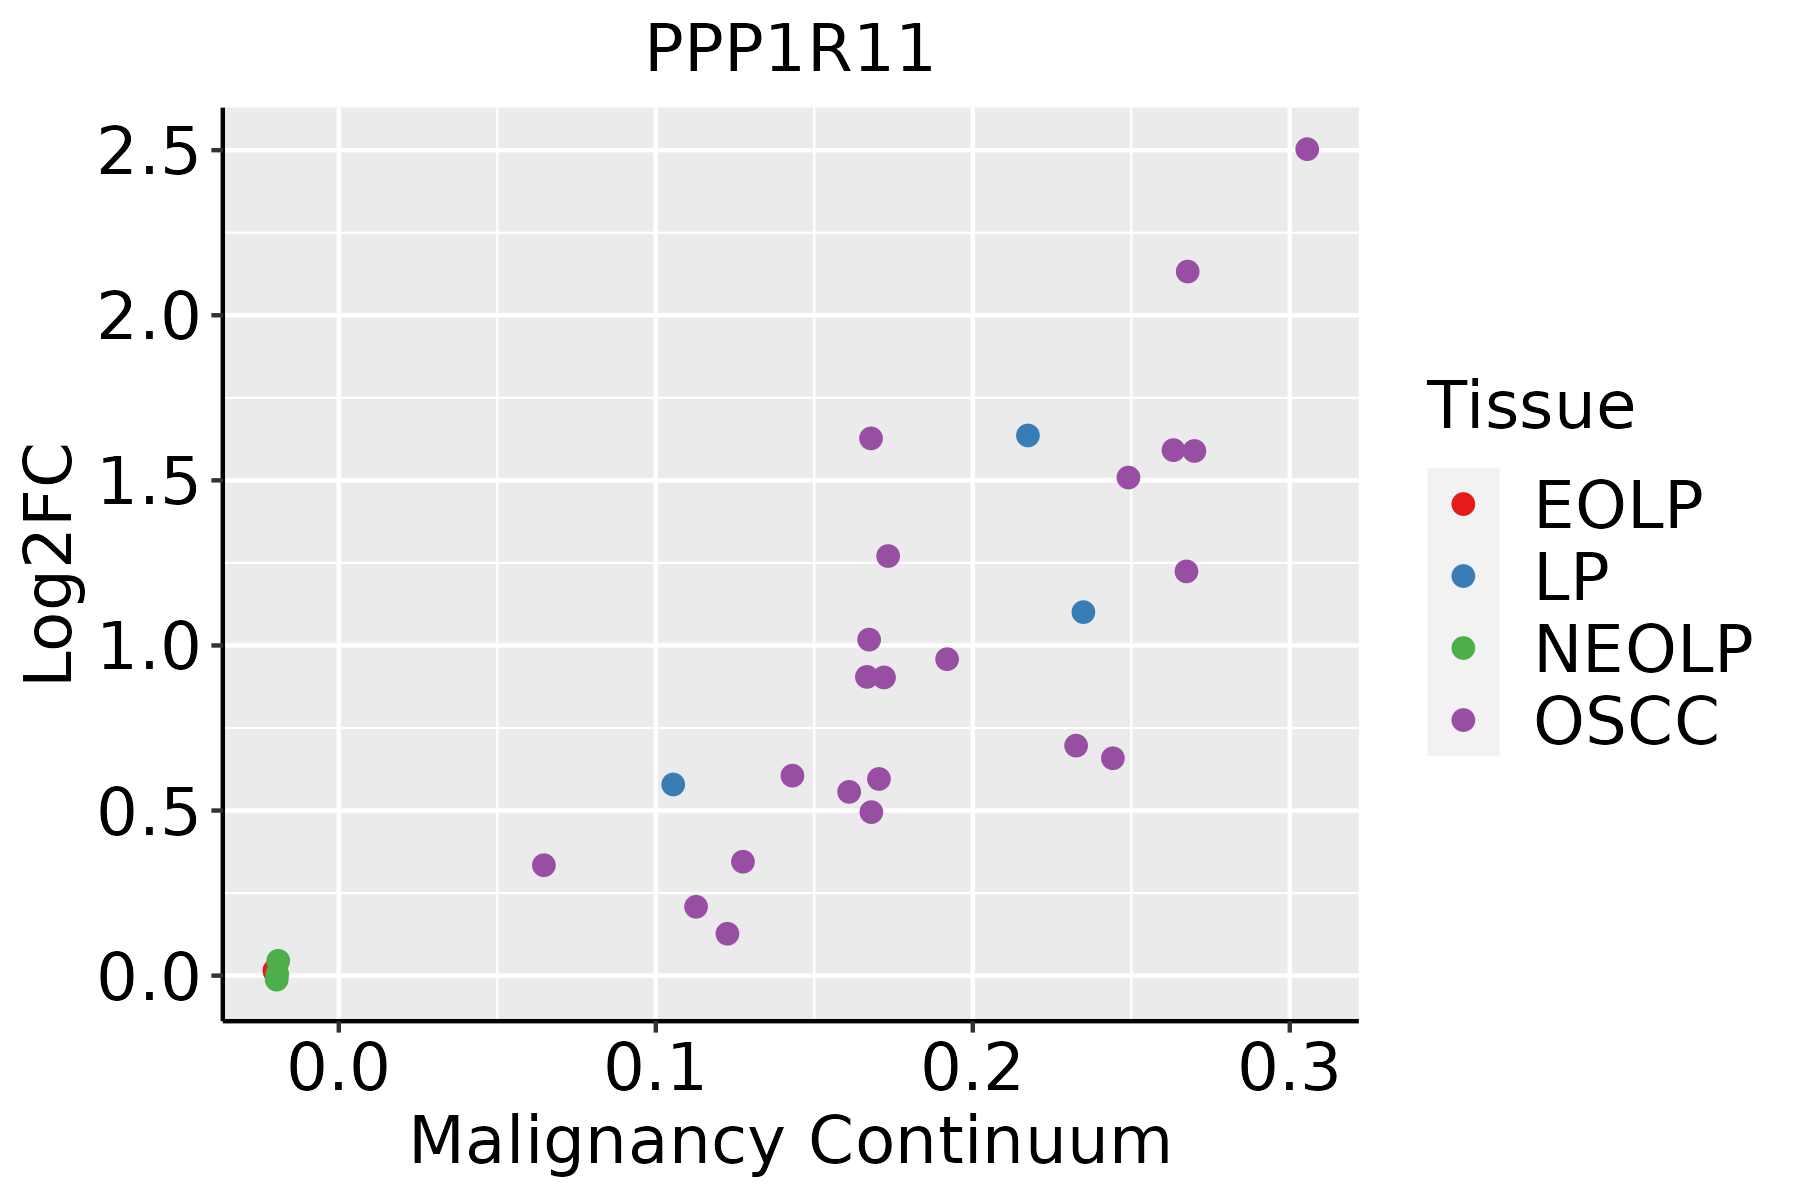 | EOLP: Erosive Oral lichen planus |
| LP: leukoplakia | ||
| NEOLP: Non-erosive oral lichen planus | ||
| OSCC: Oral squamous cell carcinoma | ||
| Skin | 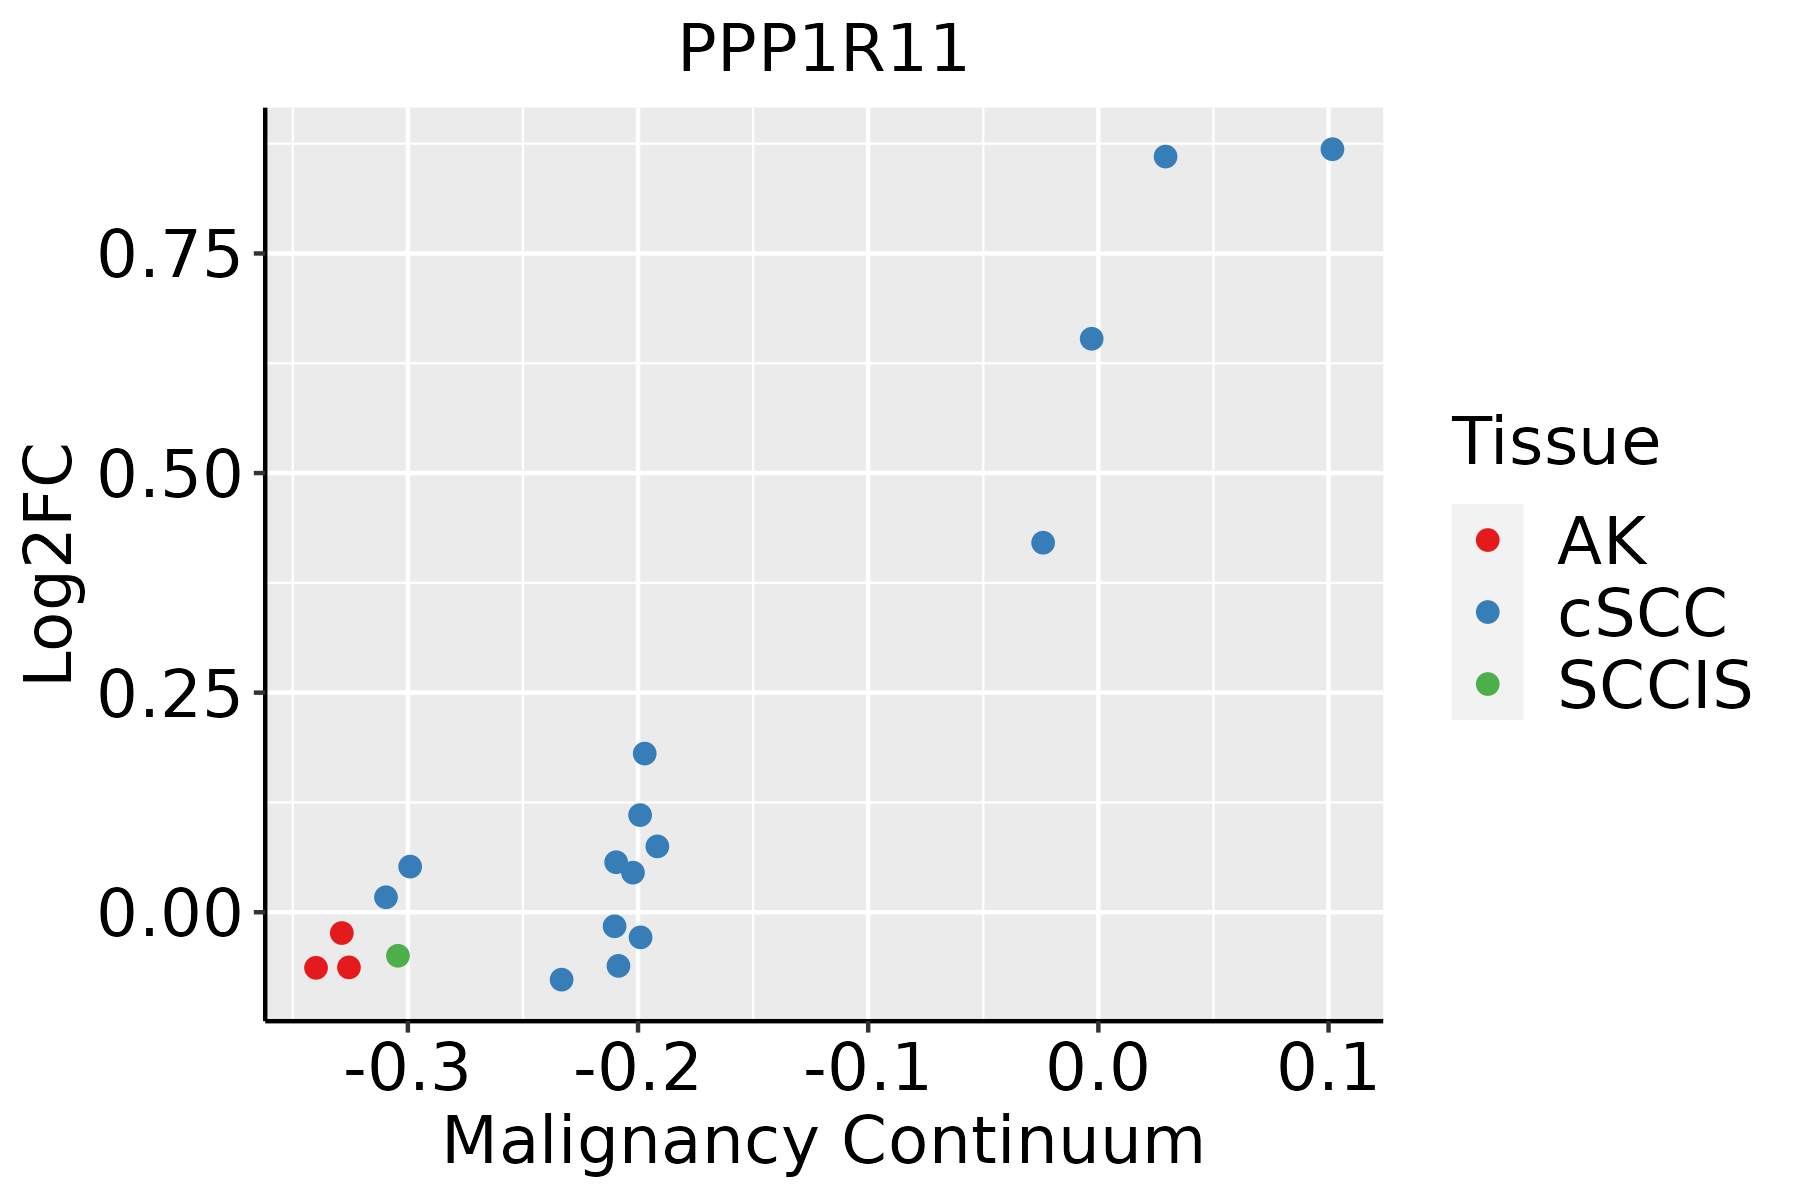 | AK: Actinic keratosis |
| cSCC: Cutaneous squamous cell carcinoma | ||
| SCCIS:squamous cell carcinoma in situ |
| ∗log2FC in expression of this searched gene in stem-like cells from each diseased tissue sample relative to stem-like cells in normal samples in each tissue plotted against the malignancy continuum. Samples are colored based on if they are from different disease stage. |
Top |
Malignant transformation related pathway analysis |
| Find out the enriched GO biological processes and KEGG pathways involved in transition from healthy to precancer to cancer |
| Tissue | Disease Stage | Enriched GO biological Processes |
| Colorectum | AD |  |
| Colorectum | SER |  |
| Colorectum | MSS |  |
| Colorectum | MSI-H |  |
| Colorectum | FAP |  |
| ∗Top 15 enriched GO BP terms are showed in the bar plot of each disease state in each tissue. Each row represents a significant GO biological process which is colored according to the -log10(p.adjust). |
| Page: 1 2 3 4 5 6 7 8 9 |
| GO ID | Tissue | Disease Stage | Description | Gene Ratio | Bg Ratio | pvalue | p.adjust | Count |
| GO:004593626 | Esophagus | HGIN | negative regulation of phosphate metabolic process | 89/2587 | 441/18723 | 1.24e-04 | 2.54e-03 | 89 |
| GO:001056326 | Esophagus | HGIN | negative regulation of phosphorus metabolic process | 89/2587 | 442/18723 | 1.34e-04 | 2.71e-03 | 89 |
| GO:000647017 | Esophagus | HGIN | protein dephosphorylation | 61/2587 | 281/18723 | 1.86e-04 | 3.51e-03 | 61 |
| GO:003530425 | Esophagus | HGIN | regulation of protein dephosphorylation | 24/2587 | 90/18723 | 9.27e-04 | 1.17e-02 | 24 |
| GO:005134620 | Esophagus | HGIN | negative regulation of hydrolase activity | 72/2587 | 379/18723 | 2.81e-03 | 2.75e-02 | 72 |
| GO:004366619 | Esophagus | HGIN | regulation of phosphoprotein phosphatase activity | 16/2587 | 58/18723 | 4.35e-03 | 3.84e-02 | 16 |
| GO:003530320 | Esophagus | HGIN | regulation of dephosphorylation | 29/2587 | 128/18723 | 4.41e-03 | 3.87e-02 | 29 |
| GO:0010563111 | Esophagus | ESCC | negative regulation of phosphorus metabolic process | 274/8552 | 442/18723 | 2.32e-12 | 9.41e-11 | 274 |
| GO:0045936111 | Esophagus | ESCC | negative regulation of phosphate metabolic process | 273/8552 | 441/18723 | 3.18e-12 | 1.25e-10 | 273 |
| GO:001631110 | Esophagus | ESCC | dephosphorylation | 251/8552 | 417/18723 | 1.26e-09 | 2.99e-08 | 251 |
| GO:000647018 | Esophagus | ESCC | protein dephosphorylation | 177/8552 | 281/18723 | 3.13e-09 | 6.72e-08 | 177 |
| GO:0035304111 | Esophagus | ESCC | regulation of protein dephosphorylation | 66/8552 | 90/18723 | 8.82e-08 | 1.48e-06 | 66 |
| GO:0035303111 | Esophagus | ESCC | regulation of dephosphorylation | 88/8552 | 128/18723 | 1.04e-07 | 1.71e-06 | 88 |
| GO:0051346110 | Esophagus | ESCC | negative regulation of hydrolase activity | 208/8552 | 379/18723 | 1.76e-04 | 1.14e-03 | 208 |
| GO:003530816 | Esophagus | ESCC | negative regulation of protein dephosphorylation | 26/8552 | 34/18723 | 2.53e-04 | 1.55e-03 | 26 |
| GO:0043666110 | Esophagus | ESCC | regulation of phosphoprotein phosphatase activity | 40/8552 | 58/18723 | 2.83e-04 | 1.71e-03 | 40 |
| GO:00353056 | Esophagus | ESCC | negative regulation of dephosphorylation | 31/8552 | 45/18723 | 1.40e-03 | 6.62e-03 | 31 |
| GO:001092115 | Esophagus | ESCC | regulation of phosphatase activity | 52/8552 | 84/18723 | 1.98e-03 | 8.90e-03 | 52 |
| GO:00325155 | Esophagus | ESCC | negative regulation of phosphoprotein phosphatase activity | 19/8552 | 26/18723 | 4.31e-03 | 1.71e-02 | 19 |
| GO:005134612 | Liver | Cirrhotic | negative regulation of hydrolase activity | 139/4634 | 379/18723 | 1.24e-07 | 3.42e-06 | 139 |
| Page: 1 2 3 4 |
| Pathway ID | Tissue | Disease Stage | Description | Gene Ratio | Bg Ratio | pvalue | p.adjust | qvalue | Count |
| Page: 1 |
Top |
Cell-cell communication analysis |
| Identification of potential cell-cell interactions between two cell types and their ligand-receptor pairs for different disease states |
| Ligand | Receptor | LRpair | Pathway | Tissue | Disease Stage |
| Page: 1 |
Top |
Single-cell gene regulatory network inference analysis |
| Find out the significant the regulons (TFs) and the target genes of each regulon across cell types for different disease states |
| TF | Cell Type | Tissue | Disease Stage | Target Gene | RSS | Regulon Activity |
| ∗The dot plots of a searched regulon are shown for all cell subpopulations in each disease state of each tissue based on the regulon specific score inferred using pySCENIC and by calculating the average expression. |
| Page: 1 |
Top |
Somatic mutation of malignant transformation related genes |
| Annotation of somatic variants for genes involved in malignant transformation |
| Hugo Symbol | Variant Class | Variant Classification | dbSNP RS | HGVSc | HGVSp | HGVSp Short | SWISSPROT | BIOTYPE | SIFT | PolyPhen | Tumor Sample Barcode | Tissue | Histology | Sex | Age | Stage | Therapy Types | Drugs | Outcome |
| PPP1R11 | SNV | Missense_Mutation | c.70G>A | p.Glu24Lys | p.E24K | O60927 | protein_coding | tolerated(0.37) | probably_damaging(0.992) | TCGA-A6-2681-01 | Colorectum | colon adenocarcinoma | Female | >=65 | I/II | Unknown | Unknown | PD | |
| PPP1R11 | SNV | Missense_Mutation | novel | c.97N>T | p.Arg33Trp | p.R33W | O60927 | protein_coding | deleterious(0) | probably_damaging(0.941) | TCGA-A5-A2K5-01 | Endometrium | uterine corpus endometrioid carcinoma | Female | >=65 | I/II | Unknown | Unknown | SD |
| PPP1R11 | SNV | Missense_Mutation | rs770307762 | c.299G>A | p.Arg100His | p.R100H | O60927 | protein_coding | tolerated(0.19) | benign(0) | TCGA-AJ-A2QO-01 | Endometrium | uterine corpus endometrioid carcinoma | Female | >=65 | I/II | Unknown | Unknown | SD |
| PPP1R11 | SNV | Missense_Mutation | novel | c.97N>T | p.Arg33Trp | p.R33W | O60927 | protein_coding | deleterious(0) | probably_damaging(0.941) | TCGA-AJ-A5DW-01 | Endometrium | uterine corpus endometrioid carcinoma | Female | <65 | I/II | Unknown | Unknown | SD |
| PPP1R11 | SNV | Missense_Mutation | novel | c.58N>G | p.Thr20Ala | p.T20A | O60927 | protein_coding | tolerated(0.76) | benign(0.157) | TCGA-EO-A22R-01 | Endometrium | uterine corpus endometrioid carcinoma | Female | <65 | I/II | Unknown | Unknown | SD |
| PPP1R11 | SNV | Missense_Mutation | novel | c.97N>T | p.Arg33Trp | p.R33W | O60927 | protein_coding | deleterious(0) | probably_damaging(0.941) | TCGA-EO-A3B0-01 | Endometrium | uterine corpus endometrioid carcinoma | Female | <65 | III/IV | Unknown | Unknown | SD |
| PPP1R11 | SNV | Missense_Mutation | novel | c.97C>T | p.Arg33Trp | p.R33W | O60927 | protein_coding | deleterious(0) | probably_damaging(0.941) | TCGA-EY-A1GI-01 | Endometrium | uterine corpus endometrioid carcinoma | Female | <65 | I/II | Unknown | Unknown | SD |
| PPP1R11 | SNV | Missense_Mutation | novel | c.30N>T | p.Glu10Asp | p.E10D | O60927 | protein_coding | tolerated(0.07) | benign(0.084) | TCGA-DD-AACQ-01 | Liver | liver hepatocellular carcinoma | Male | <65 | I/II | Unknown | Unknown | PD |
| PPP1R11 | SNV | Missense_Mutation | c.7G>A | p.Glu3Lys | p.E3K | O60927 | protein_coding | deleterious(0.01) | probably_damaging(0.959) | TCGA-55-A4DF-01 | Lung | lung adenocarcinoma | Male | >=65 | I/II | Unknown | Unknown | PD | |
| PPP1R11 | SNV | Missense_Mutation | novel | c.19G>A | p.Gly7Arg | p.G7R | O60927 | protein_coding | tolerated(0.22) | benign(0.347) | TCGA-CN-5360-01 | Oral cavity | head & neck squamous cell carcinoma | Male | >=65 | I/II | Chemotherapy | cisplatin | SD |
| Page: 1 2 |
Top |
Related drugs of malignant transformation related genes |
| Identification of chemicals and drugs interact with genes involved in malignant transfromation |
| (DGIdb 4.0) |
| Entrez ID | Symbol | Category | Interaction Types | Drug Claim Name | Drug Name | PMIDs |
| Page: 1 |

Copyright 2023-Present -The University of Texas Health Science Center at Houston |