
|
|||||
|
 | |
| |
| |
| |
| |
| |
|
Gene: PPP1CB |
Gene summary for PPP1CB |
| Gene information | Species | Human | Gene symbol | PPP1CB | Gene ID | 5500 |
| Gene name | protein phosphatase 1 catalytic subunit beta | |
| Gene Alias | HEL-S-80p | |
| Cytomap | 2p23.2 | |
| Gene Type | protein-coding | GO ID | GO:0000165 | UniProtAcc | P62140 |
Top |
Malignant transformation analysis |
| Identification of the aberrant gene expression in precancerous and cancerous lesions by comparing the gene expression of stem-like cells in diseased tissues with normal stem cells |
| Entrez ID | Symbol | Replicates | Species | Organ | Tissue | Adj P-value | Log2FC | Malignancy |
| 5500 | PPP1CB | GSM4909280 | Human | Breast | Precancer | 6.68e-04 | -5.90e-01 | 0.0305 |
| 5500 | PPP1CB | GSM4909281 | Human | Breast | IDC | 7.17e-11 | 4.52e-01 | 0.21 |
| 5500 | PPP1CB | GSM4909286 | Human | Breast | IDC | 8.72e-12 | -3.27e-01 | 0.1081 |
| 5500 | PPP1CB | GSM4909287 | Human | Breast | IDC | 8.37e-03 | 2.49e-01 | 0.2057 |
| 5500 | PPP1CB | GSM4909291 | Human | Breast | IDC | 2.59e-06 | -4.22e-01 | 0.1753 |
| 5500 | PPP1CB | GSM4909294 | Human | Breast | IDC | 1.05e-06 | -1.56e-02 | 0.2022 |
| 5500 | PPP1CB | GSM4909296 | Human | Breast | IDC | 2.56e-28 | -5.15e-01 | 0.1524 |
| 5500 | PPP1CB | GSM4909297 | Human | Breast | IDC | 4.68e-34 | 2.78e-01 | 0.1517 |
| 5500 | PPP1CB | GSM4909298 | Human | Breast | IDC | 1.88e-07 | -3.25e-01 | 0.1551 |
| 5500 | PPP1CB | GSM4909301 | Human | Breast | IDC | 1.33e-14 | -4.03e-01 | 0.1577 |
| 5500 | PPP1CB | GSM4909302 | Human | Breast | IDC | 2.99e-16 | -4.64e-01 | 0.1545 |
| 5500 | PPP1CB | GSM4909304 | Human | Breast | IDC | 1.49e-02 | 3.06e-01 | 0.1636 |
| 5500 | PPP1CB | GSM4909306 | Human | Breast | IDC | 2.49e-04 | -3.78e-01 | 0.1564 |
| 5500 | PPP1CB | GSM4909307 | Human | Breast | IDC | 4.02e-06 | -2.79e-01 | 0.1569 |
| 5500 | PPP1CB | GSM4909308 | Human | Breast | IDC | 2.84e-06 | -3.27e-01 | 0.158 |
| 5500 | PPP1CB | GSM4909309 | Human | Breast | IDC | 1.14e-03 | -7.84e-02 | 0.0483 |
| 5500 | PPP1CB | GSM4909311 | Human | Breast | IDC | 3.60e-51 | -7.12e-01 | 0.1534 |
| 5500 | PPP1CB | GSM4909312 | Human | Breast | IDC | 1.94e-26 | -4.48e-01 | 0.1552 |
| 5500 | PPP1CB | GSM4909313 | Human | Breast | IDC | 8.95e-08 | 2.66e-01 | 0.0391 |
| 5500 | PPP1CB | GSM4909319 | Human | Breast | IDC | 5.80e-59 | -7.77e-01 | 0.1563 |
| Page: 1 2 3 4 5 6 7 8 9 10 11 |
| Tissue | Expression Dynamics | Abbreviation |
| Breast |  | IDC: Invasive ductal carcinoma |
| DCIS: Ductal carcinoma in situ | ||
| Precancer(BRCA1-mut): Precancerous lesion from BRCA1 mutation carriers | ||
| Endometrium | 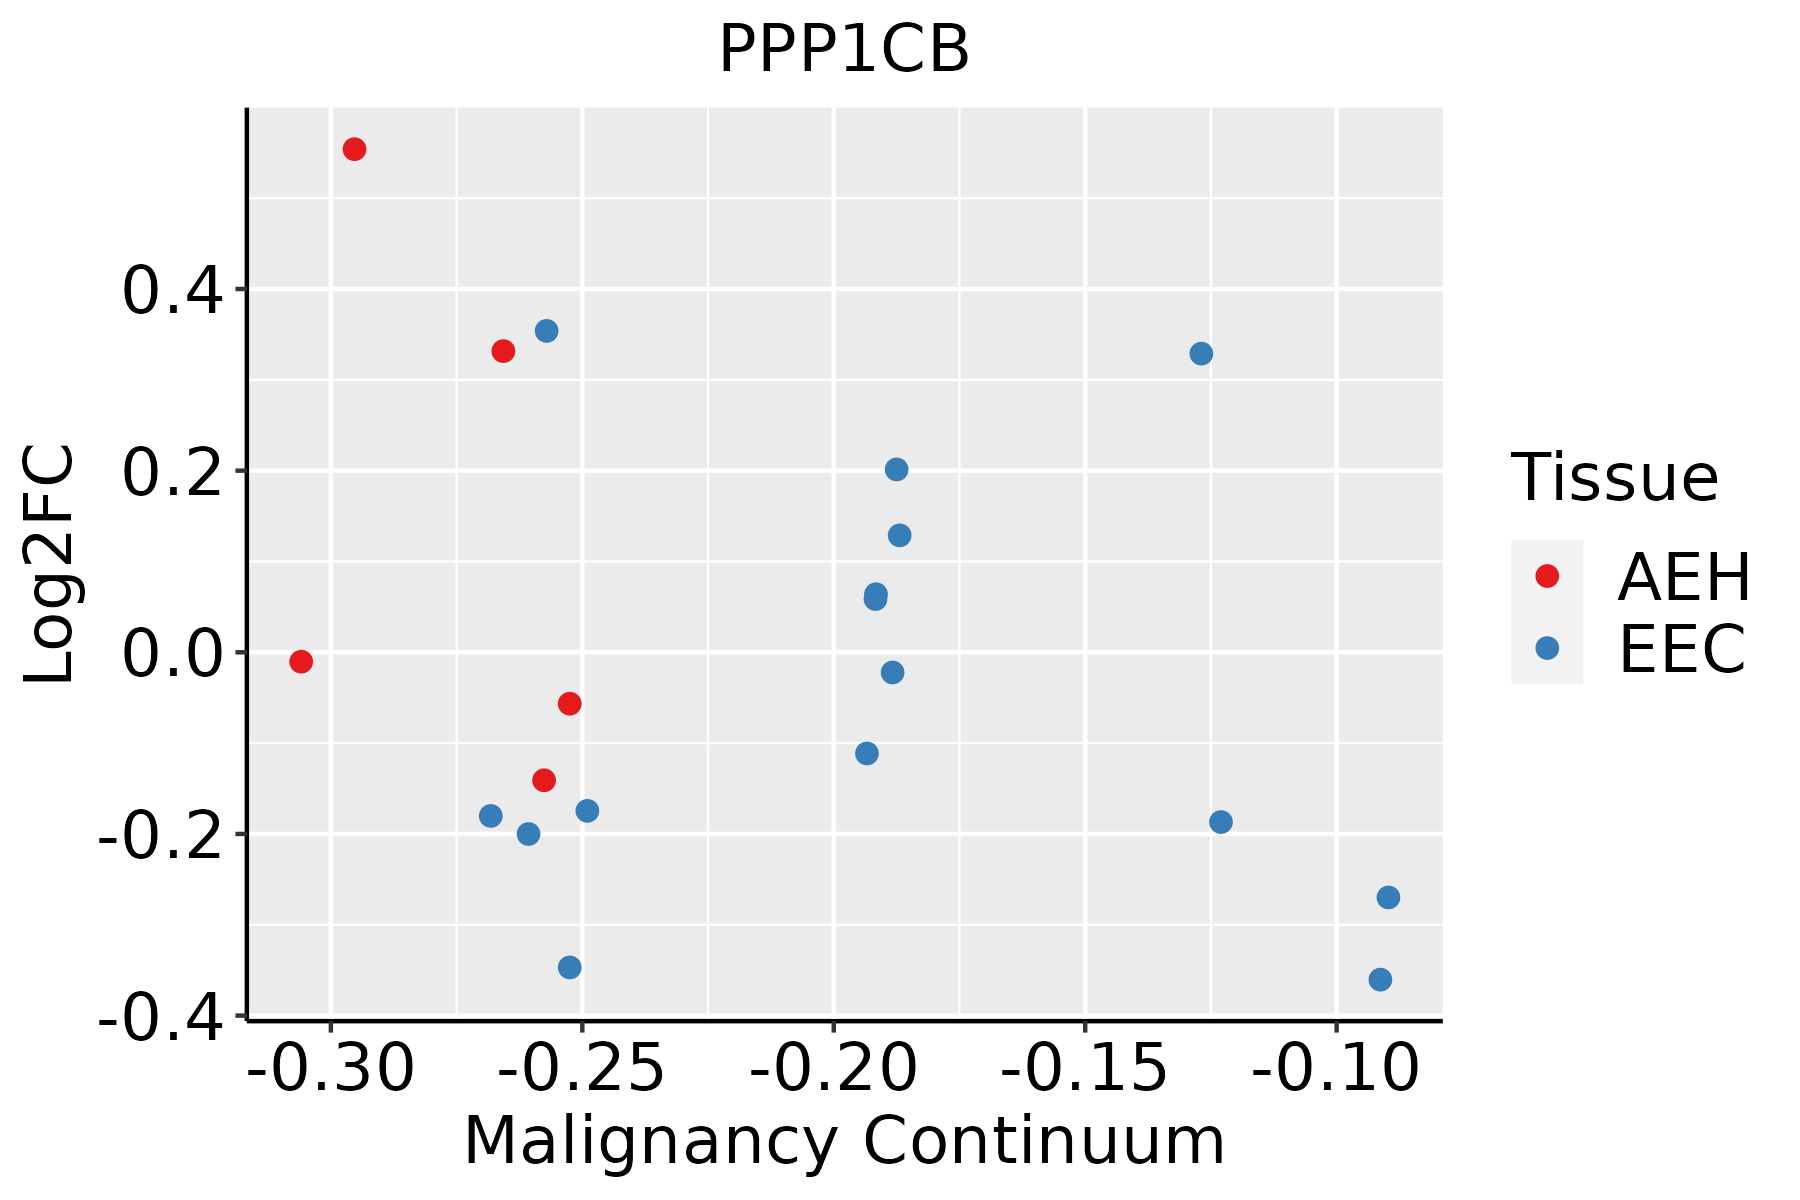 | AEH: Atypical endometrial hyperplasia |
| EEC: Endometrioid Cancer | ||
| Esophagus |  | ESCC: Esophageal squamous cell carcinoma |
| HGIN: High-grade intraepithelial neoplasias | ||
| LGIN: Low-grade intraepithelial neoplasias | ||
| GC |  | CAG: Chronic atrophic gastritis |
| CAG with IM: Chronic atrophic gastritis with intestinal metaplasia | ||
| CSG: Chronic superficial gastritis | ||
| GC: Gastric cancer | ||
| SIM: Severe intestinal metaplasia | ||
| WIM: Wild intestinal metaplasia | ||
| Liver |  | HCC: Hepatocellular carcinoma |
| NAFLD: Non-alcoholic fatty liver disease | ||
| Oral Cavity | 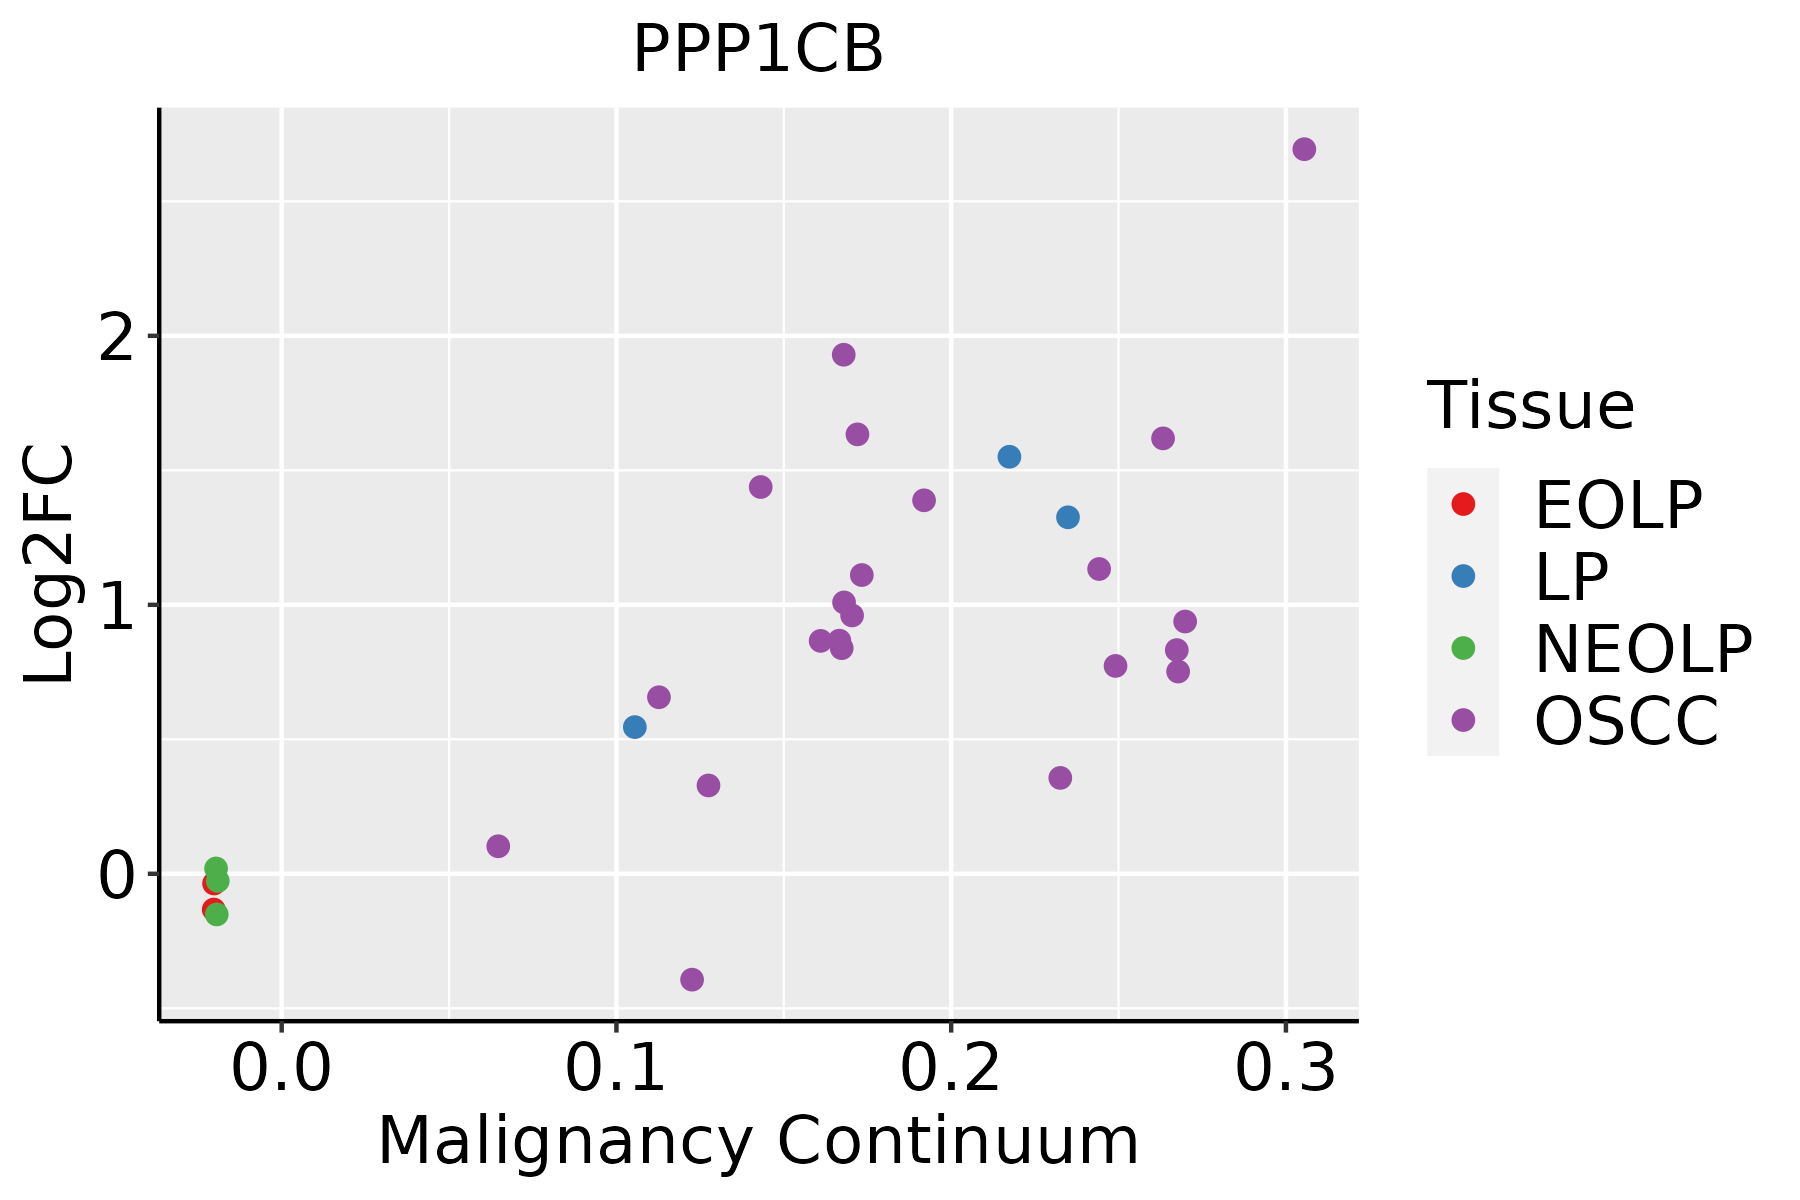 | EOLP: Erosive Oral lichen planus |
| LP: leukoplakia | ||
| NEOLP: Non-erosive oral lichen planus | ||
| OSCC: Oral squamous cell carcinoma | ||
| Prostate | 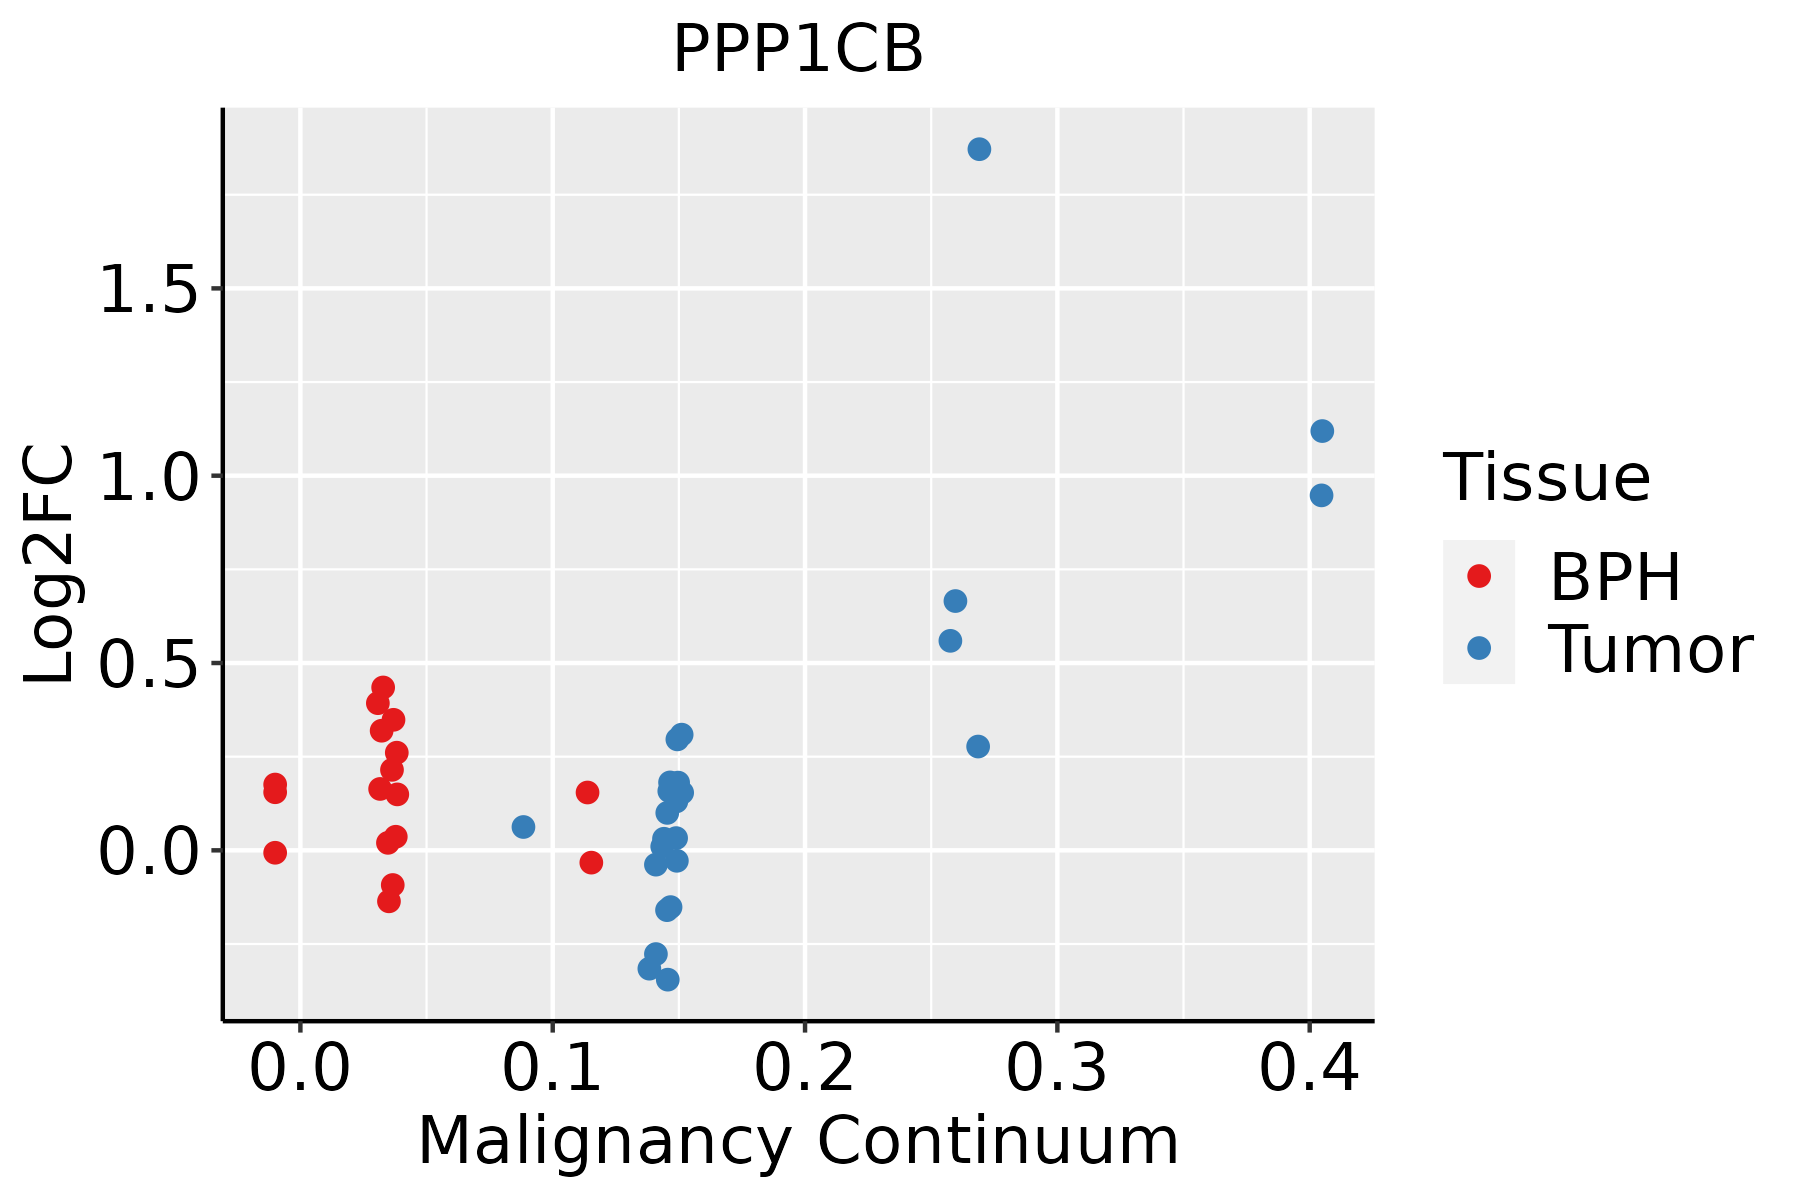 | BPH: Benign Prostatic Hyperplasia |
| Skin | 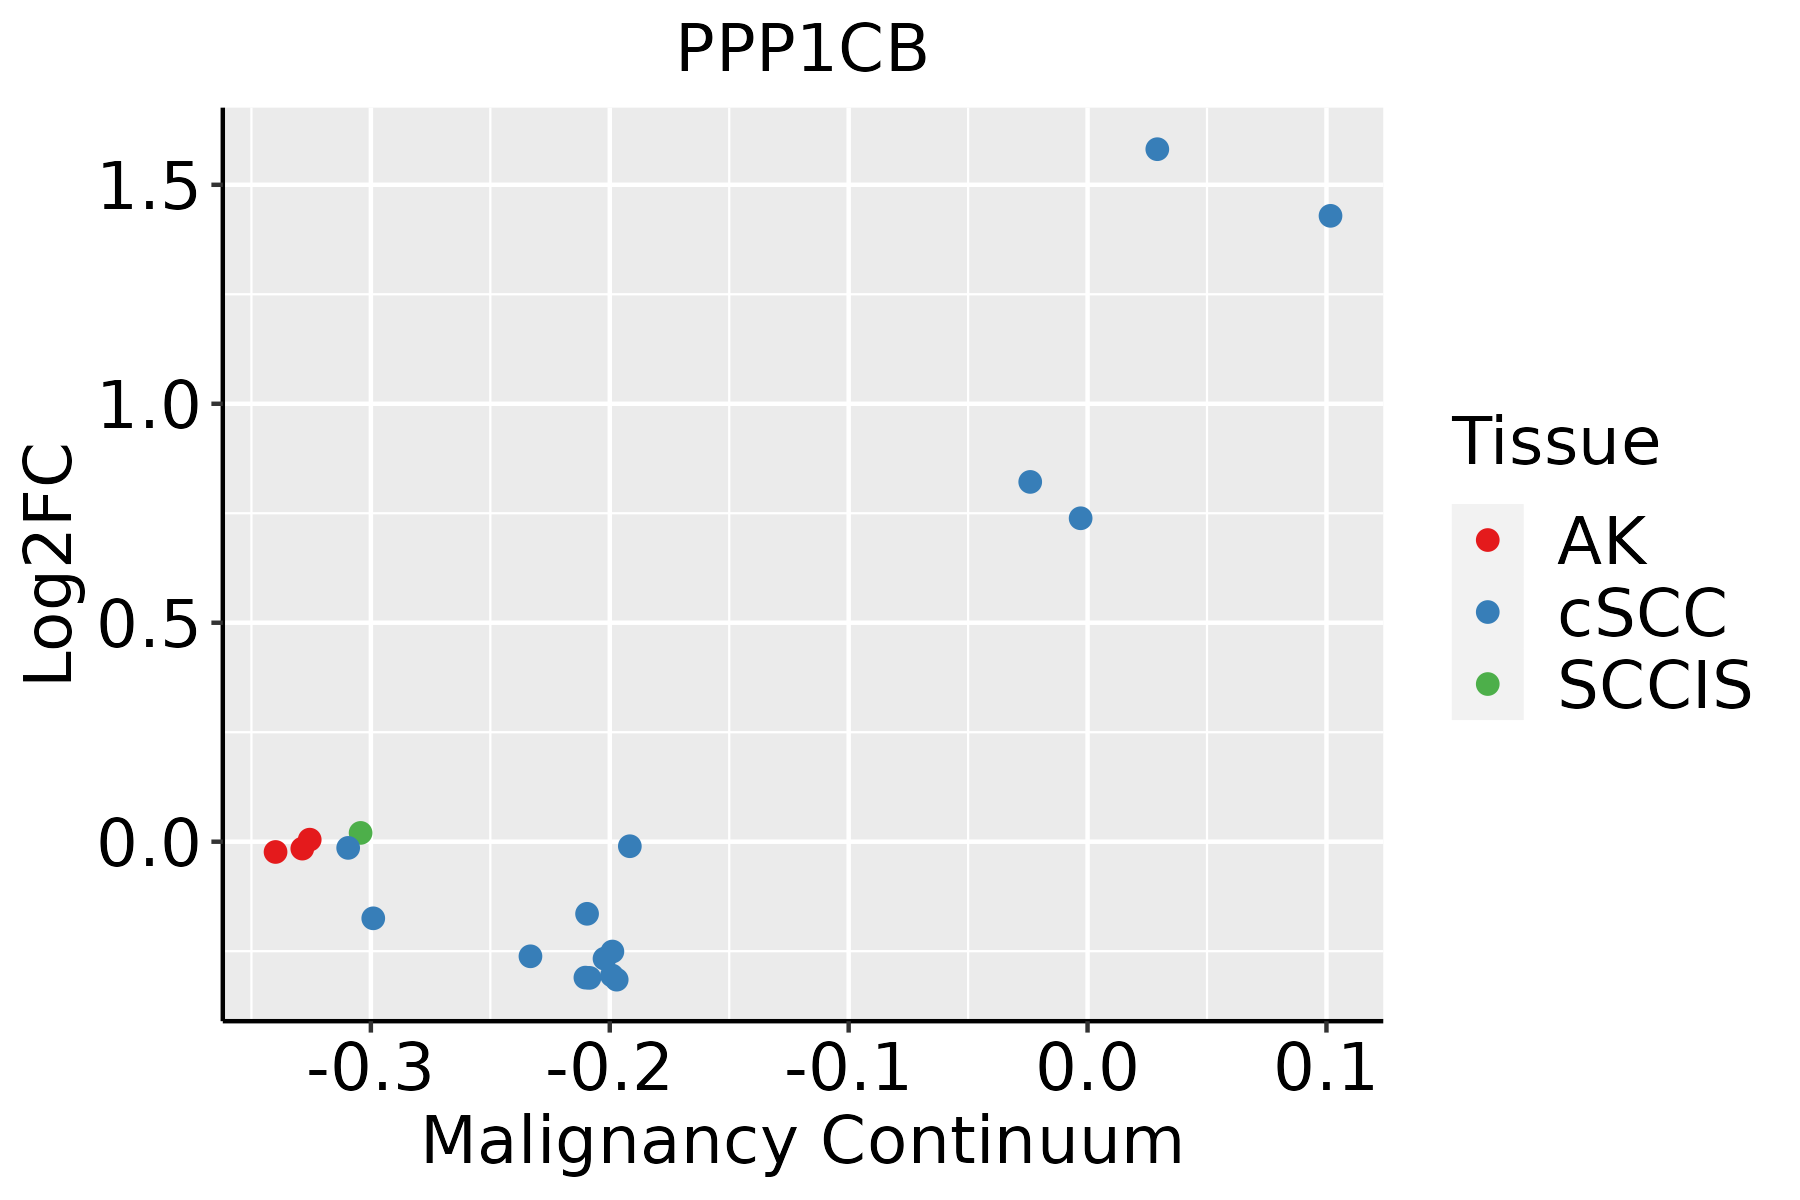 | AK: Actinic keratosis |
| cSCC: Cutaneous squamous cell carcinoma | ||
| SCCIS:squamous cell carcinoma in situ | ||
| Thyroid | 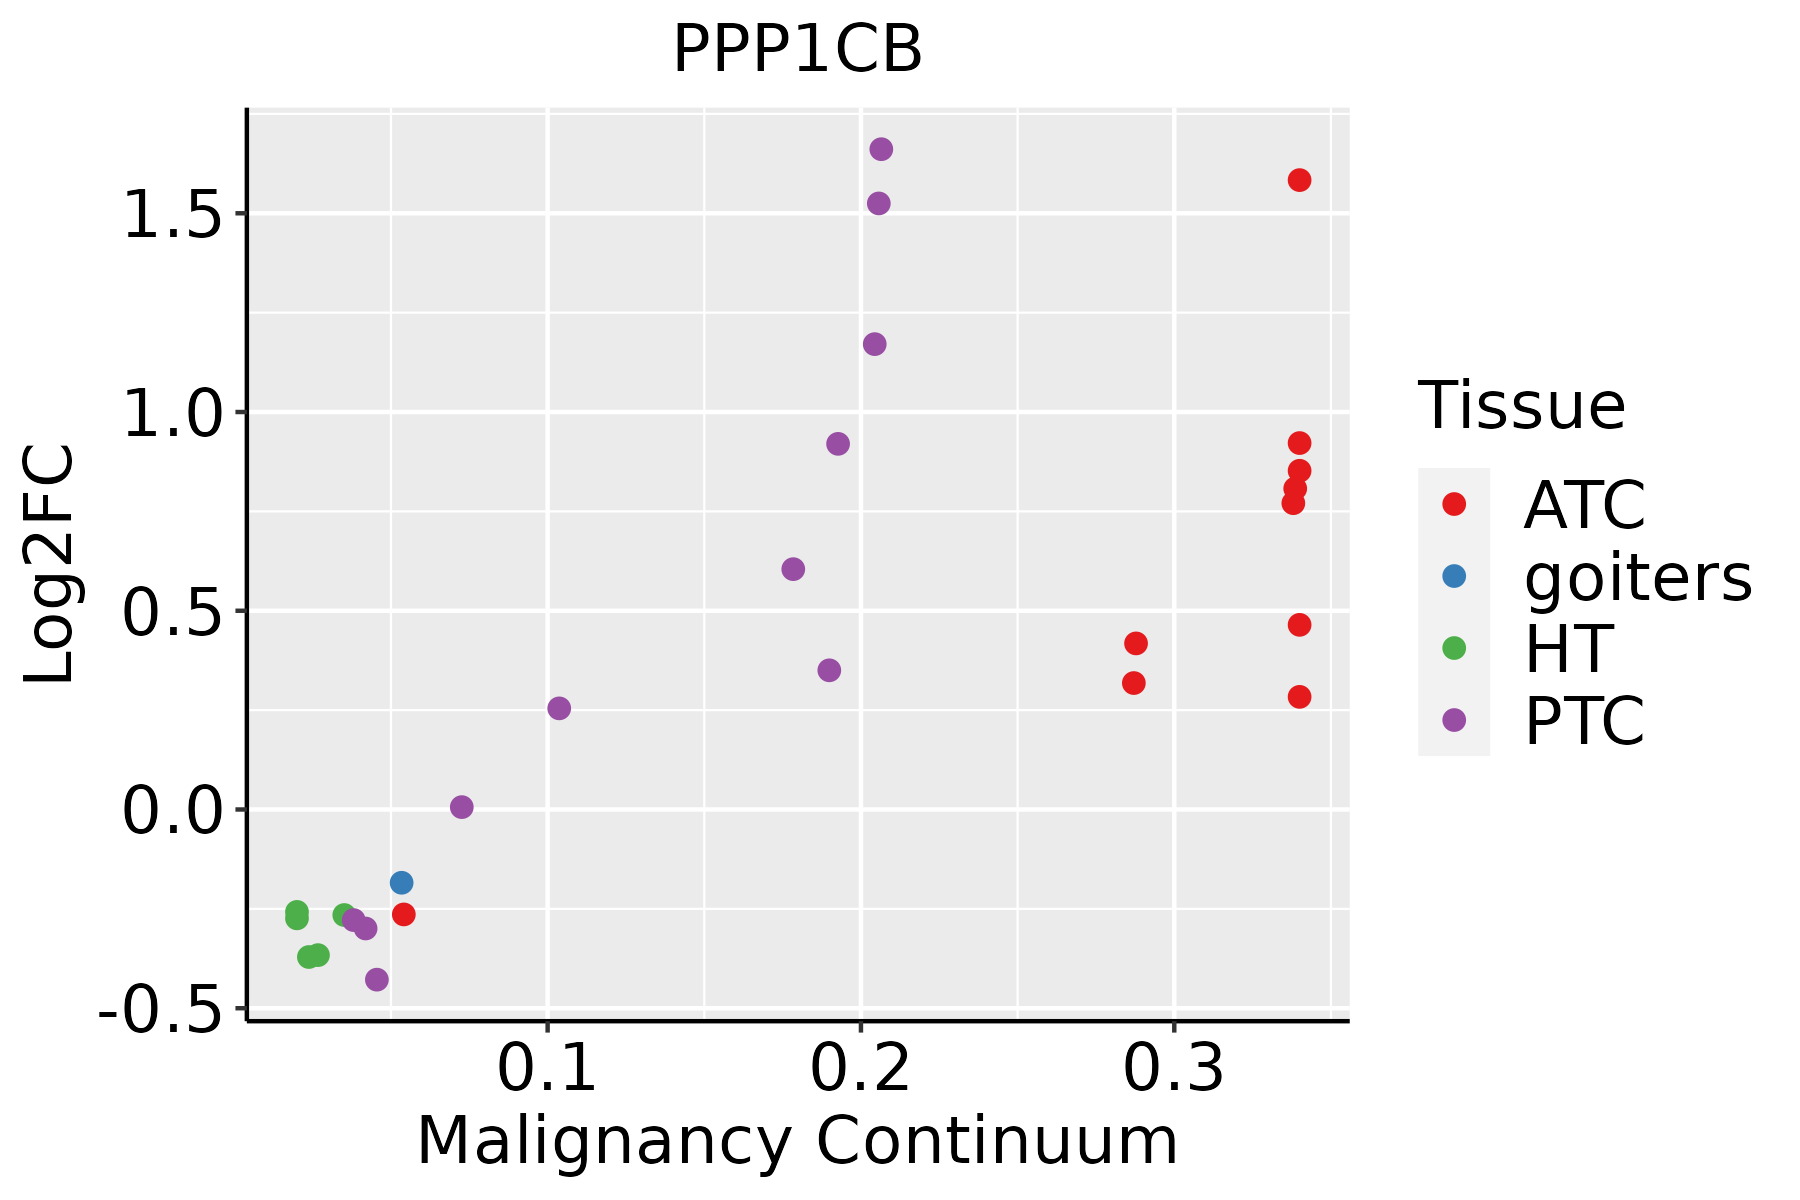 | ATC: Anaplastic thyroid cancer |
| HT: Hashimoto's thyroiditis | ||
| PTC: Papillary thyroid cancer |
| ∗log2FC in expression of this searched gene in stem-like cells from each diseased tissue sample relative to stem-like cells in normal samples in each tissue plotted against the malignancy continuum. Samples are colored based on if they are from different disease stage. |
Top |
Malignant transformation related pathway analysis |
| Find out the enriched GO biological processes and KEGG pathways involved in transition from healthy to precancer to cancer |
| Tissue | Disease Stage | Enriched GO biological Processes |
| Colorectum | AD |  |
| Colorectum | SER |  |
| Colorectum | MSS |  |
| Colorectum | MSI-H |  |
| Colorectum | FAP |  |
| ∗Top 15 enriched GO BP terms are showed in the bar plot of each disease state in each tissue. Each row represents a significant GO biological process which is colored according to the -log10(p.adjust). |
| Page: 1 2 3 4 5 6 7 8 9 |
| GO ID | Tissue | Disease Stage | Description | Gene Ratio | Bg Ratio | pvalue | p.adjust | Count |
| GO:00060918 | Breast | Precancer | generation of precursor metabolites and energy | 94/1080 | 490/18723 | 1.54e-25 | 1.64e-22 | 94 |
| GO:00159808 | Breast | Precancer | energy derivation by oxidation of organic compounds | 70/1080 | 318/18723 | 8.33e-23 | 6.37e-20 | 70 |
| GO:00434677 | Breast | Precancer | regulation of generation of precursor metabolites and energy | 22/1080 | 130/18723 | 4.95e-06 | 1.51e-04 | 22 |
| GO:00093148 | Breast | Precancer | response to radiation | 47/1080 | 456/18723 | 8.39e-05 | 1.62e-03 | 47 |
| GO:00160527 | Breast | Precancer | carbohydrate catabolic process | 21/1080 | 154/18723 | 2.10e-04 | 3.28e-03 | 21 |
| GO:00060066 | Breast | Precancer | glucose metabolic process | 23/1080 | 196/18723 | 9.54e-04 | 1.07e-02 | 23 |
| GO:00434705 | Breast | Precancer | regulation of carbohydrate catabolic process | 10/1080 | 56/18723 | 1.23e-03 | 1.32e-02 | 10 |
| GO:00059966 | Breast | Precancer | monosaccharide metabolic process | 27/1080 | 257/18723 | 1.94e-03 | 1.88e-02 | 27 |
| GO:00193186 | Breast | Precancer | hexose metabolic process | 25/1080 | 237/18723 | 2.64e-03 | 2.36e-02 | 25 |
| GO:00620126 | Breast | Precancer | regulation of small molecule metabolic process | 32/1080 | 334/18723 | 3.45e-03 | 2.87e-02 | 32 |
| GO:0043471 | Breast | Precancer | regulation of cellular carbohydrate catabolic process | 4/1080 | 12/18723 | 3.75e-03 | 3.04e-02 | 4 |
| GO:00329225 | Breast | Precancer | circadian regulation of gene expression | 10/1080 | 68/18723 | 5.39e-03 | 4.00e-02 | 10 |
| GO:000609113 | Breast | IDC | generation of precursor metabolites and energy | 103/1434 | 490/18723 | 1.53e-21 | 1.74e-18 | 103 |
| GO:001598013 | Breast | IDC | energy derivation by oxidation of organic compounds | 73/1434 | 318/18723 | 8.70e-18 | 3.80e-15 | 73 |
| GO:000931412 | Breast | IDC | response to radiation | 62/1434 | 456/18723 | 6.91e-06 | 2.10e-04 | 62 |
| GO:004346713 | Breast | IDC | regulation of generation of precursor metabolites and energy | 23/1434 | 130/18723 | 1.29e-04 | 2.34e-03 | 23 |
| GO:00485117 | Breast | IDC | rhythmic process | 38/1434 | 298/18723 | 1.34e-03 | 1.39e-02 | 38 |
| GO:001605213 | Breast | IDC | carbohydrate catabolic process | 21/1434 | 154/18723 | 7.00e-03 | 4.83e-02 | 21 |
| GO:000609123 | Breast | DCIS | generation of precursor metabolites and energy | 103/1390 | 490/18723 | 1.46e-22 | 1.65e-19 | 103 |
| GO:001598023 | Breast | DCIS | energy derivation by oxidation of organic compounds | 73/1390 | 318/18723 | 1.56e-18 | 8.01e-16 | 73 |
| Page: 1 2 3 4 5 6 7 8 9 10 11 12 13 14 15 16 17 |
| Pathway ID | Tissue | Disease Stage | Description | Gene Ratio | Bg Ratio | pvalue | p.adjust | qvalue | Count |
| hsa0541518 | Breast | Precancer | Diabetic cardiomyopathy | 63/684 | 203/8465 | 5.63e-22 | 1.48e-20 | 1.14e-20 | 63 |
| hsa042189 | Breast | Precancer | Cellular senescence | 29/684 | 156/8465 | 1.66e-05 | 1.69e-04 | 1.30e-04 | 29 |
| hsa0520514 | Breast | Precancer | Proteoglycans in cancer | 30/684 | 205/8465 | 1.00e-03 | 7.18e-03 | 5.50e-03 | 30 |
| hsa05031 | Breast | Precancer | Amphetamine addiction | 14/684 | 69/8465 | 1.05e-03 | 7.35e-03 | 5.63e-03 | 14 |
| hsa0541519 | Breast | Precancer | Diabetic cardiomyopathy | 63/684 | 203/8465 | 5.63e-22 | 1.48e-20 | 1.14e-20 | 63 |
| hsa0421814 | Breast | Precancer | Cellular senescence | 29/684 | 156/8465 | 1.66e-05 | 1.69e-04 | 1.30e-04 | 29 |
| hsa0520515 | Breast | Precancer | Proteoglycans in cancer | 30/684 | 205/8465 | 1.00e-03 | 7.18e-03 | 5.50e-03 | 30 |
| hsa050311 | Breast | Precancer | Amphetamine addiction | 14/684 | 69/8465 | 1.05e-03 | 7.35e-03 | 5.63e-03 | 14 |
| hsa0541523 | Breast | IDC | Diabetic cardiomyopathy | 67/867 | 203/8465 | 3.17e-19 | 8.59e-18 | 6.43e-18 | 67 |
| hsa0421824 | Breast | IDC | Cellular senescence | 35/867 | 156/8465 | 5.49e-06 | 7.43e-05 | 5.56e-05 | 35 |
| hsa0520523 | Breast | IDC | Proteoglycans in cancer | 42/867 | 205/8465 | 7.69e-06 | 9.99e-05 | 7.48e-05 | 42 |
| hsa050312 | Breast | IDC | Amphetamine addiction | 18/867 | 69/8465 | 1.42e-04 | 1.36e-03 | 1.01e-03 | 18 |
| hsa0481014 | Breast | IDC | Regulation of actin cytoskeleton | 36/867 | 229/8465 | 5.79e-03 | 3.13e-02 | 2.34e-02 | 36 |
| hsa045109 | Breast | IDC | Focal adhesion | 32/867 | 203/8465 | 8.60e-03 | 4.23e-02 | 3.17e-02 | 32 |
| hsa0541533 | Breast | IDC | Diabetic cardiomyopathy | 67/867 | 203/8465 | 3.17e-19 | 8.59e-18 | 6.43e-18 | 67 |
| hsa0421834 | Breast | IDC | Cellular senescence | 35/867 | 156/8465 | 5.49e-06 | 7.43e-05 | 5.56e-05 | 35 |
| hsa0520533 | Breast | IDC | Proteoglycans in cancer | 42/867 | 205/8465 | 7.69e-06 | 9.99e-05 | 7.48e-05 | 42 |
| hsa050313 | Breast | IDC | Amphetamine addiction | 18/867 | 69/8465 | 1.42e-04 | 1.36e-03 | 1.01e-03 | 18 |
| hsa0481015 | Breast | IDC | Regulation of actin cytoskeleton | 36/867 | 229/8465 | 5.79e-03 | 3.13e-02 | 2.34e-02 | 36 |
| hsa0451013 | Breast | IDC | Focal adhesion | 32/867 | 203/8465 | 8.60e-03 | 4.23e-02 | 3.17e-02 | 32 |
| Page: 1 2 3 4 5 6 7 8 9 10 11 12 13 |
Top |
Cell-cell communication analysis |
| Identification of potential cell-cell interactions between two cell types and their ligand-receptor pairs for different disease states |
| Ligand | Receptor | LRpair | Pathway | Tissue | Disease Stage |
| Page: 1 |
Top |
Single-cell gene regulatory network inference analysis |
| Find out the significant the regulons (TFs) and the target genes of each regulon across cell types for different disease states |
| TF | Cell Type | Tissue | Disease Stage | Target Gene | RSS | Regulon Activity |
| ∗The dot plots of a searched regulon are shown for all cell subpopulations in each disease state of each tissue based on the regulon specific score inferred using pySCENIC and by calculating the average expression. |
| Page: 1 |
Top |
Somatic mutation of malignant transformation related genes |
| Annotation of somatic variants for genes involved in malignant transformation |
| Hugo Symbol | Variant Class | Variant Classification | dbSNP RS | HGVSc | HGVSp | HGVSp Short | SWISSPROT | BIOTYPE | SIFT | PolyPhen | Tumor Sample Barcode | Tissue | Histology | Sex | Age | Stage | Therapy Types | Drugs | Outcome |
| PPP1CB | SNV | Missense_Mutation | c.742N>G | p.Gln248Glu | p.Q248E | P62140 | protein_coding | deleterious_low_confidence(0.04) | benign(0.124) | TCGA-AC-A3BB-01 | Breast | breast invasive carcinoma | Female | <65 | III/IV | Chemotherapy | cytoxan | CR | |
| PPP1CB | SNV | Missense_Mutation | novel | c.506N>G | p.Phe169Cys | p.F169C | P62140 | protein_coding | deleterious_low_confidence(0.03) | probably_damaging(0.995) | TCGA-OL-A5D7-01 | Breast | breast invasive carcinoma | Female | >=65 | I/II | Chemotherapy | cytoxan | CR |
| PPP1CB | SNV | Missense_Mutation | c.742N>G | p.Gln248Glu | p.Q248E | P62140 | protein_coding | deleterious_low_confidence(0.04) | benign(0.124) | TCGA-DR-A0ZM-01 | Cervix | cervical & endocervical cancer | Female | <65 | III/IV | Unspecific | Cisplatin | SD | |
| PPP1CB | SNV | Missense_Mutation | c.259N>G | p.Leu87Val | p.L87V | P62140 | protein_coding | tolerated_low_confidence(0.06) | benign(0.185) | TCGA-LP-A4AV-01 | Cervix | cervical & endocervical cancer | Female | <65 | I/II | Unknown | Unknown | SD | |
| PPP1CB | SNV | Missense_Mutation | c.160N>G | p.Leu54Val | p.L54V | P62140 | protein_coding | deleterious_low_confidence(0.03) | benign(0.045) | TCGA-AA-3695-01 | Colorectum | colon adenocarcinoma | Female | <65 | III/IV | Unknown | Unknown | SD | |
| PPP1CB | SNV | Missense_Mutation | novel | c.71N>A | p.Gly24Glu | p.G24E | P62140 | protein_coding | deleterious_low_confidence(0) | possibly_damaging(0.596) | TCGA-CA-6717-01 | Colorectum | colon adenocarcinoma | Male | <65 | I/II | Chemotherapy | oxaliplatin | CR |
| PPP1CB | SNV | Missense_Mutation | rs760562458 | c.94N>A | p.Ala32Thr | p.A32T | P62140 | protein_coding | tolerated_low_confidence(0.47) | benign(0) | TCGA-D5-6928-01 | Colorectum | colon adenocarcinoma | Male | >=65 | I/II | Unknown | Unknown | SD |
| PPP1CB | SNV | Missense_Mutation | c.157N>A | p.Glu53Lys | p.E53K | P62140 | protein_coding | deleterious_low_confidence(0.02) | benign(0.031) | TCGA-AG-3890-01 | Colorectum | rectum adenocarcinoma | Male | <65 | I/II | Unknown | Unknown | SD | |
| PPP1CB | insertion | Frame_Shift_Ins | novel | c.643_644insG | p.Glu217ArgfsTer3 | p.E217Rfs*3 | P62140 | protein_coding | TCGA-A6-5661-01 | Colorectum | colon adenocarcinoma | Female | >=65 | I/II | Unknown | Unknown | SD | ||
| PPP1CB | SNV | Missense_Mutation | novel | c.370N>T | p.His124Tyr | p.H124Y | P62140 | protein_coding | deleterious_low_confidence(0) | probably_damaging(0.999) | TCGA-A5-A0G2-01 | Endometrium | uterine corpus endometrioid carcinoma | Female | <65 | III/IV | Unknown | Unknown | SD |
| Page: 1 2 3 4 |
Top |
Related drugs of malignant transformation related genes |
| Identification of chemicals and drugs interact with genes involved in malignant transfromation |
| (DGIdb 4.0) |
| Entrez ID | Symbol | Category | Interaction Types | Drug Claim Name | Drug Name | PMIDs |
| Page: 1 |

Copyright 2023-Present -The University of Texas Health Science Center at Houston |