
|
|||||
|
 | |
| |
| |
| |
| |
| |
|
Gene: PPME1 |
Gene summary for PPME1 |
| Gene information | Species | Human | Gene symbol | PPME1 | Gene ID | 51400 |
| Gene name | protein phosphatase methylesterase 1 | |
| Gene Alias | ABDH19 | |
| Cytomap | 11q13.4 | |
| Gene Type | protein-coding | GO ID | GO:0000086 | UniProtAcc | Q9Y570 |
Top |
Malignant transformation analysis |
| Identification of the aberrant gene expression in precancerous and cancerous lesions by comparing the gene expression of stem-like cells in diseased tissues with normal stem cells |
| Entrez ID | Symbol | Replicates | Species | Organ | Tissue | Adj P-value | Log2FC | Malignancy |
| 51400 | PPME1 | LZE2T | Human | Esophagus | ESCC | 4.11e-03 | 6.17e-01 | 0.082 |
| 51400 | PPME1 | LZE4T | Human | Esophagus | ESCC | 5.63e-14 | 5.15e-01 | 0.0811 |
| 51400 | PPME1 | LZE7T | Human | Esophagus | ESCC | 1.10e-03 | 1.17e-01 | 0.0667 |
| 51400 | PPME1 | LZE8T | Human | Esophagus | ESCC | 8.38e-12 | 4.29e-01 | 0.067 |
| 51400 | PPME1 | LZE20T | Human | Esophagus | ESCC | 3.98e-06 | 3.03e-01 | 0.0662 |
| 51400 | PPME1 | LZE21D1 | Human | Esophagus | HGIN | 8.82e-03 | 1.85e-01 | 0.0632 |
| 51400 | PPME1 | LZE22T | Human | Esophagus | ESCC | 1.15e-19 | 1.36e+00 | 0.068 |
| 51400 | PPME1 | LZE24T | Human | Esophagus | ESCC | 3.52e-21 | 5.91e-01 | 0.0596 |
| 51400 | PPME1 | LZE22D3 | Human | Esophagus | HGIN | 2.07e-05 | 5.07e-01 | 0.0653 |
| 51400 | PPME1 | LZE21T | Human | Esophagus | ESCC | 4.41e-02 | 3.51e-01 | 0.0655 |
| 51400 | PPME1 | P1T-E | Human | Esophagus | ESCC | 1.16e-06 | 4.01e-01 | 0.0875 |
| 51400 | PPME1 | P2T-E | Human | Esophagus | ESCC | 5.04e-68 | 1.15e+00 | 0.1177 |
| 51400 | PPME1 | P4T-E | Human | Esophagus | ESCC | 2.66e-45 | 9.92e-01 | 0.1323 |
| 51400 | PPME1 | P5T-E | Human | Esophagus | ESCC | 1.24e-42 | 8.62e-01 | 0.1327 |
| 51400 | PPME1 | P8T-E | Human | Esophagus | ESCC | 8.51e-19 | 3.14e-01 | 0.0889 |
| 51400 | PPME1 | P9T-E | Human | Esophagus | ESCC | 1.43e-07 | 2.66e-01 | 0.1131 |
| 51400 | PPME1 | P10T-E | Human | Esophagus | ESCC | 7.70e-35 | 3.85e-01 | 0.116 |
| 51400 | PPME1 | P11T-E | Human | Esophagus | ESCC | 9.30e-12 | 4.49e-01 | 0.1426 |
| 51400 | PPME1 | P12T-E | Human | Esophagus | ESCC | 4.21e-32 | 9.63e-01 | 0.1122 |
| 51400 | PPME1 | P15T-E | Human | Esophagus | ESCC | 2.18e-21 | 5.30e-01 | 0.1149 |
| Page: 1 2 3 4 5 6 |
| Tissue | Expression Dynamics | Abbreviation |
| Esophagus | 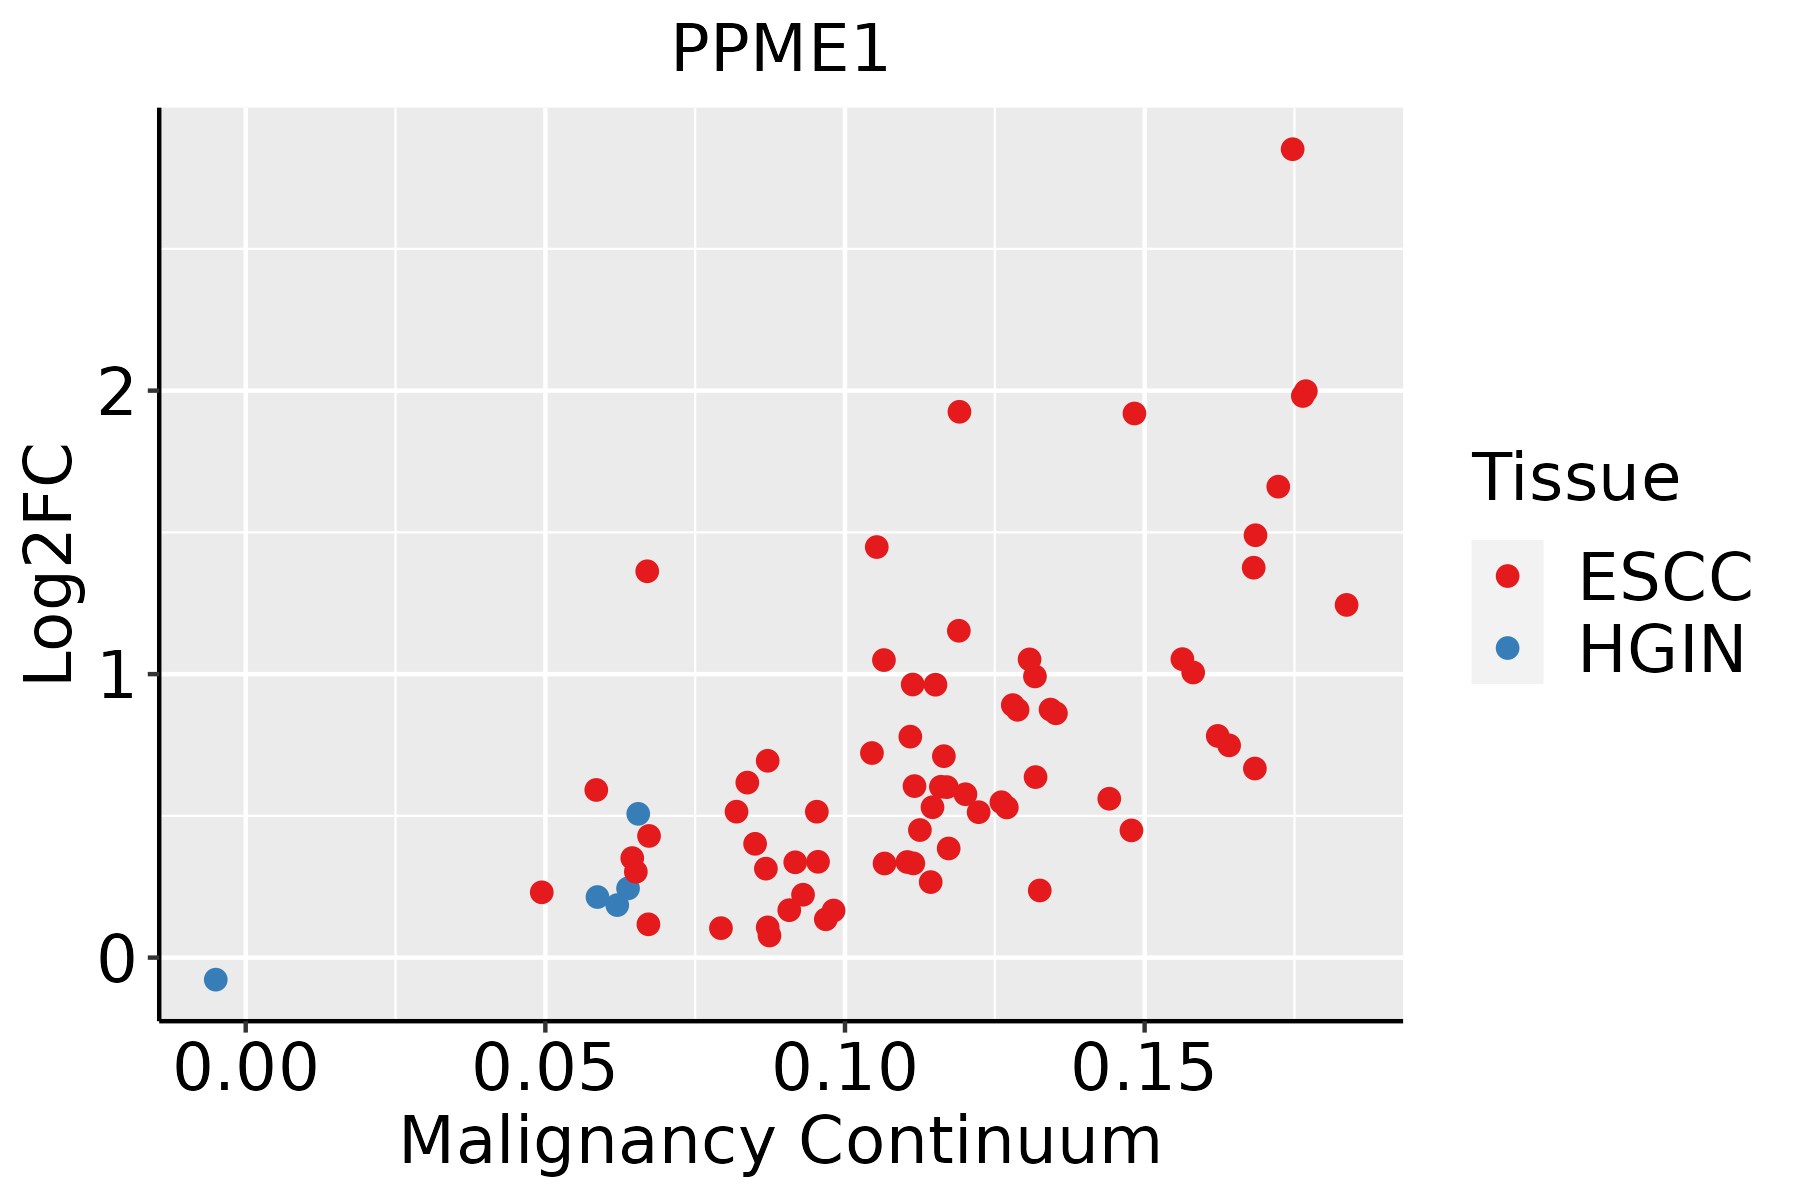 | ESCC: Esophageal squamous cell carcinoma |
| HGIN: High-grade intraepithelial neoplasias | ||
| LGIN: Low-grade intraepithelial neoplasias | ||
| Liver |  | HCC: Hepatocellular carcinoma |
| NAFLD: Non-alcoholic fatty liver disease | ||
| Oral Cavity | 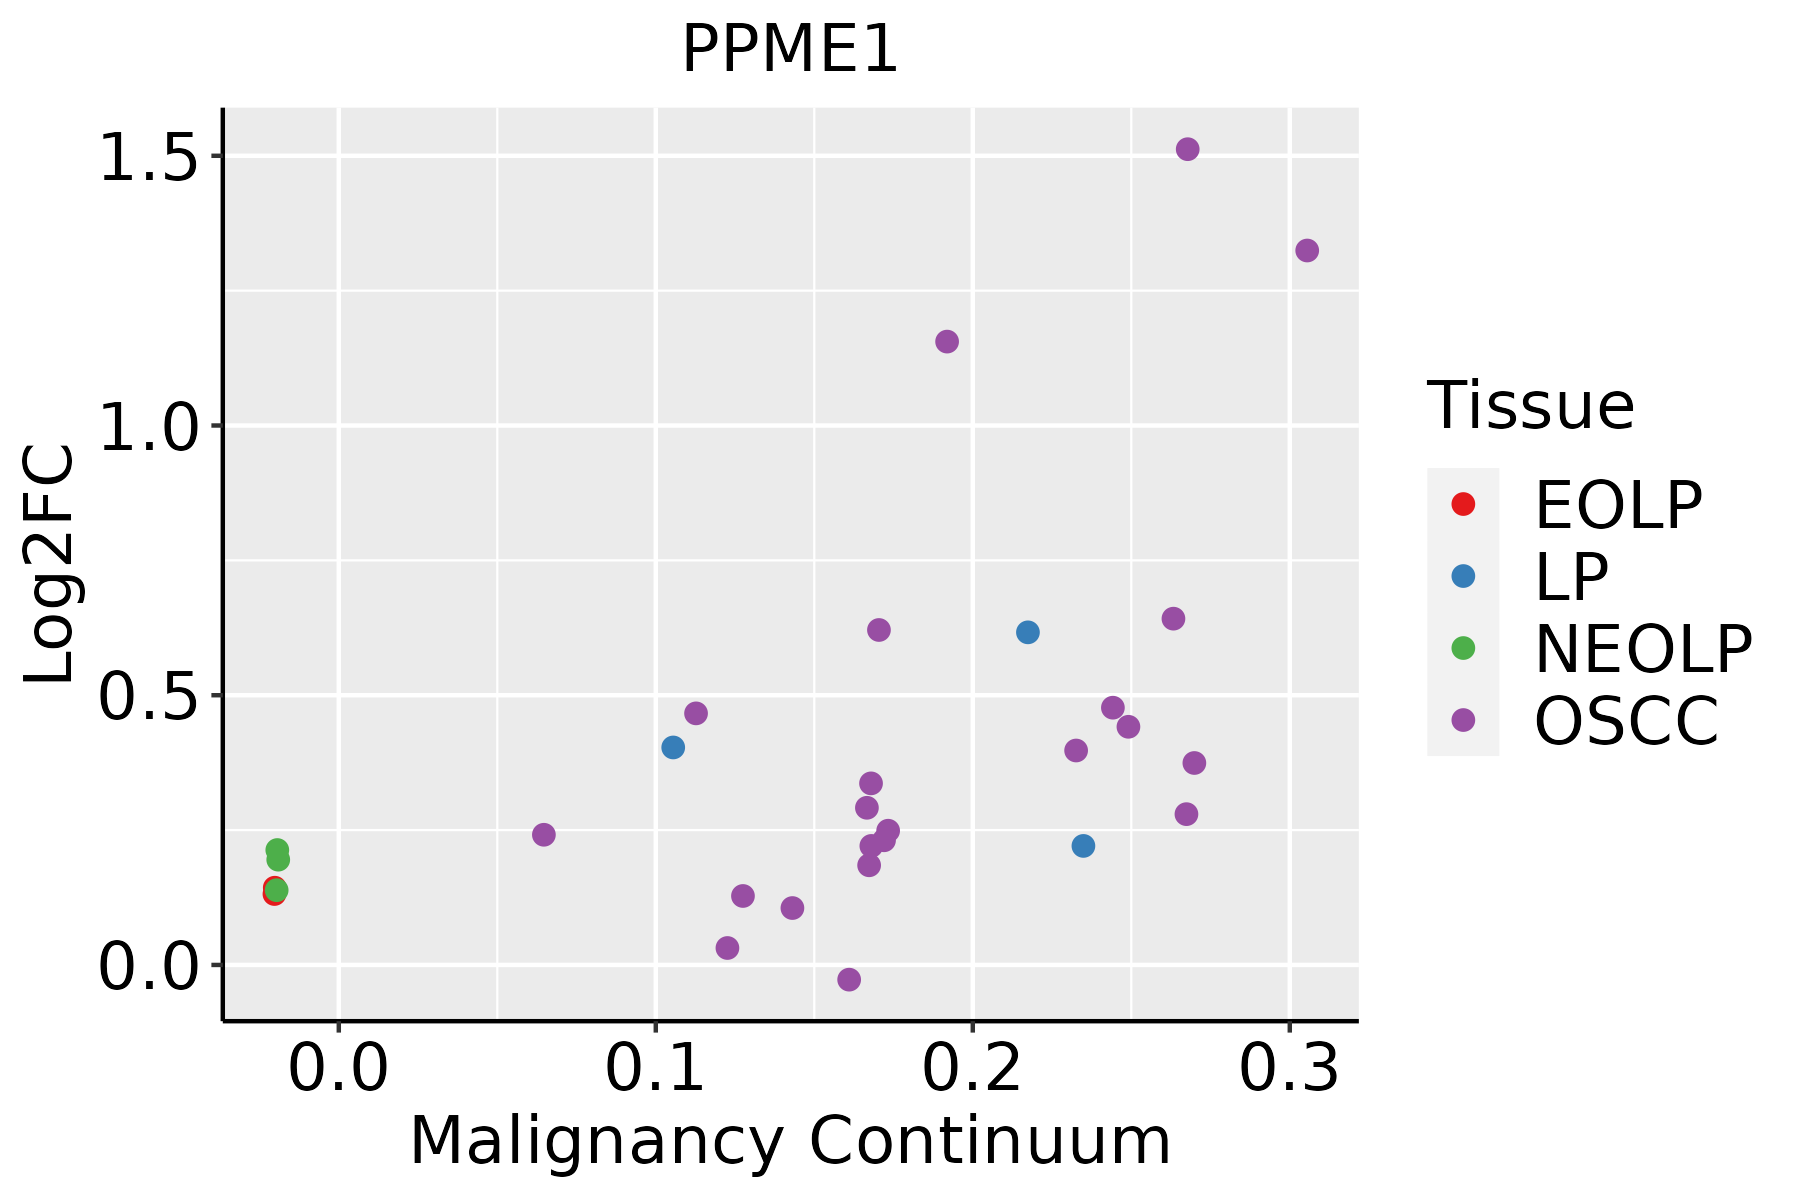 | EOLP: Erosive Oral lichen planus |
| LP: leukoplakia | ||
| NEOLP: Non-erosive oral lichen planus | ||
| OSCC: Oral squamous cell carcinoma | ||
| Skin | 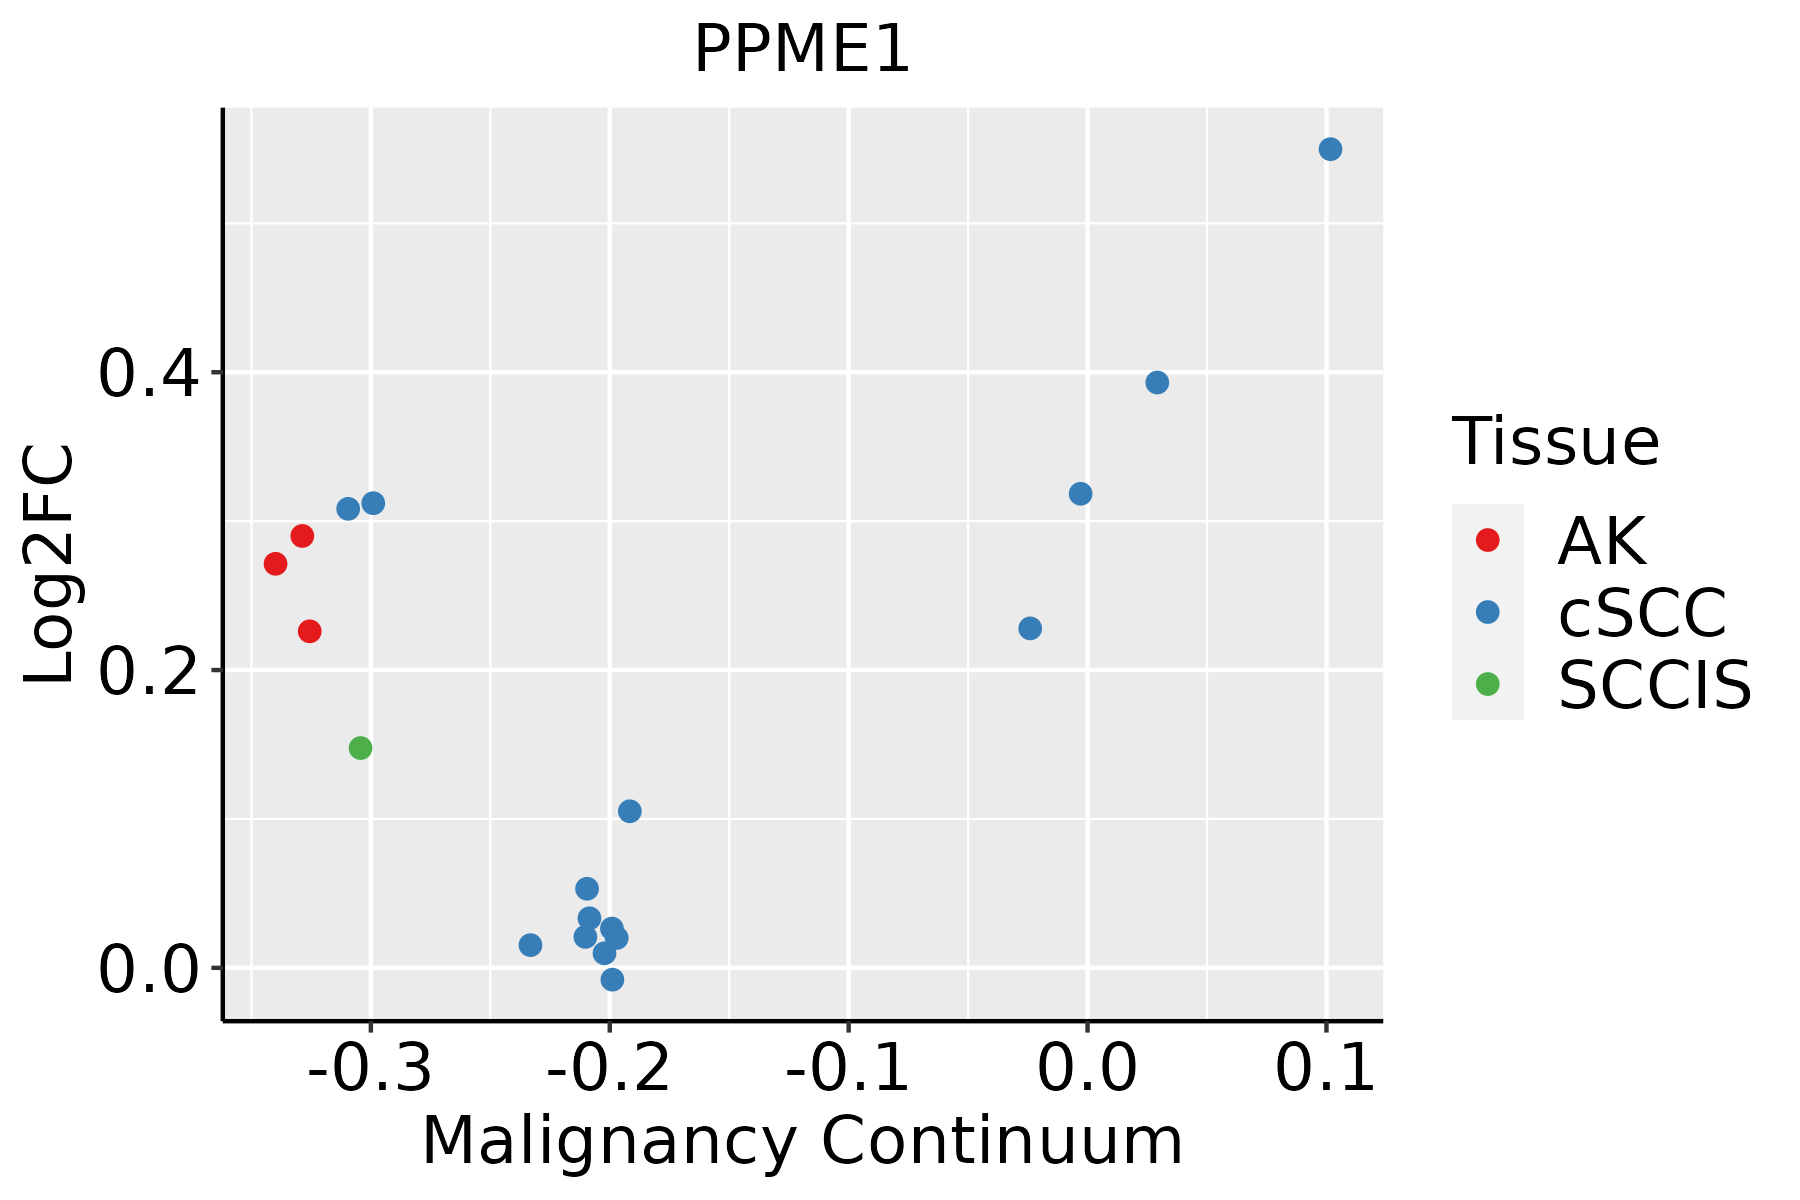 | AK: Actinic keratosis |
| cSCC: Cutaneous squamous cell carcinoma | ||
| SCCIS:squamous cell carcinoma in situ | ||
| Thyroid |  | ATC: Anaplastic thyroid cancer |
| HT: Hashimoto's thyroiditis | ||
| PTC: Papillary thyroid cancer |
| ∗log2FC in expression of this searched gene in stem-like cells from each diseased tissue sample relative to stem-like cells in normal samples in each tissue plotted against the malignancy continuum. Samples are colored based on if they are from different disease stage. |
Top |
Malignant transformation related pathway analysis |
| Find out the enriched GO biological processes and KEGG pathways involved in transition from healthy to precancer to cancer |
| Tissue | Disease Stage | Enriched GO biological Processes |
| Colorectum | AD |  |
| Colorectum | SER |  |
| Colorectum | MSS |  |
| Colorectum | MSI-H |  |
| Colorectum | FAP |  |
| ∗Top 15 enriched GO BP terms are showed in the bar plot of each disease state in each tissue. Each row represents a significant GO biological process which is colored according to the -log10(p.adjust). |
| Page: 1 2 3 4 5 6 7 8 9 |
| GO ID | Tissue | Disease Stage | Description | Gene Ratio | Bg Ratio | pvalue | p.adjust | Count |
| GO:00447729 | Esophagus | HGIN | mitotic cell cycle phase transition | 89/2587 | 424/18723 | 2.80e-05 | 7.21e-04 | 89 |
| GO:004477216 | Esophagus | ESCC | mitotic cell cycle phase transition | 281/8552 | 424/18723 | 4.63e-18 | 4.45e-16 | 281 |
| GO:00448394 | Esophagus | ESCC | cell cycle G2/M phase transition | 103/8552 | 148/18723 | 3.09e-09 | 6.67e-08 | 103 |
| GO:00000864 | Esophagus | ESCC | G2/M transition of mitotic cell cycle | 96/8552 | 137/18723 | 6.00e-09 | 1.23e-07 | 96 |
| GO:00064824 | Esophagus | ESCC | protein demethylation | 24/8552 | 33/18723 | 1.50e-03 | 7.06e-03 | 24 |
| GO:00082144 | Esophagus | ESCC | protein dealkylation | 24/8552 | 33/18723 | 1.50e-03 | 7.06e-03 | 24 |
| GO:00447722 | Liver | HCC | mitotic cell cycle phase transition | 240/7958 | 424/18723 | 2.47e-09 | 6.84e-08 | 240 |
| GO:0000086 | Liver | HCC | G2/M transition of mitotic cell cycle | 75/7958 | 137/18723 | 2.52e-03 | 1.22e-02 | 75 |
| GO:0044839 | Liver | HCC | cell cycle G2/M phase transition | 79/7958 | 148/18723 | 4.82e-03 | 2.03e-02 | 79 |
| GO:00447728 | Oral cavity | OSCC | mitotic cell cycle phase transition | 255/7305 | 424/18723 | 5.29e-19 | 6.98e-17 | 255 |
| GO:00000863 | Oral cavity | OSCC | G2/M transition of mitotic cell cycle | 84/7305 | 137/18723 | 9.99e-08 | 1.70e-06 | 84 |
| GO:00448393 | Oral cavity | OSCC | cell cycle G2/M phase transition | 89/7305 | 148/18723 | 1.51e-07 | 2.51e-06 | 89 |
| GO:004477222 | Oral cavity | EOLP | mitotic cell cycle phase transition | 81/2218 | 424/18723 | 8.32e-06 | 1.59e-04 | 81 |
| GO:004477231 | Oral cavity | NEOLP | mitotic cell cycle phase transition | 67/2005 | 424/18723 | 7.30e-04 | 5.98e-03 | 67 |
| GO:00064823 | Oral cavity | NEOLP | protein demethylation | 9/2005 | 33/18723 | 6.45e-03 | 3.32e-02 | 9 |
| GO:00082143 | Oral cavity | NEOLP | protein dealkylation | 9/2005 | 33/18723 | 6.45e-03 | 3.32e-02 | 9 |
| GO:004477210 | Skin | AK | mitotic cell cycle phase transition | 83/1910 | 424/18723 | 3.81e-09 | 3.05e-07 | 83 |
| GO:00064825 | Skin | AK | protein demethylation | 10/1910 | 33/18723 | 1.22e-03 | 9.31e-03 | 10 |
| GO:00082145 | Skin | AK | protein dealkylation | 10/1910 | 33/18723 | 1.22e-03 | 9.31e-03 | 10 |
| GO:00000865 | Skin | AK | G2/M transition of mitotic cell cycle | 26/1910 | 137/18723 | 1.35e-03 | 1.00e-02 | 26 |
| Page: 1 2 |
| Pathway ID | Tissue | Disease Stage | Description | Gene Ratio | Bg Ratio | pvalue | p.adjust | qvalue | Count |
| Page: 1 |
Top |
Cell-cell communication analysis |
| Identification of potential cell-cell interactions between two cell types and their ligand-receptor pairs for different disease states |
| Ligand | Receptor | LRpair | Pathway | Tissue | Disease Stage |
| Page: 1 |
Top |
Single-cell gene regulatory network inference analysis |
| Find out the significant the regulons (TFs) and the target genes of each regulon across cell types for different disease states |
| TF | Cell Type | Tissue | Disease Stage | Target Gene | RSS | Regulon Activity |
| ∗The dot plots of a searched regulon are shown for all cell subpopulations in each disease state of each tissue based on the regulon specific score inferred using pySCENIC and by calculating the average expression. |
| Page: 1 |
Top |
Somatic mutation of malignant transformation related genes |
| Annotation of somatic variants for genes involved in malignant transformation |
| Hugo Symbol | Variant Class | Variant Classification | dbSNP RS | HGVSc | HGVSp | HGVSp Short | SWISSPROT | BIOTYPE | SIFT | PolyPhen | Tumor Sample Barcode | Tissue | Histology | Sex | Age | Stage | Therapy Types | Drugs | Outcome |
| PPME1 | SNV | Missense_Mutation | c.143N>G | p.Gln48Arg | p.Q48R | Q9Y570 | protein_coding | tolerated(0.16) | benign(0.009) | TCGA-AO-A128-01 | Breast | breast invasive carcinoma | Female | <65 | I/II | Chemotherapy | doxorubicin | SD | |
| PPME1 | SNV | Missense_Mutation | rs780960664 | c.341N>A | p.Ser114Asn | p.S114N | Q9Y570 | protein_coding | deleterious(0) | benign(0.003) | TCGA-B6-A0RE-01 | Breast | breast invasive carcinoma | Female | <65 | I/II | Unknown | Unknown | SD |
| PPME1 | SNV | Missense_Mutation | c.95N>C | p.Arg32Pro | p.R32P | Q9Y570 | protein_coding | deleterious(0.04) | possibly_damaging(0.67) | TCGA-BH-A1F8-01 | Breast | breast invasive carcinoma | Female | >=65 | III/IV | Unknown | Unknown | PD | |
| PPME1 | SNV | Missense_Mutation | novel | c.338N>A | p.Arg113Gln | p.R113Q | Q9Y570 | protein_coding | deleterious(0) | probably_damaging(0.998) | TCGA-VS-A958-01 | Cervix | cervical & endocervical cancer | Female | <65 | I/II | Chemotherapy | cisplatin | CR |
| PPME1 | SNV | Missense_Mutation | rs79972734 | c.287N>T | p.Thr96Met | p.T96M | Q9Y570 | protein_coding | deleterious(0) | possibly_damaging(0.828) | TCGA-AA-A01R-01 | Colorectum | colon adenocarcinoma | Male | <65 | III/IV | Chemotherapy | 5-fluorouracil | PD |
| PPME1 | SNV | Missense_Mutation | c.1002N>T | p.Leu334Phe | p.L334F | Q9Y570 | protein_coding | deleterious(0) | probably_damaging(1) | TCGA-EI-6882-01 | Colorectum | rectum adenocarcinoma | Male | <65 | I/II | Unknown | Unknown | SD | |
| PPME1 | SNV | Missense_Mutation | novel | c.338G>A | p.Arg113Gln | p.R113Q | Q9Y570 | protein_coding | deleterious(0) | probably_damaging(0.998) | TCGA-EI-6917-01 | Colorectum | rectum adenocarcinoma | Male | <65 | III/IV | Chemotherapy | 5fluorouracil+oxaciplatina+l-folinian | SD |
| PPME1 | SNV | Missense_Mutation | rs199766005 | c.115C>T | p.Arg39Trp | p.R39W | Q9Y570 | protein_coding | deleterious(0) | benign(0.1) | TCGA-F5-6814-01 | Colorectum | rectum adenocarcinoma | Male | <65 | I/II | Unknown | Unknown | SD |
| PPME1 | SNV | Missense_Mutation | c.977N>A | p.Cys326Tyr | p.C326Y | Q9Y570 | protein_coding | deleterious(0) | possibly_damaging(0.891) | TCGA-AP-A059-01 | Endometrium | uterine corpus endometrioid carcinoma | Female | >=65 | I/II | Unknown | Unknown | SD | |
| PPME1 | SNV | Missense_Mutation | novel | c.569N>A | p.Ala190Glu | p.A190E | Q9Y570 | protein_coding | deleterious(0) | possibly_damaging(0.881) | TCGA-AX-A1CE-01 | Endometrium | uterine corpus endometrioid carcinoma | Female | <65 | I/II | Unspecific | Paclitaxel | SD |
| Page: 1 2 3 |
Top |
Related drugs of malignant transformation related genes |
| Identification of chemicals and drugs interact with genes involved in malignant transfromation |
| (DGIdb 4.0) |
| Entrez ID | Symbol | Category | Interaction Types | Drug Claim Name | Drug Name | PMIDs |
| 51400 | PPME1 | ENZYME, DRUGGABLE GENOME | inhibitor | 252166809 |
| Page: 1 |

Copyright 2023-Present -The University of Texas Health Science Center at Houston |