Schematic overview of the cellular and molecular mechanisms involved in the cancer progression, including the proposed cellular and molecular mechanisms in cancer cells trajectory. AT1: alveolar type 1 cells; AT2: alveolar type 2 cells; AAH: atypical adenomatous hyperplasia; AIS: adenocarcinoma in situ; MIA: minimally invasive adenocarcinoma; IA: invasive adenocarcinoma; EMT: epithelial-mesenchymal transition

Home

Download

Statistics

Help

Contact

Center for Computational Systems Medicine
leaf

Gene summary

leaf

Malignant transformation analysis

leaf

Malignant transformation related pathway analysis

leaf

Cell-cell communication analysis

leaf

Single-cell gene regulatory network inference analysis

leaf

Somatic mutation of malignant transformation related genes

leaf

Related drugs of malignant transformation related genes

Gene: PPM1L

Gene summary for PPM1L

check button Gene summary.

Gene informationSpeciesHuman
Gene symbol

PPM1L

Gene ID

151742

Gene nameprotein phosphatase, Mg2+/Mn2+ dependent 1L
Gene AliasPP2C-epsilon
Cytomap3q25.33-q26.1
Gene Typeprotein-coding
GO ID

GO:0000165

UniProtAcc

Q5SGD2


Top

Malignant transformation analysis

check button Identification of the aberrant gene expression in precancerous and cancerous lesions by comparing the gene expression of stem-like cells in diseased tissues with normal stem cells
check button Malignant transformation involving gene list.
Entrez IDSymbolReplicatesSpeciesOrganTissueAdj P-valueLog2FCMalignancy
151742PPM1LCCI_1HumanCervixCC8.96e-056.43e-010.528
151742PPM1LCCI_2HumanCervixCC1.63e-061.10e+000.5249
151742PPM1LLZE22D1HumanEsophagusHGIN1.03e-041.17e-010.0595
151742PPM1LLZE24THumanEsophagusESCC5.60e-153.82e-010.0596
151742PPM1LP1T-EHumanEsophagusESCC3.57e-064.24e-010.0875
151742PPM1LP2T-EHumanEsophagusESCC3.15e-101.70e-010.1177
151742PPM1LP4T-EHumanEsophagusESCC3.33e-102.67e-010.1323
151742PPM1LP8T-EHumanEsophagusESCC1.19e-083.96e-010.0889
151742PPM1LP10T-EHumanEsophagusESCC4.32e-173.30e-010.116
151742PPM1LP12T-EHumanEsophagusESCC1.56e-138.81e-020.1122
151742PPM1LP16T-EHumanEsophagusESCC5.58e-121.13e-010.1153
151742PPM1LP20T-EHumanEsophagusESCC5.24e-033.82e-020.1124
151742PPM1LP22T-EHumanEsophagusESCC1.73e-023.02e-020.1236
151742PPM1LP23T-EHumanEsophagusESCC7.44e-063.36e-010.108
151742PPM1LP26T-EHumanEsophagusESCC2.44e-043.85e-020.1276
151742PPM1LP27T-EHumanEsophagusESCC1.17e-192.84e-010.1055
151742PPM1LP28T-EHumanEsophagusESCC2.26e-052.23e-020.1149
151742PPM1LP30T-EHumanEsophagusESCC1.81e-167.77e-010.137
151742PPM1LP31T-EHumanEsophagusESCC1.17e-037.79e-030.1251
151742PPM1LP36T-EHumanEsophagusESCC3.92e-021.62e-020.1187
Page: 1 2 3 

check button Transcriptomic changes along malignancy continuum.
TissueExpression DynamicsAbbreviation
CervixThe image shows the transcriptomic changes along malignancy continuum.log2FC in expression of this searched gene in stem-like cells from each diseased tissue sample relative to stem-like cells in normal samples in each tissue plotted against the malignancy continuum. Samples are colored based on if they are from different disease stage.CC: Cervix cancer
HSIL_HPV: HPV-infected high-grade squamous intraepithelial lesions
N_HPV: HPV-infected normal cervix
EsophagusThe image shows the transcriptomic changes along malignancy continuum.log2FC in expression of this searched gene in stem-like cells from each diseased tissue sample relative to stem-like cells in normal samples in each tissue plotted against the malignancy continuum. Samples are colored based on if they are from different disease stage.
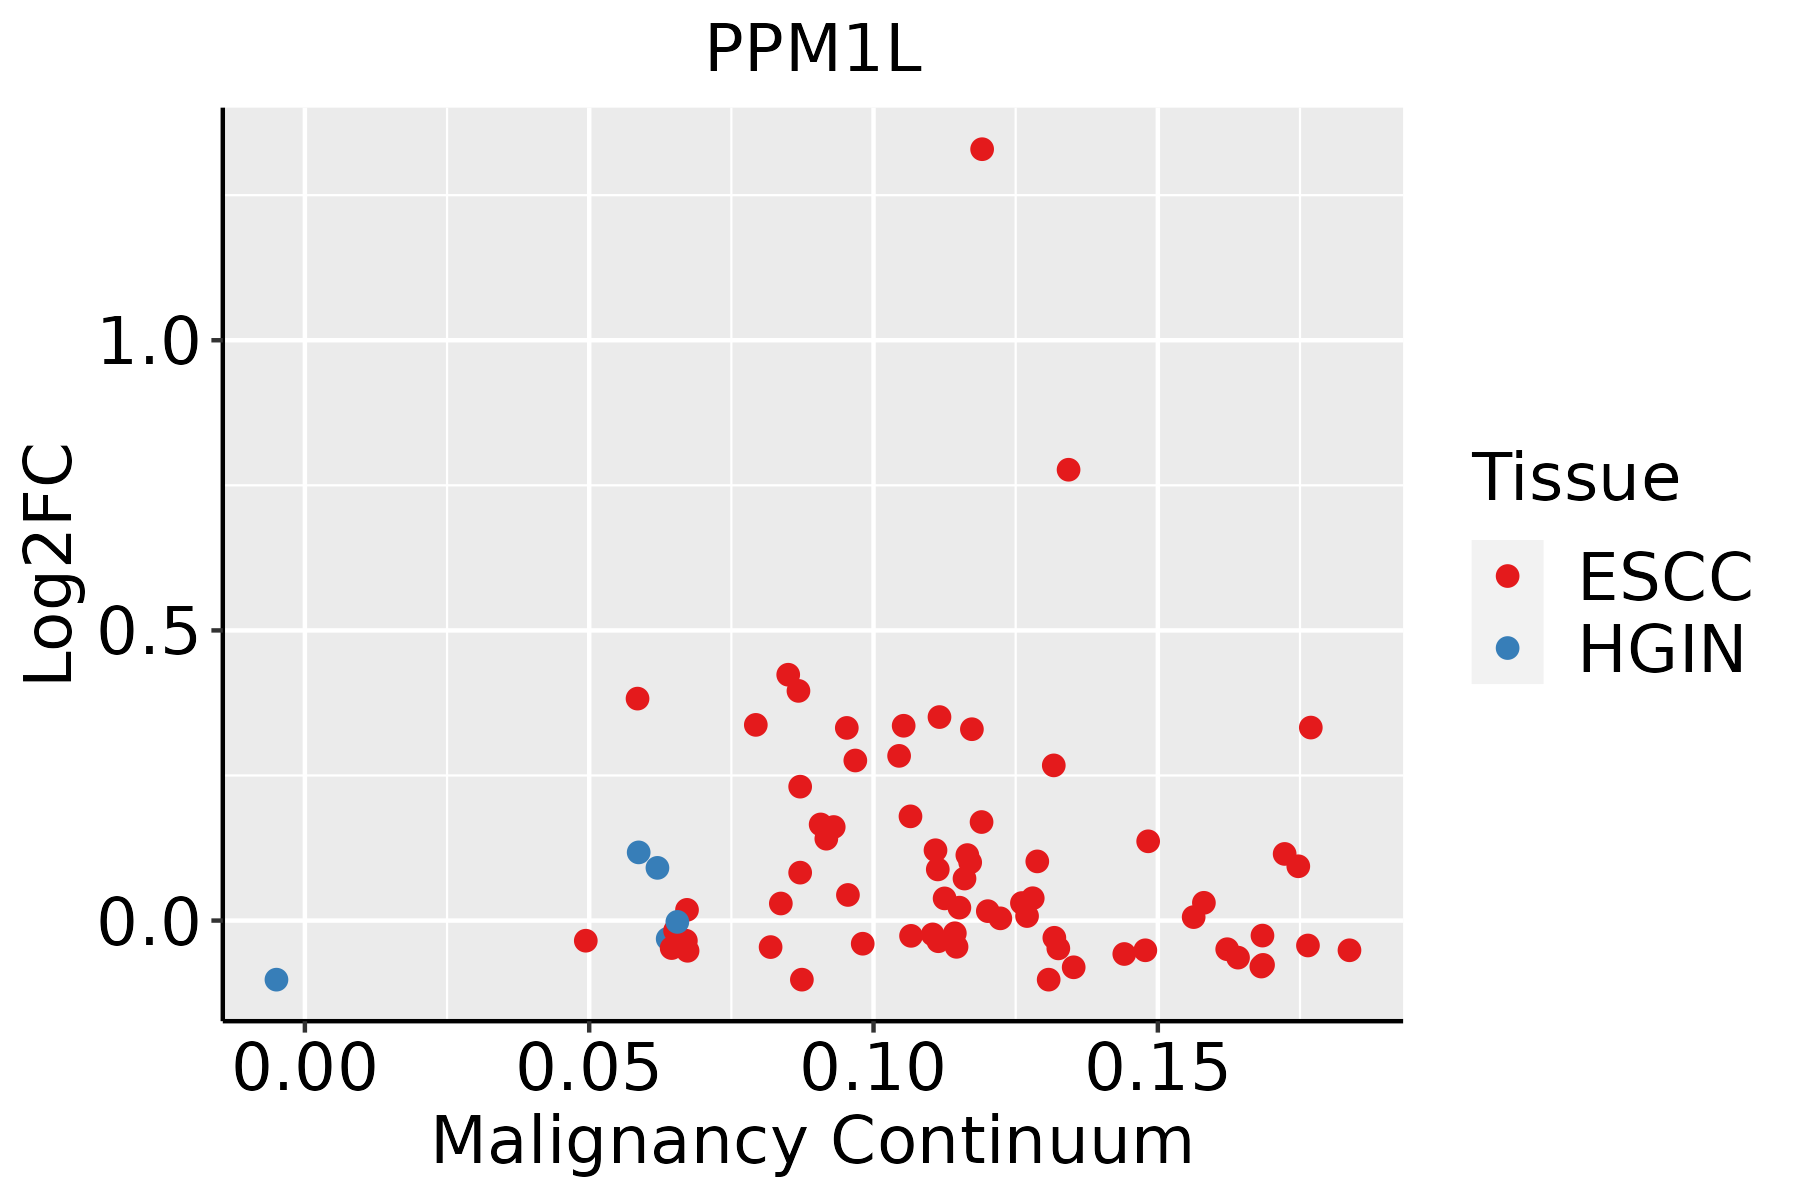
ESCC: Esophageal squamous cell carcinoma
HGIN: High-grade intraepithelial neoplasias
LGIN: Low-grade intraepithelial neoplasias
LiverThe image shows the transcriptomic changes along malignancy continuum.log2FC in expression of this searched gene in stem-like cells from each diseased tissue sample relative to stem-like cells in normal samples in each tissue plotted against the malignancy continuum. Samples are colored based on if they are from different disease stage.
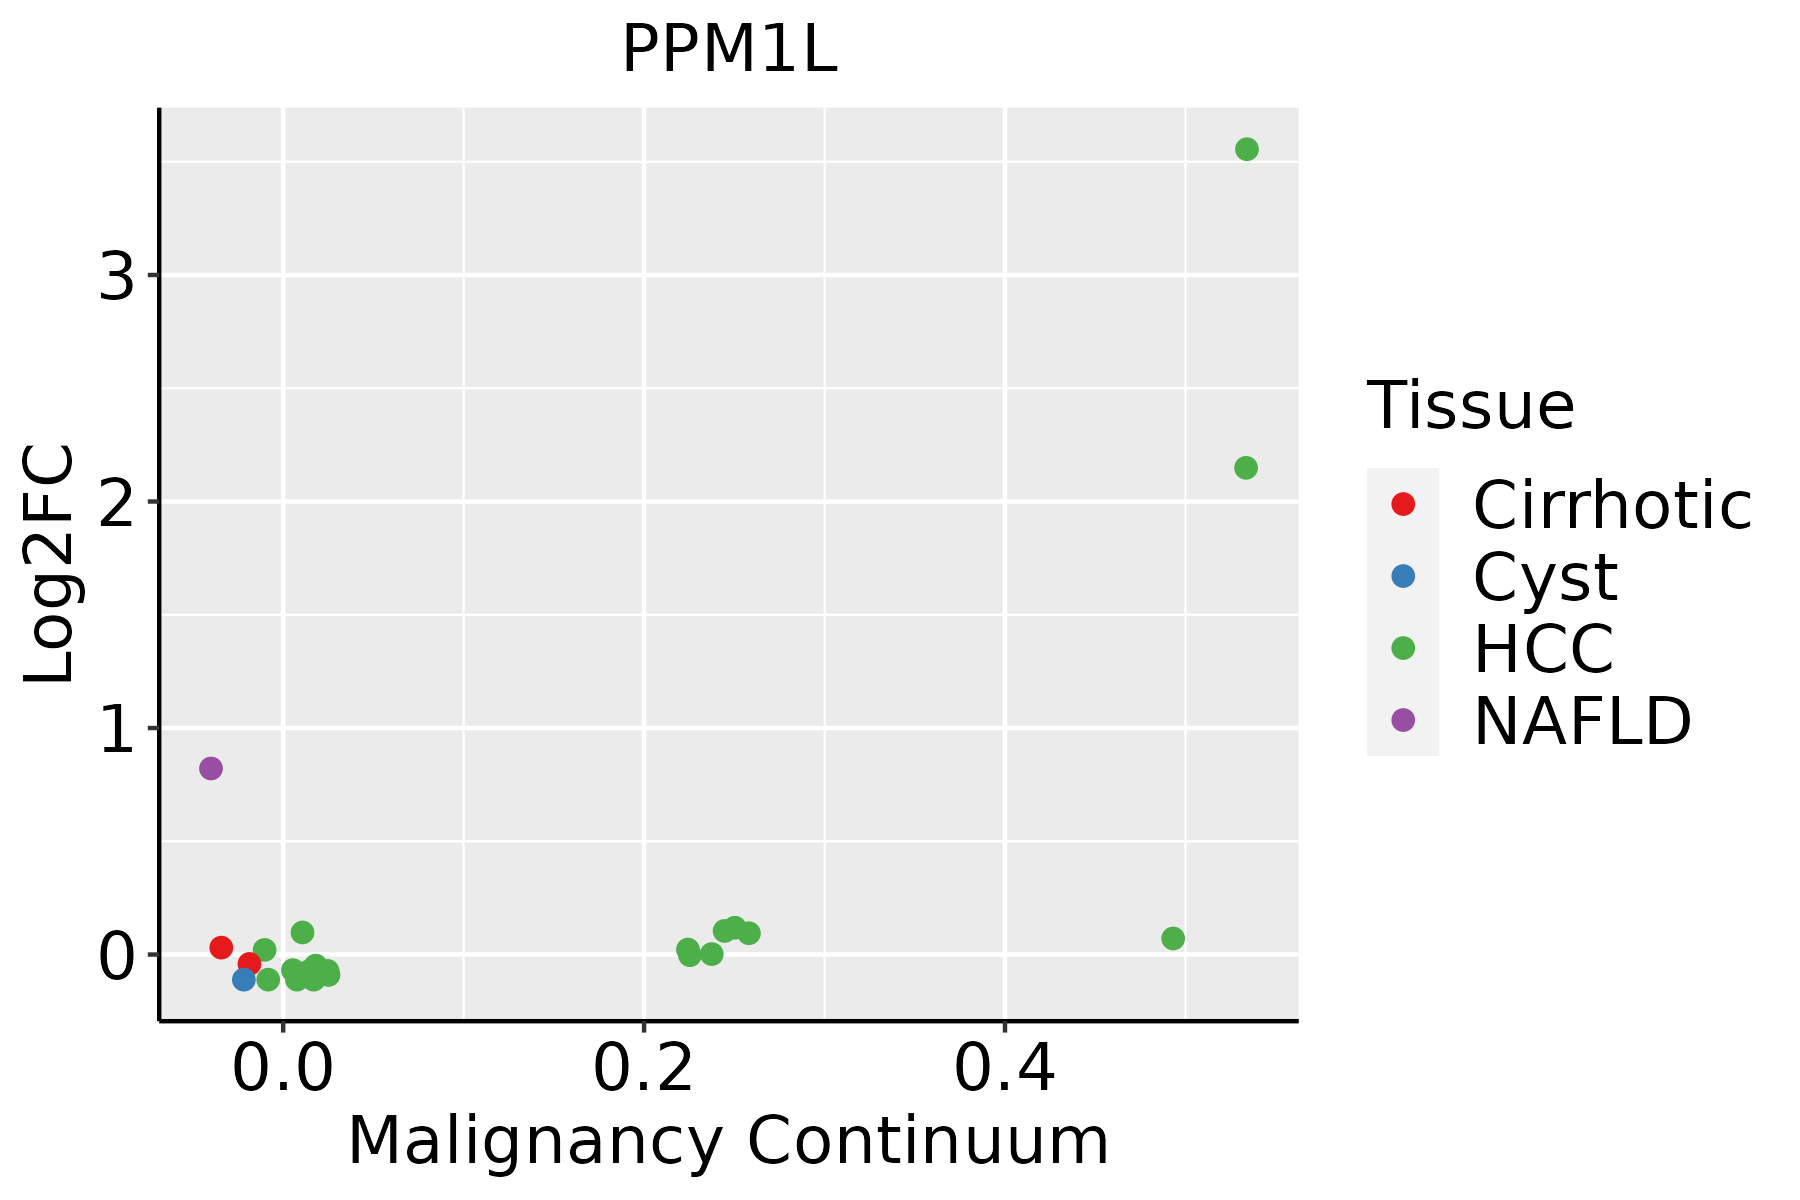
HCC: Hepatocellular carcinoma
NAFLD: Non-alcoholic fatty liver disease
SkinThe image shows the transcriptomic changes along malignancy continuum.log2FC in expression of this searched gene in stem-like cells from each diseased tissue sample relative to stem-like cells in normal samples in each tissue plotted against the malignancy continuum. Samples are colored based on if they are from different disease stage.
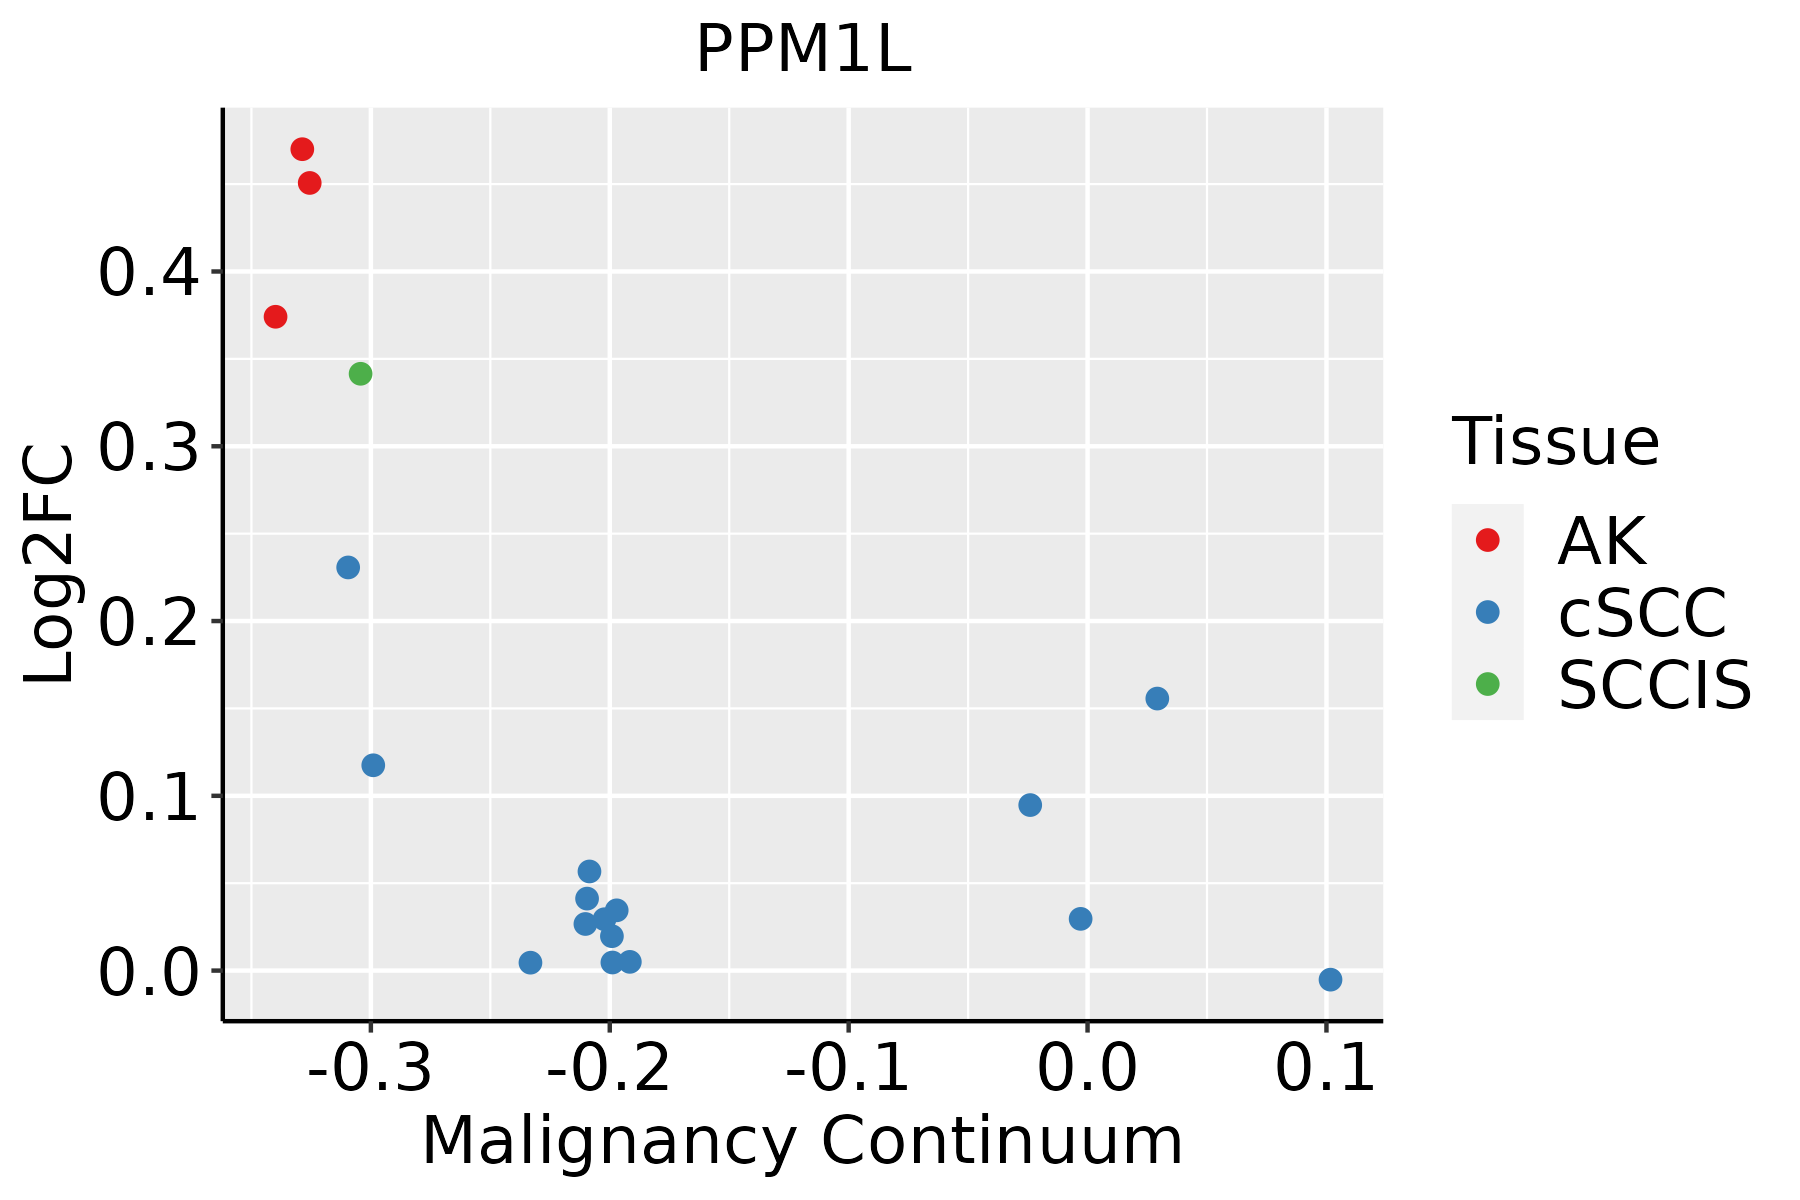
AK: Actinic keratosis
cSCC: Cutaneous squamous cell carcinoma
SCCIS:squamous cell carcinoma in situ
∗log2FC in expression of this searched gene in stem-like cells from each diseased tissue sample relative to stem-like cells in normal samples in each tissue plotted against the malignancy continuum. Samples are colored based on if they are from different disease stage.

Top

Malignant transformation related pathway analysis

check buttonFind out the enriched GO biological processes and KEGG pathways involved in transition from healthy to precancer to cancer
check button Figure of enriched GO biological processes.
TissueDisease StageEnriched GO biological Processes
ColorectumADGO analysis - Figure of enriched GO biological processes: Top 15 enriched GO BP terms are showed in the bar plot of each disease state in each tissue. Each row represents a significant GO biological process which is colored according to the -log10(p.adjust).
ColorectumSERGO analysis - Figure of enriched GO biological processes: Top 15 enriched GO BP terms are showed in the bar plot of each disease state in each tissue. Each row represents a significant GO biological process which is colored according to the -log10(p.adjust).
ColorectumMSSGO analysis - Figure of enriched GO biological processes: Top 15 enriched GO BP terms are showed in the bar plot of each disease state in each tissue. Each row represents a significant GO biological process which is colored according to the -log10(p.adjust).
ColorectumMSI-HGO analysis - Figure of enriched GO biological processes: Top 15 enriched GO BP terms are showed in the bar plot of each disease state in each tissue. Each row represents a significant GO biological process which is colored according to the -log10(p.adjust).
ColorectumFAPGO analysis - Figure of enriched GO biological processes: Top 15 enriched GO BP terms are showed in the bar plot of each disease state in each tissue. Each row represents a significant GO biological process which is colored according to the -log10(p.adjust).
∗Top 15 enriched GO BP terms are showed in the bar plot of each disease state in each tissue. Each row represents a significant GO biological process which is colored according to the -log10(p.adjust).
Page: 1 2 3 4 5 6 7 8 9 

check button Enriched GO biological processes.
GO IDTissueDisease StageDescriptionGene RatioBg Ratiopvaluep.adjustCount
GO:00064708CervixCCprotein dephosphorylation60/2311281/187231.33e-052.68e-0460
GO:00071786CervixCCtransmembrane receptor protein serine/threonine kinase signaling pathway67/2311355/187232.39e-042.67e-0367
GO:00163117CervixCCdephosphorylation73/2311417/187231.23e-039.87e-0373
GO:000647017EsophagusHGINprotein dephosphorylation61/2587281/187231.86e-043.51e-0361
GO:001631110EsophagusESCCdephosphorylation251/8552417/187231.26e-092.99e-08251
GO:000647018EsophagusESCCprotein dephosphorylation177/8552281/187233.13e-096.72e-08177
GO:00066433EsophagusESCCmembrane lipid metabolic process130/8552203/187239.29e-081.54e-06130
GO:00464673EsophagusESCCmembrane lipid biosynthetic process91/8552142/187237.19e-067.19e-0591
GO:00066652EsophagusESCCsphingolipid metabolic process96/8552155/187233.21e-052.66e-0496
GO:000717810EsophagusESCCtransmembrane receptor protein serine/threonine kinase signaling pathway195/8552355/187232.58e-041.58e-03195
GO:00301481EsophagusESCCsphingolipid biosynthetic process62/8552103/187232.10e-039.38e-0362
GO:00163115LiverNAFLDdephosphorylation69/1882417/187232.27e-056.23e-0469
GO:00064706LiverNAFLDprotein dephosphorylation50/1882281/187234.53e-051.09e-0350
GO:00071784LiverNAFLDtransmembrane receptor protein serine/threonine kinase signaling pathway56/1882355/187234.50e-046.62e-0356
GO:000647011LiverCirrhoticprotein dephosphorylation96/4634281/187232.32e-042.11e-0396
GO:001631111LiverCirrhoticdephosphorylation130/4634417/187231.58e-031.03e-02130
GO:0006643LiverCirrhoticmembrane lipid metabolic process69/4634203/187231.89e-031.19e-0269
GO:000717811LiverCirrhotictransmembrane receptor protein serine/threonine kinase signaling pathway111/4634355/187232.98e-031.70e-02111
GO:001631121LiverHCCdephosphorylation230/7958417/187231.00e-071.96e-06230
GO:000647021LiverHCCprotein dephosphorylation162/7958281/187231.91e-073.46e-06162
Page: 1 2 

check button Enriched KEGG pathways.
Pathway IDTissueDisease StageDescriptionGene RatioBg Ratiopvaluep.adjustqvalueCount
Page: 1 

Top

Cell-cell communication analysis

check buttonIdentification of potential cell-cell interactions between two cell types and their ligand-receptor pairs for different disease states
LigandReceptorLRpairPathwayTissueDisease Stage
Page: 1 

Top

Single-cell gene regulatory network inference analysis

check buttonFind out the significant the regulons (TFs) and the target genes of each regulon across cell types for different disease states
TFCell TypeTissueDisease StageTarget GeneRSSRegulon Activity
∗The dot plots of a searched regulon are shown for all cell subpopulations in each disease state of each tissue based on the regulon specific score inferred using pySCENIC and by calculating the average expression.
Page: 1 

Top

Somatic mutation of malignant transformation related genes

check buttonAnnotation of somatic variants for genes involved in malignant transformation
Hugo SymbolVariant ClassVariant ClassificationdbSNP RSHGVScHGVSpHGVSp ShortSWISSPROTBIOTYPESIFTPolyPhenTumor Sample BarcodeTissueHistologySexAgeStageTherapy TypesDrugsOutcome
PPM1LSNVMissense_Mutationc.689N>Cp.Asp230Alap.D230AQ5SGD2protein_codingdeleterious(0)probably_damaging(1)TCGA-BH-A0H0-01Breastbreast invasive carcinomaFemale>=65I/IIHormone TherapyarimidexSD
PPM1LSNVMissense_Mutationnovelc.776G>Ap.Gly259Glup.G259EQ5SGD2protein_codingdeleterious(0)probably_damaging(1)TCGA-C8-A1HM-01Breastbreast invasive carcinomaFemale>=65I/IIChemotherapydoxorubicinCR
PPM1LinsertionIn_Frame_Insnovelc.172_173insGCCp.Met58delinsSerLeup.M58delinsSLQ5SGD2protein_codingTCGA-A8-A07R-01Breastbreast invasive carcinomaFemale>=65III/IVAncillaryzoledronicSD
PPM1LinsertionIn_Frame_Insnovelc.173_174insCTGCTCGCGCTGCCTGCTCGGAGCCGCTTGCTCp.Met58delinsIleCysSerArgCysLeuLeuGlyAlaAlaCysSerp.M58delinsICSRCLLGAACSQ5SGD2protein_codingTCGA-A8-A07R-01Breastbreast invasive carcinomaFemale>=65III/IVAncillaryzoledronicSD
PPM1LinsertionNonsense_Mutationnovelc.899_900insCACGGTGTTAAGTTAAAAACCAATGCCCTCCCCCATATGTp.Ser301ThrfsTer5p.S301Tfs*5Q5SGD2protein_codingTCGA-AN-A03X-01Breastbreast invasive carcinomaFemale>=65I/IIUnknownUnknownSD
PPM1LSNVMissense_Mutationrs757453078c.670G>Ap.Ala224Thrp.A224TQ5SGD2protein_codingtolerated(0.12)possibly_damaging(0.804)TCGA-2W-A8YY-01Cervixcervical & endocervical cancerFemale<65I/IIChemotherapycisplatinCR
PPM1LSNVMissense_Mutationc.980G>Tp.Gly327Valp.G327VQ5SGD2protein_codingdeleterious(0)probably_damaging(0.989)TCGA-AA-3844-01Colorectumcolon adenocarcinomaFemale>=65III/IVChemotherapycapecitabinePD
PPM1LSNVMissense_Mutationc.469N>Tp.Asp157Tyrp.D157YQ5SGD2protein_codingdeleterious(0.02)benign(0.203)TCGA-AA-A00N-01Colorectumcolon adenocarcinomaMale>=65I/IIUnknownUnknownPD
PPM1LSNVMissense_Mutationc.956N>Cp.Glu319Alap.E319AQ5SGD2protein_codingdeleterious(0.01)probably_damaging(0.935)TCGA-AY-6196-01Colorectumcolon adenocarcinomaMale<65III/IVUnknownUnknownSD
PPM1LSNVMissense_Mutationnovelc.791N>Ap.Ser264Tyrp.S264YQ5SGD2protein_codingdeleterious(0)probably_damaging(0.998)TCGA-AZ-4315-01Colorectumcolon adenocarcinomaMale<65I/IIUnknownUnknownSD
Page: 1 2 3 4 5 6 

Top

Related drugs of malignant transformation related genes

check buttonIdentification of chemicals and drugs interact with genes involved in malignant transfromation
(DGIdb 4.0)
Entrez IDSymbolCategoryInteraction TypesDrug Claim NameDrug NamePMIDs
Page: 1