
|
|||||
|
 | |
| |
| |
| |
| |
| |
|
Gene: PPM1K |
Gene summary for PPM1K |
| Gene information | Species | Human | Gene symbol | PPM1K | Gene ID | 152926 |
| Gene name | protein phosphatase, Mg2+/Mn2+ dependent 1K | |
| Gene Alias | BDP | |
| Cytomap | 4q22.1 | |
| Gene Type | protein-coding | GO ID | GO:0006464 | UniProtAcc | Q8N3J5 |
Top |
Malignant transformation analysis |
| Identification of the aberrant gene expression in precancerous and cancerous lesions by comparing the gene expression of stem-like cells in diseased tissues with normal stem cells |
| Entrez ID | Symbol | Replicates | Species | Organ | Tissue | Adj P-value | Log2FC | Malignancy |
| 152926 | PPM1K | LZE7T | Human | Esophagus | ESCC | 6.38e-04 | 2.64e-01 | 0.0667 |
| 152926 | PPM1K | LZE24T | Human | Esophagus | ESCC | 1.85e-15 | 5.97e-01 | 0.0596 |
| 152926 | PPM1K | P1T-E | Human | Esophagus | ESCC | 5.31e-06 | 2.61e-01 | 0.0875 |
| 152926 | PPM1K | P2T-E | Human | Esophagus | ESCC | 2.32e-44 | 8.25e-01 | 0.1177 |
| 152926 | PPM1K | P4T-E | Human | Esophagus | ESCC | 3.97e-07 | 1.86e-01 | 0.1323 |
| 152926 | PPM1K | P8T-E | Human | Esophagus | ESCC | 1.03e-14 | 2.75e-01 | 0.0889 |
| 152926 | PPM1K | P9T-E | Human | Esophagus | ESCC | 2.78e-06 | 2.03e-01 | 0.1131 |
| 152926 | PPM1K | P10T-E | Human | Esophagus | ESCC | 2.60e-09 | 1.30e-01 | 0.116 |
| 152926 | PPM1K | P11T-E | Human | Esophagus | ESCC | 1.84e-07 | 4.52e-01 | 0.1426 |
| 152926 | PPM1K | P12T-E | Human | Esophagus | ESCC | 1.57e-11 | 1.94e-01 | 0.1122 |
| 152926 | PPM1K | P15T-E | Human | Esophagus | ESCC | 1.63e-05 | 1.83e-02 | 0.1149 |
| 152926 | PPM1K | P16T-E | Human | Esophagus | ESCC | 2.76e-22 | 5.35e-01 | 0.1153 |
| 152926 | PPM1K | P17T-E | Human | Esophagus | ESCC | 1.36e-03 | 1.04e-01 | 0.1278 |
| 152926 | PPM1K | P19T-E | Human | Esophagus | ESCC | 1.44e-05 | 3.18e-01 | 0.1662 |
| 152926 | PPM1K | P20T-E | Human | Esophagus | ESCC | 3.84e-03 | 4.69e-02 | 0.1124 |
| 152926 | PPM1K | P21T-E | Human | Esophagus | ESCC | 3.09e-02 | 4.94e-02 | 0.1617 |
| 152926 | PPM1K | P22T-E | Human | Esophagus | ESCC | 1.40e-08 | 2.55e-03 | 0.1236 |
| 152926 | PPM1K | P23T-E | Human | Esophagus | ESCC | 4.15e-03 | 1.97e-01 | 0.108 |
| 152926 | PPM1K | P24T-E | Human | Esophagus | ESCC | 1.92e-12 | 1.68e-01 | 0.1287 |
| 152926 | PPM1K | P26T-E | Human | Esophagus | ESCC | 1.17e-16 | 3.58e-01 | 0.1276 |
| Page: 1 2 3 4 |
| Tissue | Expression Dynamics | Abbreviation |
| Esophagus |  | ESCC: Esophageal squamous cell carcinoma |
| HGIN: High-grade intraepithelial neoplasias | ||
| LGIN: Low-grade intraepithelial neoplasias | ||
| Liver |  | HCC: Hepatocellular carcinoma |
| NAFLD: Non-alcoholic fatty liver disease | ||
| Prostate | 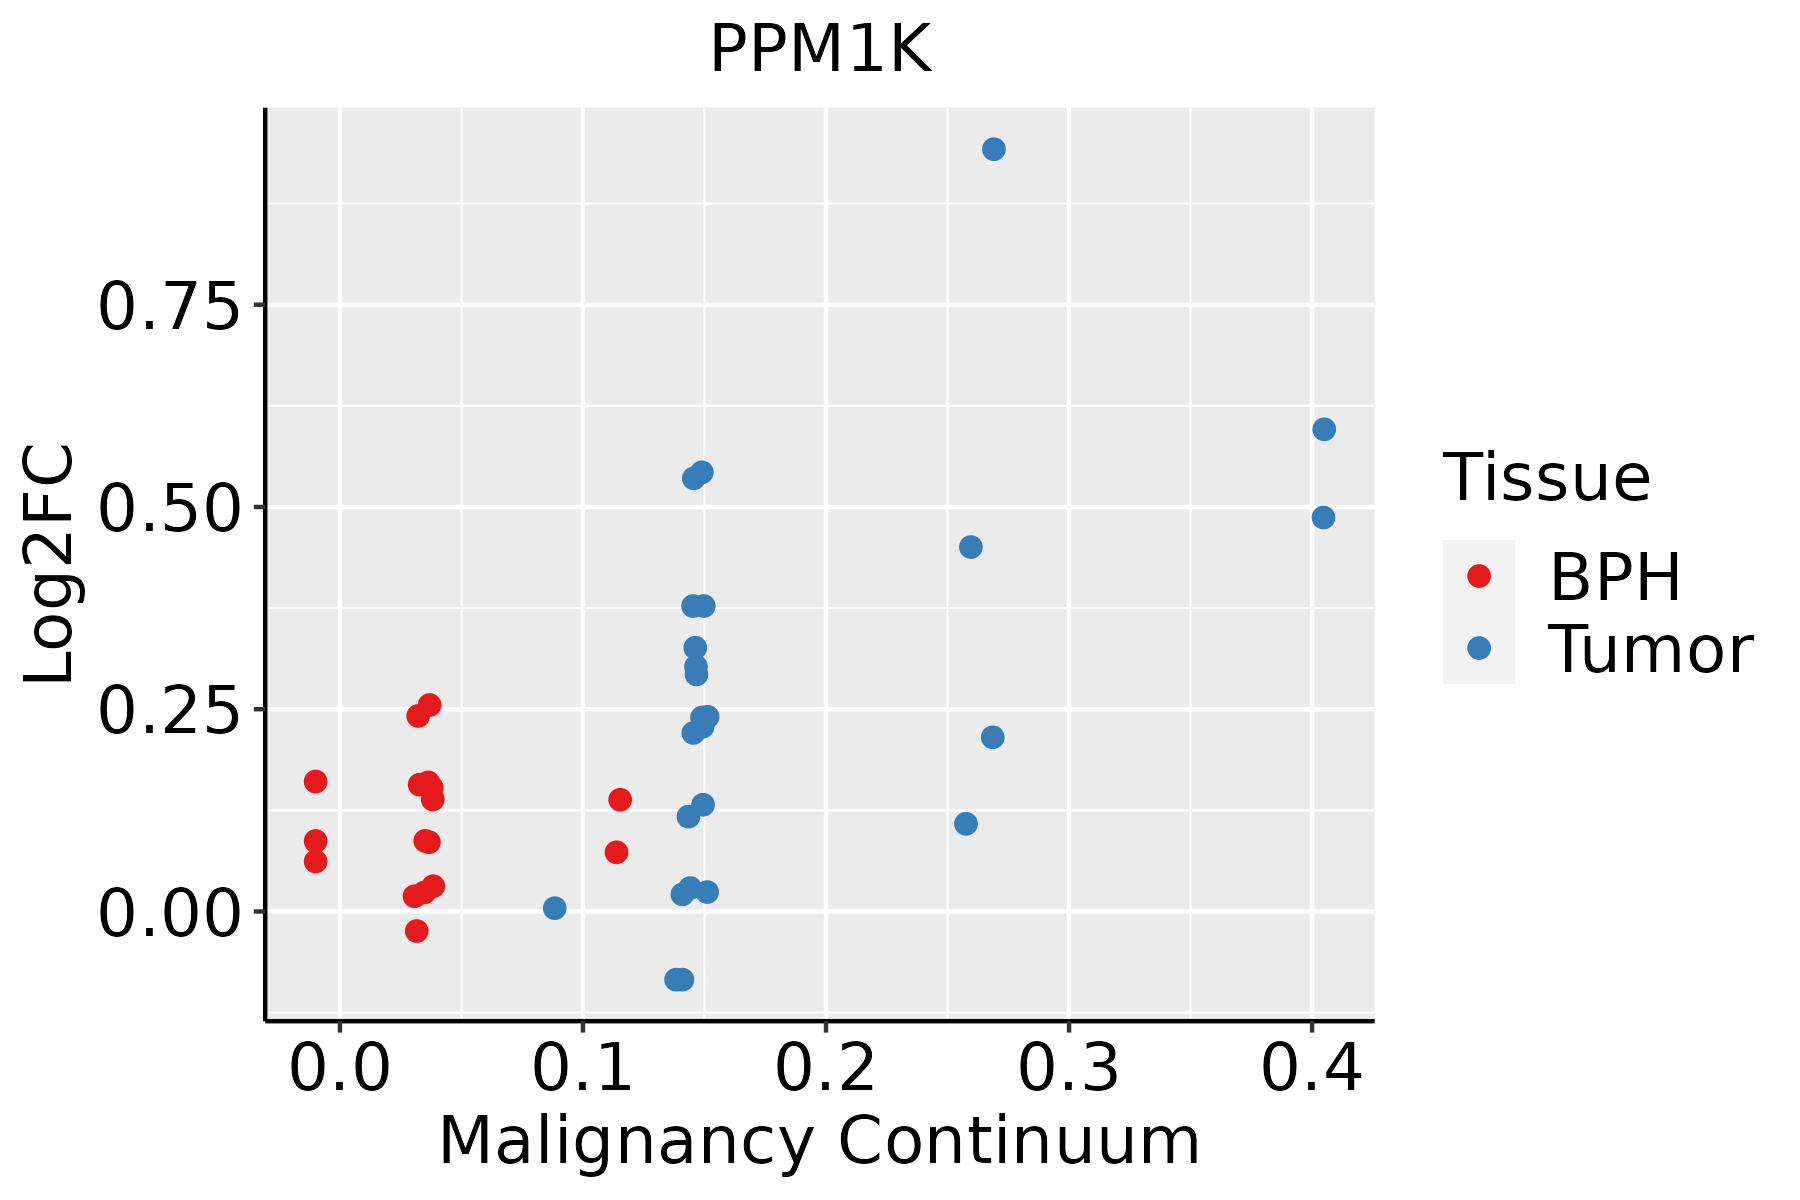 | BPH: Benign Prostatic Hyperplasia |
| Thyroid |  | ATC: Anaplastic thyroid cancer |
| HT: Hashimoto's thyroiditis | ||
| PTC: Papillary thyroid cancer |
| ∗log2FC in expression of this searched gene in stem-like cells from each diseased tissue sample relative to stem-like cells in normal samples in each tissue plotted against the malignancy continuum. Samples are colored based on if they are from different disease stage. |
Top |
Malignant transformation related pathway analysis |
| Find out the enriched GO biological processes and KEGG pathways involved in transition from healthy to precancer to cancer |
| Tissue | Disease Stage | Enriched GO biological Processes |
| Colorectum | AD |  |
| Colorectum | SER |  |
| Colorectum | MSS |  |
| Colorectum | MSI-H |  |
| Colorectum | FAP |  |
| ∗Top 15 enriched GO BP terms are showed in the bar plot of each disease state in each tissue. Each row represents a significant GO biological process which is colored according to the -log10(p.adjust). |
| Page: 1 2 3 4 5 6 7 8 9 |
| GO ID | Tissue | Disease Stage | Description | Gene Ratio | Bg Ratio | pvalue | p.adjust | Count |
| GO:001631110 | Esophagus | ESCC | dephosphorylation | 251/8552 | 417/18723 | 1.26e-09 | 2.99e-08 | 251 |
| GO:000647018 | Esophagus | ESCC | protein dephosphorylation | 177/8552 | 281/18723 | 3.13e-09 | 6.72e-08 | 177 |
| GO:001631121 | Liver | HCC | dephosphorylation | 230/7958 | 417/18723 | 1.00e-07 | 1.96e-06 | 230 |
| GO:000647021 | Liver | HCC | protein dephosphorylation | 162/7958 | 281/18723 | 1.91e-07 | 3.46e-06 | 162 |
| GO:000647014 | Prostate | Tumor | protein dephosphorylation | 76/3246 | 281/18723 | 2.86e-05 | 3.46e-04 | 76 |
| GO:001631113 | Prostate | Tumor | dephosphorylation | 98/3246 | 417/18723 | 7.31e-04 | 5.08e-03 | 98 |
| GO:001631116 | Thyroid | PTC | dephosphorylation | 174/5968 | 417/18723 | 1.20e-05 | 1.31e-04 | 174 |
| GO:000647020 | Thyroid | PTC | protein dephosphorylation | 123/5968 | 281/18723 | 1.69e-05 | 1.77e-04 | 123 |
| GO:0006470111 | Thyroid | ATC | protein dephosphorylation | 129/6293 | 281/18723 | 1.11e-05 | 1.09e-04 | 129 |
| GO:001631117 | Thyroid | ATC | dephosphorylation | 179/6293 | 417/18723 | 3.88e-05 | 3.15e-04 | 179 |
| Page: 1 |
| Pathway ID | Tissue | Disease Stage | Description | Gene Ratio | Bg Ratio | pvalue | p.adjust | qvalue | Count |
| Page: 1 |
Top |
Cell-cell communication analysis |
| Identification of potential cell-cell interactions between two cell types and their ligand-receptor pairs for different disease states |
| Ligand | Receptor | LRpair | Pathway | Tissue | Disease Stage |
| Page: 1 |
Top |
Single-cell gene regulatory network inference analysis |
| Find out the significant the regulons (TFs) and the target genes of each regulon across cell types for different disease states |
| TF | Cell Type | Tissue | Disease Stage | Target Gene | RSS | Regulon Activity |
| ∗The dot plots of a searched regulon are shown for all cell subpopulations in each disease state of each tissue based on the regulon specific score inferred using pySCENIC and by calculating the average expression. |
| Page: 1 |
Top |
Somatic mutation of malignant transformation related genes |
| Annotation of somatic variants for genes involved in malignant transformation |
| Hugo Symbol | Variant Class | Variant Classification | dbSNP RS | HGVSc | HGVSp | HGVSp Short | SWISSPROT | BIOTYPE | SIFT | PolyPhen | Tumor Sample Barcode | Tissue | Histology | Sex | Age | Stage | Therapy Types | Drugs | Outcome |
| PPM1K | SNV | Missense_Mutation | novel | c.714G>T | p.Lys238Asn | p.K238N | Q8N3J5 | protein_coding | deleterious(0.03) | benign(0.384) | TCGA-AN-A046-01 | Breast | breast invasive carcinoma | Female | >=65 | I/II | Unknown | Unknown | SD |
| PPM1K | SNV | Missense_Mutation | novel | c.896G>A | p.Gly299Glu | p.G299E | Q8N3J5 | protein_coding | deleterious(0) | probably_damaging(1) | TCGA-2W-A8YY-01 | Cervix | cervical & endocervical cancer | Female | <65 | I/II | Chemotherapy | cisplatin | CR |
| PPM1K | SNV | Missense_Mutation | novel | c.859N>T | p.His287Tyr | p.H287Y | Q8N3J5 | protein_coding | deleterious(0) | probably_damaging(0.934) | TCGA-ZJ-AAX8-01 | Cervix | cervical & endocervical cancer | Female | <65 | III/IV | Unknown | Unknown | SD |
| PPM1K | SNV | Missense_Mutation | rs370483637 | c.515N>T | p.Ser172Leu | p.S172L | Q8N3J5 | protein_coding | tolerated(0.28) | benign(0.109) | TCGA-AA-3502-01 | Colorectum | colon adenocarcinoma | Male | >=65 | I/II | Unknown | Unknown | SD |
| PPM1K | SNV | Missense_Mutation | rs753095031 | c.146G>A | p.Arg49Gln | p.R49Q | Q8N3J5 | protein_coding | deleterious_low_confidence(0.02) | possibly_damaging(0.788) | TCGA-AA-3870-01 | Colorectum | colon adenocarcinoma | Female | >=65 | III/IV | Chemotherapy | folinic | CR |
| PPM1K | SNV | Missense_Mutation | rs537053098 | c.110N>T | p.Thr37Met | p.T37M | Q8N3J5 | protein_coding | tolerated_low_confidence(0.1) | benign(0.108) | TCGA-D5-6530-01 | Colorectum | colon adenocarcinoma | Male | <65 | I/II | Unknown | Unknown | SD |
| PPM1K | SNV | Missense_Mutation | rs146041562 | c.209G>A | p.Arg70His | p.R70H | Q8N3J5 | protein_coding | deleterious(0) | probably_damaging(0.974) | TCGA-EI-6917-01 | Colorectum | rectum adenocarcinoma | Male | <65 | III/IV | Chemotherapy | 5fluorouracil+oxaciplatina+l-folinian | SD |
| PPM1K | insertion | Frame_Shift_Ins | novel | c.750dupG | p.Gln251AlafsTer20 | p.Q251Afs*20 | Q8N3J5 | protein_coding | TCGA-DM-A0XD-01 | Colorectum | colon adenocarcinoma | Male | >=65 | I/II | Unknown | Unknown | PD | ||
| PPM1K | SNV | Missense_Mutation | novel | c.917N>T | p.Ser306Ile | p.S306I | Q8N3J5 | protein_coding | deleterious(0.01) | possibly_damaging(0.687) | TCGA-AJ-A3EK-01 | Endometrium | uterine corpus endometrioid carcinoma | Female | <65 | I/II | Chemotherapy | carboplatin | CR |
| PPM1K | SNV | Missense_Mutation | c.14N>T | p.Ala5Val | p.A5V | Q8N3J5 | protein_coding | tolerated_low_confidence(1) | benign(0.015) | TCGA-AP-A056-01 | Endometrium | uterine corpus endometrioid carcinoma | Female | <65 | I/II | Unknown | Unknown | SD |
| Page: 1 2 3 4 5 |
Top |
Related drugs of malignant transformation related genes |
| Identification of chemicals and drugs interact with genes involved in malignant transfromation |
| (DGIdb 4.0) |
| Entrez ID | Symbol | Category | Interaction Types | Drug Claim Name | Drug Name | PMIDs |
| Page: 1 |

Copyright 2023-Present -The University of Texas Health Science Center at Houston |