
|
|||||
|
 | |
| |
| |
| |
| |
| |
|
Gene: PPM1H |
Gene summary for PPM1H |
| Gene information | Species | Human | Gene symbol | PPM1H | Gene ID | 57460 |
| Gene name | protein phosphatase, Mg2+/Mn2+ dependent 1H | |
| Gene Alias | ARHCL1 | |
| Cytomap | 12q14.1-q14.2 | |
| Gene Type | protein-coding | GO ID | GO:0006464 | UniProtAcc | Q9ULR3 |
Top |
Malignant transformation analysis |
| Identification of the aberrant gene expression in precancerous and cancerous lesions by comparing the gene expression of stem-like cells in diseased tissues with normal stem cells |
| Entrez ID | Symbol | Replicates | Species | Organ | Tissue | Adj P-value | Log2FC | Malignancy |
| 57460 | PPM1H | HTA11_6818_2000001021 | Human | Colorectum | AD | 3.50e-08 | 7.52e-01 | 0.0588 |
| 57460 | PPM1H | HTA11_99999965062_69753 | Human | Colorectum | MSI-H | 1.20e-05 | 1.18e+00 | 0.3487 |
| 57460 | PPM1H | A002-C-010 | Human | Colorectum | FAP | 1.41e-04 | 3.76e-01 | 0.242 |
| 57460 | PPM1H | A015-C-203 | Human | Colorectum | FAP | 2.23e-13 | -2.33e-01 | -0.1294 |
| 57460 | PPM1H | A002-C-201 | Human | Colorectum | FAP | 2.74e-05 | 1.13e-01 | 0.0324 |
| 57460 | PPM1H | A001-C-119 | Human | Colorectum | FAP | 4.78e-02 | -2.25e-01 | -0.1557 |
| 57460 | PPM1H | A001-C-108 | Human | Colorectum | FAP | 6.32e-04 | -1.83e-03 | -0.0272 |
| 57460 | PPM1H | A002-C-021 | Human | Colorectum | FAP | 8.37e-09 | 4.75e-01 | 0.1171 |
| 57460 | PPM1H | A002-C-205 | Human | Colorectum | FAP | 4.44e-13 | -2.01e-01 | -0.1236 |
| 57460 | PPM1H | A015-C-006 | Human | Colorectum | FAP | 4.00e-08 | -2.59e-02 | -0.0994 |
| 57460 | PPM1H | A015-C-106 | Human | Colorectum | FAP | 1.92e-02 | -1.83e-02 | -0.0511 |
| 57460 | PPM1H | A002-C-114 | Human | Colorectum | FAP | 5.63e-11 | -1.13e-01 | -0.1561 |
| 57460 | PPM1H | A015-C-104 | Human | Colorectum | FAP | 1.29e-14 | -1.27e-01 | -0.1899 |
| 57460 | PPM1H | A001-C-014 | Human | Colorectum | FAP | 3.51e-02 | 6.04e-03 | 0.0135 |
| 57460 | PPM1H | A002-C-016 | Human | Colorectum | FAP | 6.47e-07 | -1.74e-03 | 0.0521 |
| 57460 | PPM1H | A015-C-002 | Human | Colorectum | FAP | 3.51e-06 | -2.47e-01 | -0.0763 |
| 57460 | PPM1H | A002-C-116 | Human | Colorectum | FAP | 7.24e-13 | -4.75e-02 | -0.0452 |
| 57460 | PPM1H | A014-C-008 | Human | Colorectum | FAP | 5.13e-09 | -2.38e-01 | -0.191 |
| 57460 | PPM1H | A018-E-020 | Human | Colorectum | FAP | 1.54e-11 | -2.16e-01 | -0.2034 |
| 57460 | PPM1H | F034 | Human | Colorectum | FAP | 3.76e-03 | -2.17e-02 | -0.0665 |
| Page: 1 2 3 |
| Tissue | Expression Dynamics | Abbreviation |
| Colorectum (GSE201348) |  | FAP: Familial adenomatous polyposis |
| CRC: Colorectal cancer | ||
| Colorectum (HTA11) |  | AD: Adenomas |
| SER: Sessile serrated lesions | ||
| MSI-H: Microsatellite-high colorectal cancer | ||
| MSS: Microsatellite stable colorectal cancer | ||
| Endometrium |  | AEH: Atypical endometrial hyperplasia |
| EEC: Endometrioid Cancer | ||
| Liver | 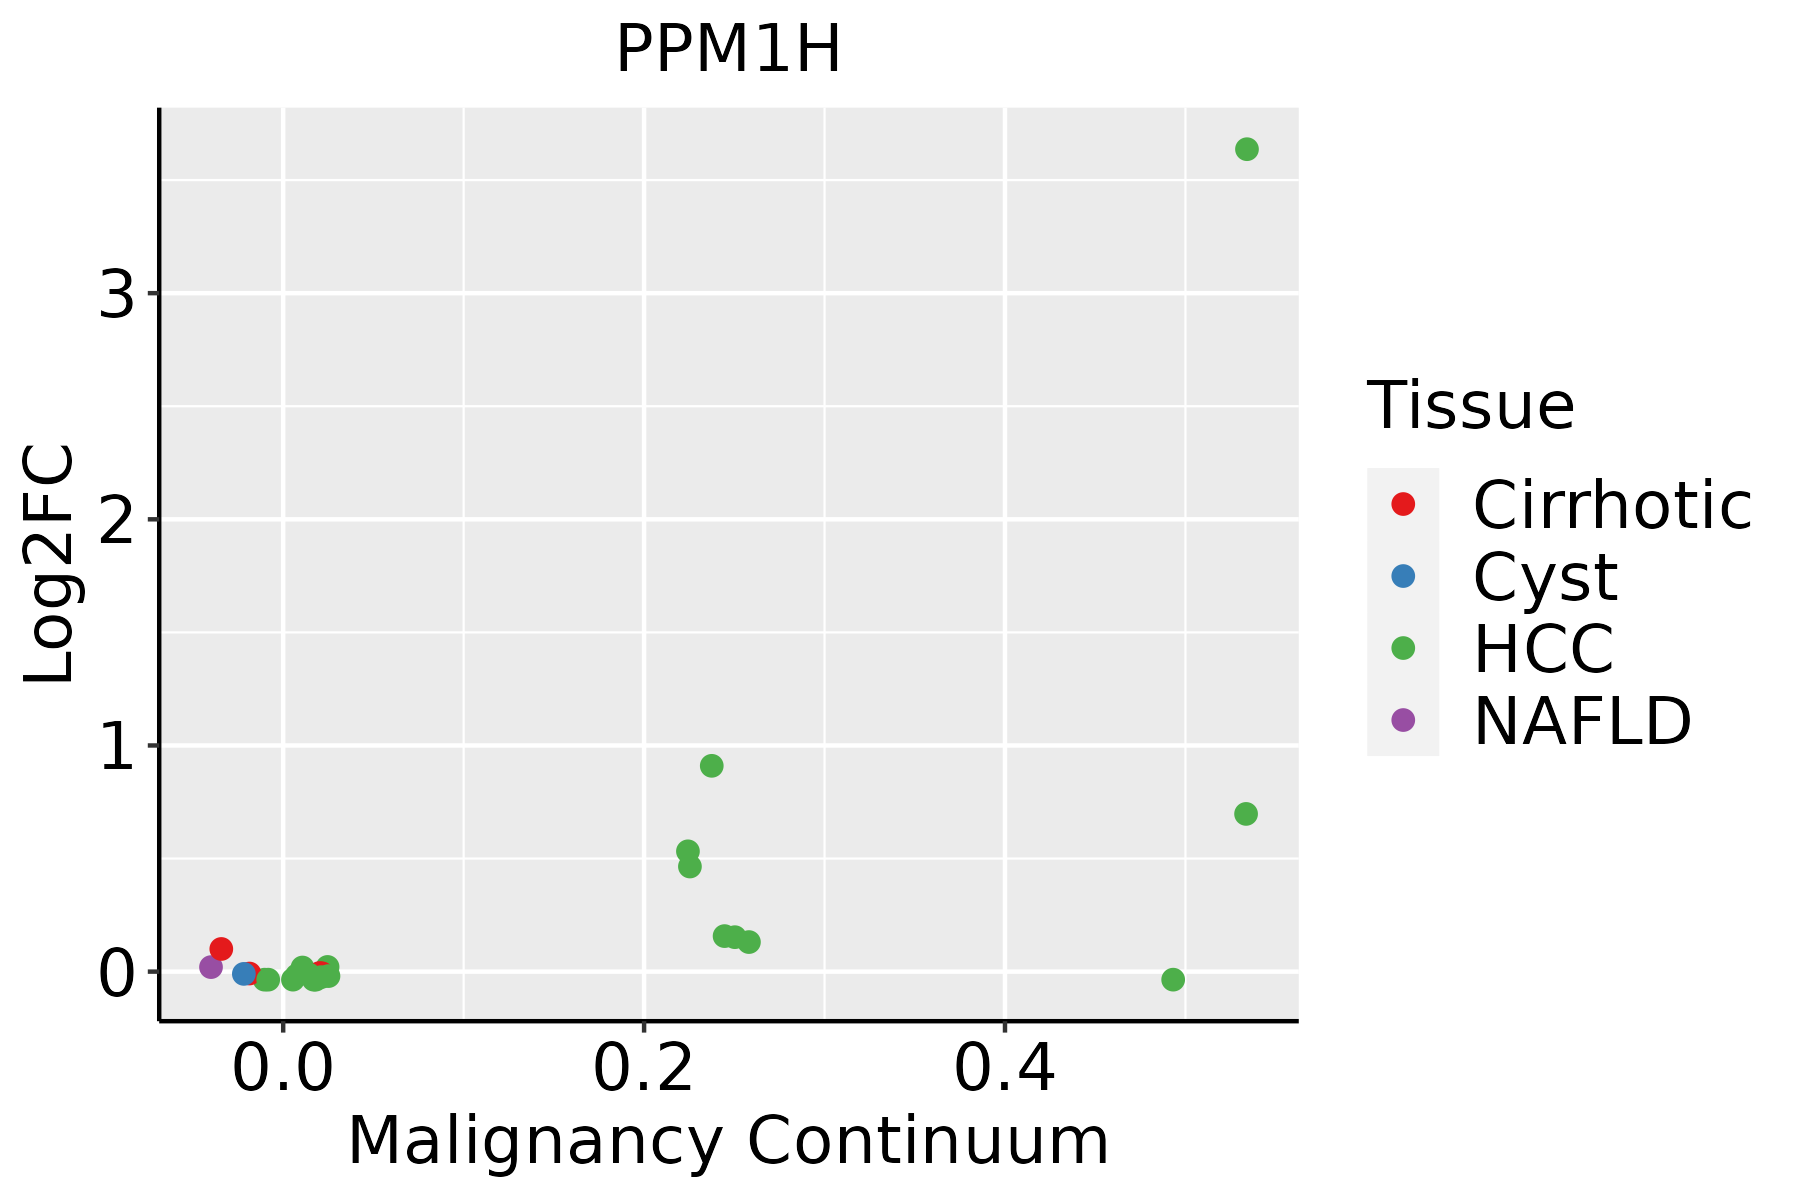 | HCC: Hepatocellular carcinoma |
| NAFLD: Non-alcoholic fatty liver disease | ||
| Prostate | 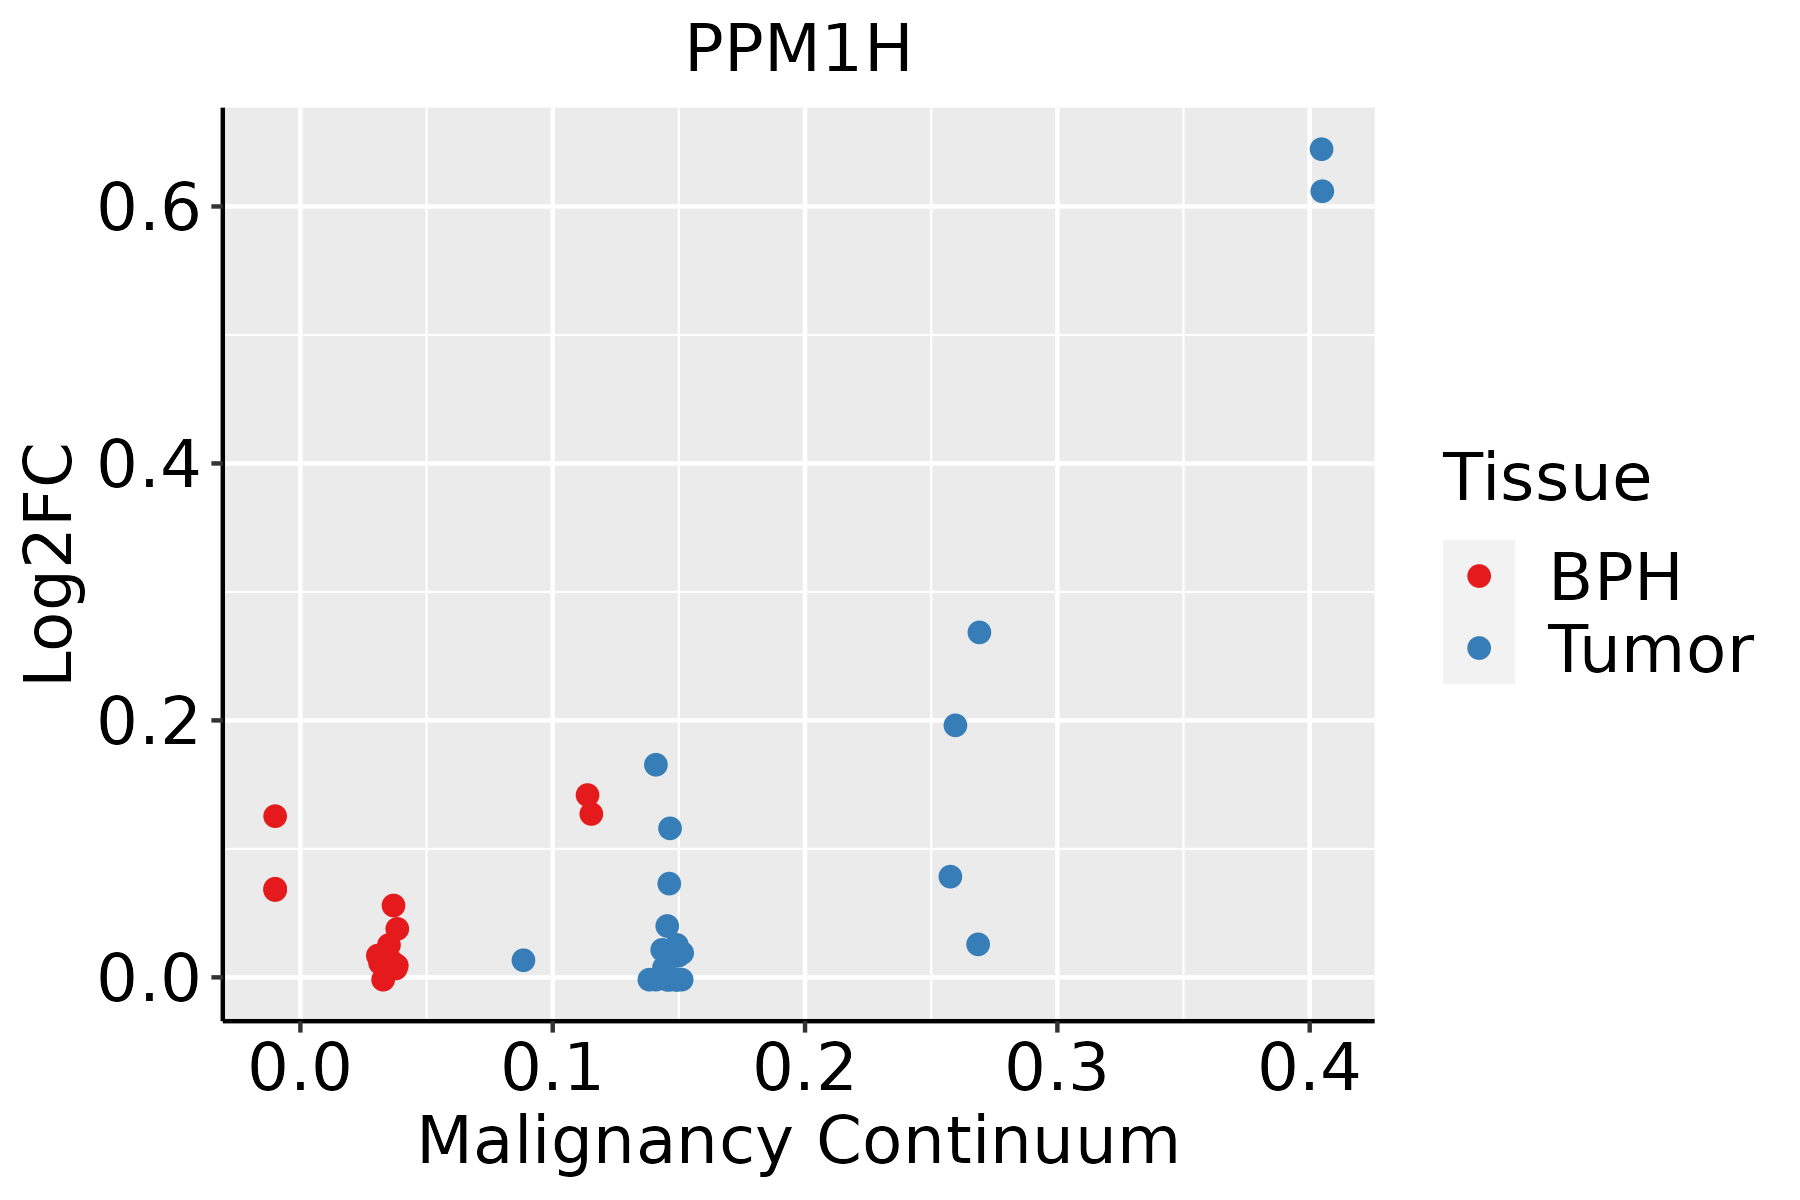 | BPH: Benign Prostatic Hyperplasia |
| ∗log2FC in expression of this searched gene in stem-like cells from each diseased tissue sample relative to stem-like cells in normal samples in each tissue plotted against the malignancy continuum. Samples are colored based on if they are from different disease stage. |
Top |
Malignant transformation related pathway analysis |
| Find out the enriched GO biological processes and KEGG pathways involved in transition from healthy to precancer to cancer |
| Tissue | Disease Stage | Enriched GO biological Processes |
| Colorectum | AD |  |
| Colorectum | SER |  |
| Colorectum | MSS |  |
| Colorectum | MSI-H |  |
| Colorectum | FAP |  |
| ∗Top 15 enriched GO BP terms are showed in the bar plot of each disease state in each tissue. Each row represents a significant GO biological process which is colored according to the -log10(p.adjust). |
| Page: 1 2 3 4 5 6 7 8 9 |
| GO ID | Tissue | Disease Stage | Description | Gene Ratio | Bg Ratio | pvalue | p.adjust | Count |
| GO:0016311 | Colorectum | AD | dephosphorylation | 123/3918 | 417/18723 | 1.84e-05 | 3.82e-04 | 123 |
| GO:0006470 | Colorectum | AD | protein dephosphorylation | 88/3918 | 281/18723 | 2.56e-05 | 4.89e-04 | 88 |
| GO:00064703 | Colorectum | MSI-H | protein dephosphorylation | 34/1319 | 281/18723 | 1.43e-03 | 2.22e-02 | 34 |
| GO:00163113 | Colorectum | FAP | dephosphorylation | 95/2622 | 417/18723 | 7.07e-07 | 3.32e-05 | 95 |
| GO:00064704 | Colorectum | FAP | protein dephosphorylation | 69/2622 | 281/18723 | 1.47e-06 | 6.39e-05 | 69 |
| GO:00163114 | Colorectum | CRC | dephosphorylation | 79/2078 | 417/18723 | 1.27e-06 | 7.21e-05 | 79 |
| GO:00064705 | Colorectum | CRC | protein dephosphorylation | 57/2078 | 281/18723 | 4.49e-06 | 1.87e-04 | 57 |
| GO:00064709 | Endometrium | AEH | protein dephosphorylation | 50/2100 | 281/18723 | 6.41e-04 | 6.23e-03 | 50 |
| GO:000647013 | Endometrium | EEC | protein dephosphorylation | 51/2168 | 281/18723 | 7.38e-04 | 7.01e-03 | 51 |
| GO:001631121 | Liver | HCC | dephosphorylation | 230/7958 | 417/18723 | 1.00e-07 | 1.96e-06 | 230 |
| GO:000647021 | Liver | HCC | protein dephosphorylation | 162/7958 | 281/18723 | 1.91e-07 | 3.46e-06 | 162 |
| GO:000647010 | Prostate | BPH | protein dephosphorylation | 78/3107 | 281/18723 | 1.53e-06 | 2.63e-05 | 78 |
| GO:00163118 | Prostate | BPH | dephosphorylation | 98/3107 | 417/18723 | 1.53e-04 | 1.35e-03 | 98 |
| GO:000647014 | Prostate | Tumor | protein dephosphorylation | 76/3246 | 281/18723 | 2.86e-05 | 3.46e-04 | 76 |
| GO:001631113 | Prostate | Tumor | dephosphorylation | 98/3246 | 417/18723 | 7.31e-04 | 5.08e-03 | 98 |
| Page: 1 |
| Pathway ID | Tissue | Disease Stage | Description | Gene Ratio | Bg Ratio | pvalue | p.adjust | qvalue | Count |
| Page: 1 |
Top |
Cell-cell communication analysis |
| Identification of potential cell-cell interactions between two cell types and their ligand-receptor pairs for different disease states |
| Ligand | Receptor | LRpair | Pathway | Tissue | Disease Stage |
| Page: 1 |
Top |
Single-cell gene regulatory network inference analysis |
| Find out the significant the regulons (TFs) and the target genes of each regulon across cell types for different disease states |
| TF | Cell Type | Tissue | Disease Stage | Target Gene | RSS | Regulon Activity |
| ∗The dot plots of a searched regulon are shown for all cell subpopulations in each disease state of each tissue based on the regulon specific score inferred using pySCENIC and by calculating the average expression. |
| Page: 1 |
Top |
Somatic mutation of malignant transformation related genes |
| Annotation of somatic variants for genes involved in malignant transformation |
| Hugo Symbol | Variant Class | Variant Classification | dbSNP RS | HGVSc | HGVSp | HGVSp Short | SWISSPROT | BIOTYPE | SIFT | PolyPhen | Tumor Sample Barcode | Tissue | Histology | Sex | Age | Stage | Therapy Types | Drugs | Outcome |
| PPM1H | SNV | Missense_Mutation | rs757417572 | c.1429C>T | p.Arg477Cys | p.R477C | Q9ULR3 | protein_coding | deleterious(0.04) | probably_damaging(0.953) | TCGA-A2-A0SV-01 | Breast | breast invasive carcinoma | Female | <65 | III/IV | Other, specify in notesBisphosphonate therapy | zometa | PD |
| PPM1H | SNV | Missense_Mutation | c.295G>A | p.Glu99Lys | p.E99K | Q9ULR3 | protein_coding | deleterious(0.03) | benign(0.443) | TCGA-D8-A1JA-01 | Breast | breast invasive carcinoma | Female | <65 | III/IV | Chemotherapy | adriamycin | PD | |
| PPM1H | SNV | Missense_Mutation | rs762157400 | c.1271A>G | p.Tyr424Cys | p.Y424C | Q9ULR3 | protein_coding | tolerated(0.06) | benign(0.049) | TCGA-D8-A1XB-01 | Breast | breast invasive carcinoma | Female | <65 | I/II | Unknown | Unknown | SD |
| PPM1H | SNV | Missense_Mutation | novel | c.1115T>A | p.Leu372His | p.L372H | Q9ULR3 | protein_coding | deleterious(0) | probably_damaging(1) | TCGA-LL-A7SZ-01 | Breast | breast invasive carcinoma | Female | <65 | I/II | Chemotherapy | adriamycin | CR |
| PPM1H | SNV | Missense_Mutation | novel | c.376N>T | p.Pro126Ser | p.P126S | Q9ULR3 | protein_coding | tolerated(0.12) | benign(0.165) | TCGA-2W-A8YY-01 | Cervix | cervical & endocervical cancer | Female | <65 | I/II | Chemotherapy | cisplatin | CR |
| PPM1H | SNV | Missense_Mutation | novel | c.1475N>G | p.Asp492Gly | p.D492G | Q9ULR3 | protein_coding | tolerated(0.13) | benign(0.012) | TCGA-EA-A410-01 | Cervix | cervical & endocervical cancer | Female | <65 | I/II | Unknown | Unknown | SD |
| PPM1H | SNV | Missense_Mutation | c.1394N>G | p.His465Arg | p.H465R | Q9ULR3 | protein_coding | tolerated(0.3) | benign(0.012) | TCGA-AA-3811-01 | Colorectum | colon adenocarcinoma | Female | >=65 | III/IV | Unknown | Unknown | PD | |
| PPM1H | SNV | Missense_Mutation | rs540042623 | c.1430N>A | p.Arg477His | p.R477H | Q9ULR3 | protein_coding | tolerated(0.28) | benign(0.187) | TCGA-AA-A01R-01 | Colorectum | colon adenocarcinoma | Male | <65 | III/IV | Chemotherapy | 5-fluorouracil | PD |
| PPM1H | SNV | Missense_Mutation | c.884N>T | p.Arg295Ile | p.R295I | Q9ULR3 | protein_coding | deleterious(0) | probably_damaging(0.936) | TCGA-CA-6717-01 | Colorectum | colon adenocarcinoma | Male | <65 | I/II | Chemotherapy | oxaliplatin | CR | |
| PPM1H | SNV | Missense_Mutation | c.322N>A | p.Gly108Arg | p.G108R | Q9ULR3 | protein_coding | tolerated(0.22) | benign(0.017) | TCGA-DM-A28A-01 | Colorectum | colon adenocarcinoma | Male | >=65 | III/IV | Unknown | Unknown | SD |
| Page: 1 2 3 4 5 6 |
Top |
Related drugs of malignant transformation related genes |
| Identification of chemicals and drugs interact with genes involved in malignant transfromation |
| (DGIdb 4.0) |
| Entrez ID | Symbol | Category | Interaction Types | Drug Claim Name | Drug Name | PMIDs |
| Page: 1 |

Copyright 2023-Present -The University of Texas Health Science Center at Houston |