
|
|||||
|
 | |
| |
| |
| |
| |
| |
|
Gene: PPM1G |
Gene summary for PPM1G |
| Gene information | Species | Human | Gene symbol | PPM1G | Gene ID | 5496 |
| Gene name | protein phosphatase, Mg2+/Mn2+ dependent 1G | |
| Gene Alias | PP2CG | |
| Cytomap | 2p23.3 | |
| Gene Type | protein-coding | GO ID | GO:0006464 | UniProtAcc | O15355 |
Top |
Malignant transformation analysis |
| Identification of the aberrant gene expression in precancerous and cancerous lesions by comparing the gene expression of stem-like cells in diseased tissues with normal stem cells |
| Entrez ID | Symbol | Replicates | Species | Organ | Tissue | Adj P-value | Log2FC | Malignancy |
| 5496 | PPM1G | HTA11_1938_2000001011 | Human | Colorectum | AD | 2.43e-02 | 3.54e-01 | -0.0811 |
| 5496 | PPM1G | HTA11_347_2000001011 | Human | Colorectum | AD | 2.08e-05 | 2.89e-01 | -0.1954 |
| 5496 | PPM1G | HTA11_83_2000001011 | Human | Colorectum | SER | 2.22e-02 | 3.64e-01 | -0.1526 |
| 5496 | PPM1G | HTA11_696_2000001011 | Human | Colorectum | AD | 5.26e-05 | 4.58e-01 | -0.1464 |
| 5496 | PPM1G | HTA11_1391_2000001011 | Human | Colorectum | AD | 9.64e-13 | 6.91e-01 | -0.059 |
| 5496 | PPM1G | HTA11_866_3004761011 | Human | Colorectum | AD | 6.64e-07 | 4.97e-01 | 0.096 |
| 5496 | PPM1G | HTA11_6801_2000001011 | Human | Colorectum | SER | 1.18e-02 | 7.06e-01 | 0.0171 |
| 5496 | PPM1G | HTA11_7696_3000711011 | Human | Colorectum | AD | 2.01e-12 | 6.40e-01 | 0.0674 |
| 5496 | PPM1G | HTA11_99999970781_79442 | Human | Colorectum | MSS | 1.59e-10 | 6.03e-01 | 0.294 |
| 5496 | PPM1G | HTA11_99999965062_69753 | Human | Colorectum | MSI-H | 1.66e-02 | 1.12e+00 | 0.3487 |
| 5496 | PPM1G | HTA11_99999965104_69814 | Human | Colorectum | MSS | 1.04e-03 | 4.52e-01 | 0.281 |
| 5496 | PPM1G | HTA11_99999971662_82457 | Human | Colorectum | MSS | 6.02e-15 | 8.30e-01 | 0.3859 |
| 5496 | PPM1G | HTA11_99999973899_84307 | Human | Colorectum | MSS | 5.45e-05 | 5.32e-01 | 0.2585 |
| 5496 | PPM1G | HTA11_99999974143_84620 | Human | Colorectum | MSS | 1.10e-09 | 5.33e-01 | 0.3005 |
| 5496 | PPM1G | A015-C-203 | Human | Colorectum | FAP | 7.21e-08 | -2.16e-01 | -0.1294 |
| 5496 | PPM1G | A001-C-108 | Human | Colorectum | FAP | 2.20e-03 | -9.42e-02 | -0.0272 |
| 5496 | PPM1G | A002-C-205 | Human | Colorectum | FAP | 1.08e-03 | -1.74e-01 | -0.1236 |
| 5496 | PPM1G | A015-C-104 | Human | Colorectum | FAP | 6.82e-08 | -1.18e-01 | -0.1899 |
| 5496 | PPM1G | A001-C-014 | Human | Colorectum | FAP | 6.36e-05 | -1.73e-01 | 0.0135 |
| 5496 | PPM1G | A002-C-016 | Human | Colorectum | FAP | 2.98e-05 | -1.34e-01 | 0.0521 |
| Page: 1 2 3 4 5 6 7 8 |
| Tissue | Expression Dynamics | Abbreviation |
| Colorectum (GSE201348) |  | FAP: Familial adenomatous polyposis |
| CRC: Colorectal cancer | ||
| Colorectum (HTA11) |  | AD: Adenomas |
| SER: Sessile serrated lesions | ||
| MSI-H: Microsatellite-high colorectal cancer | ||
| MSS: Microsatellite stable colorectal cancer | ||
| Esophagus |  | ESCC: Esophageal squamous cell carcinoma |
| HGIN: High-grade intraepithelial neoplasias | ||
| LGIN: Low-grade intraepithelial neoplasias | ||
| Liver | 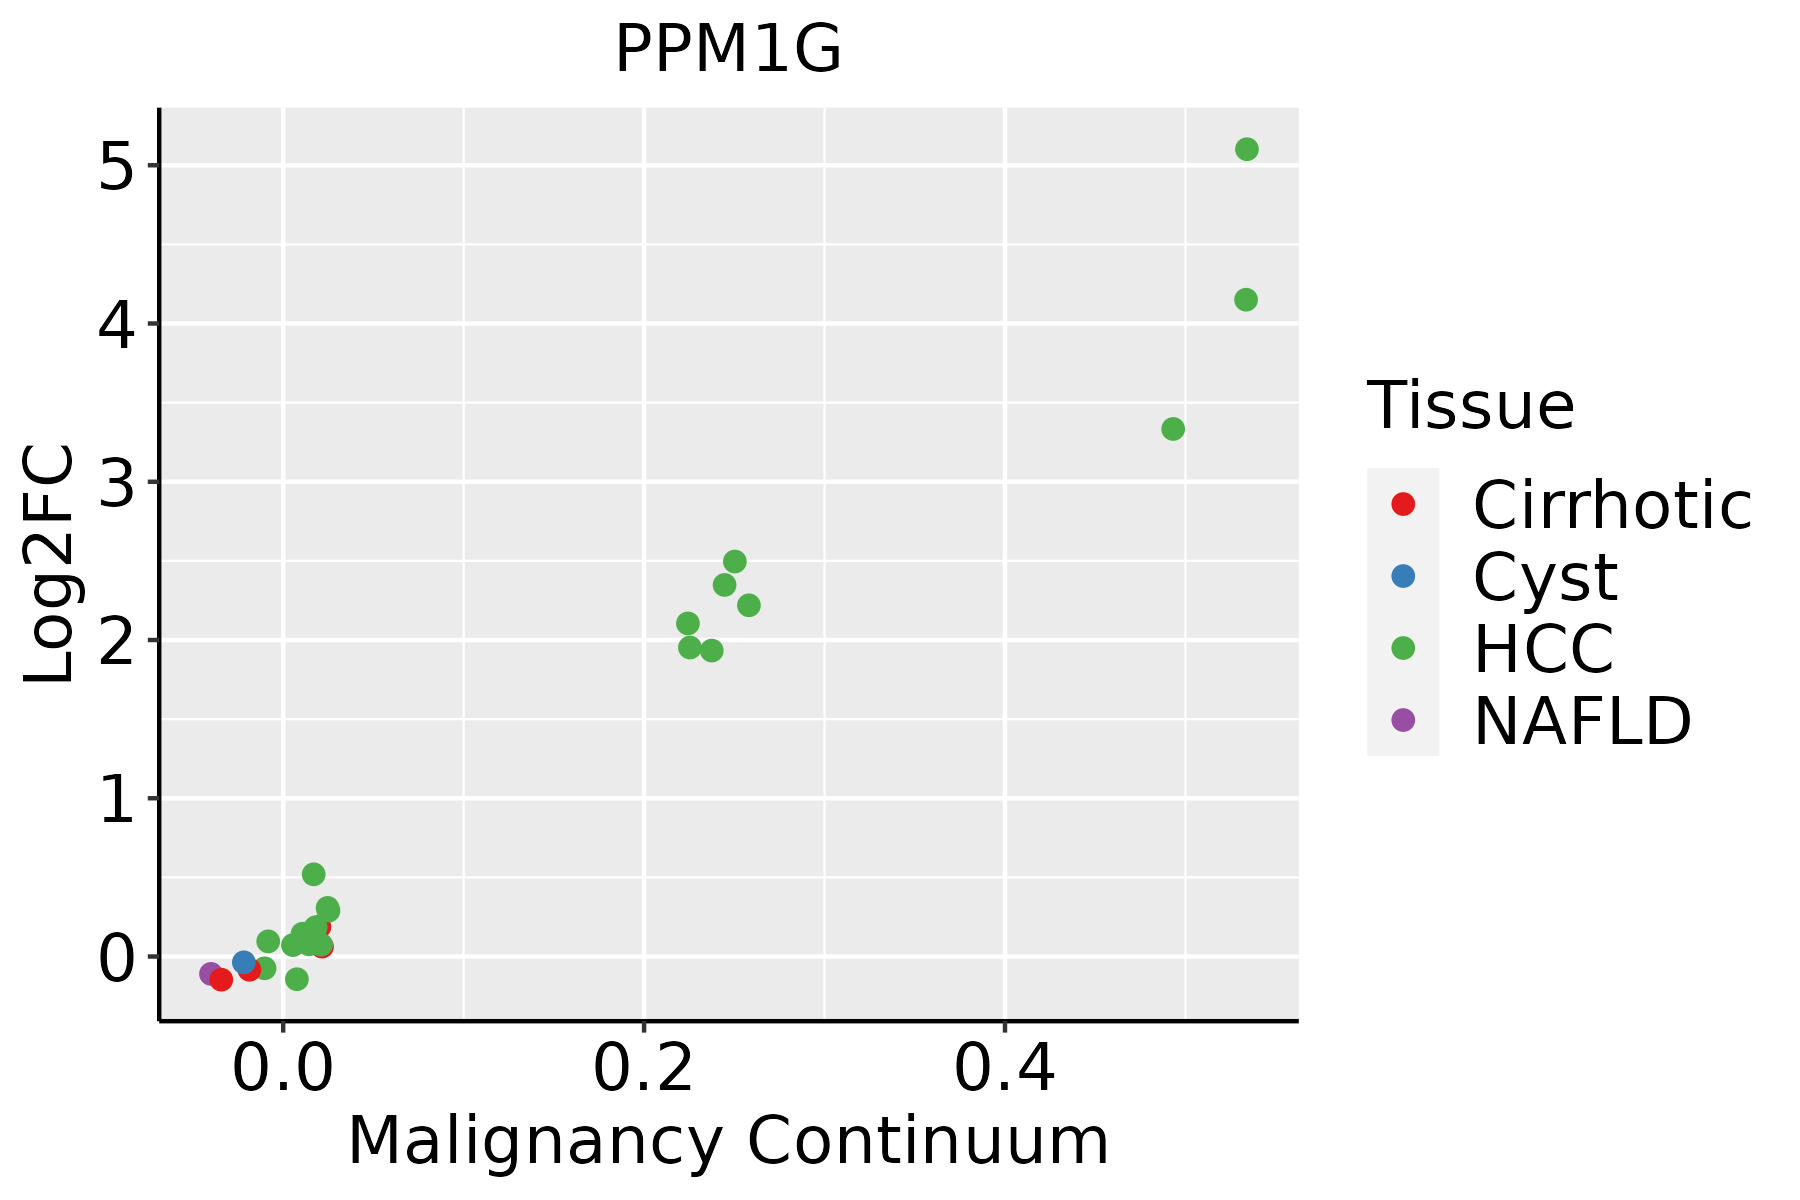 | HCC: Hepatocellular carcinoma |
| NAFLD: Non-alcoholic fatty liver disease | ||
| Oral Cavity |  | EOLP: Erosive Oral lichen planus |
| LP: leukoplakia | ||
| NEOLP: Non-erosive oral lichen planus | ||
| OSCC: Oral squamous cell carcinoma | ||
| Prostate | 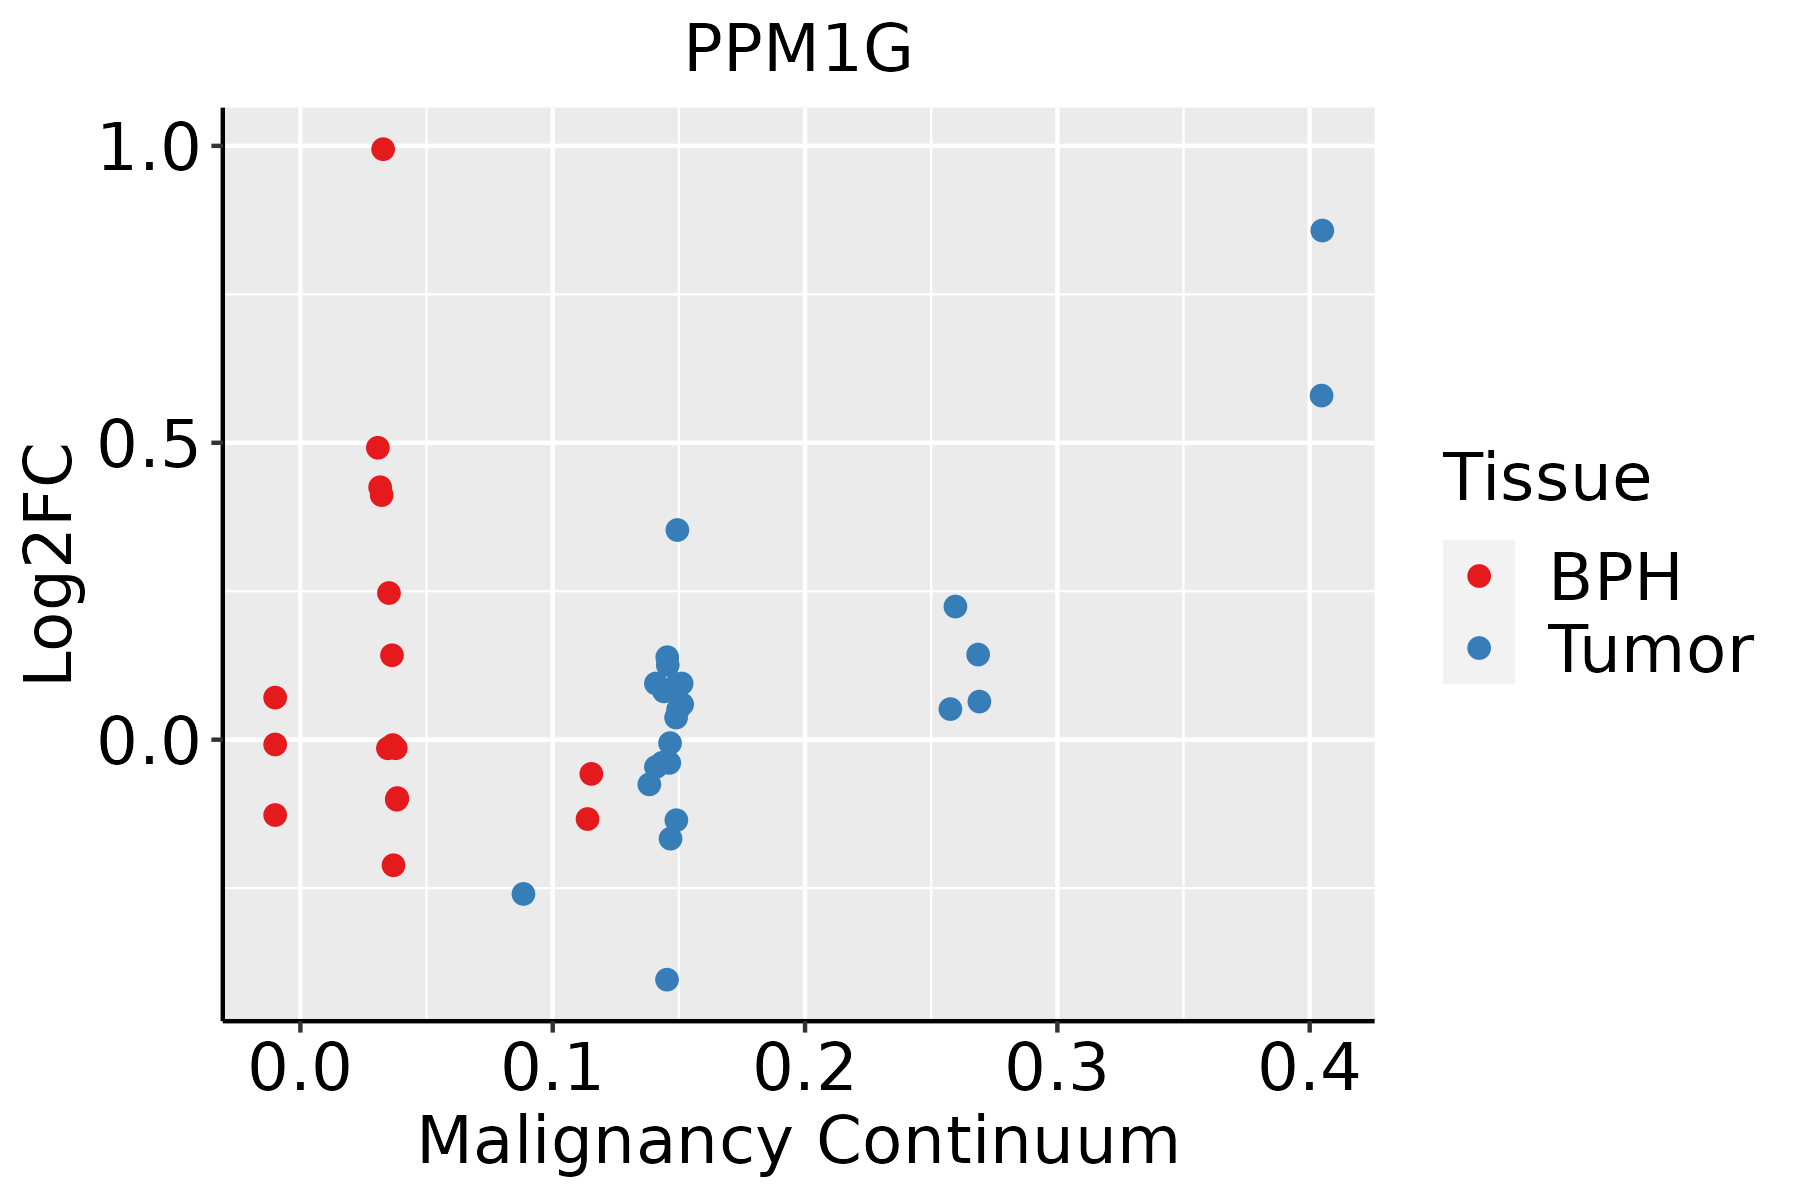 | BPH: Benign Prostatic Hyperplasia |
| Skin | 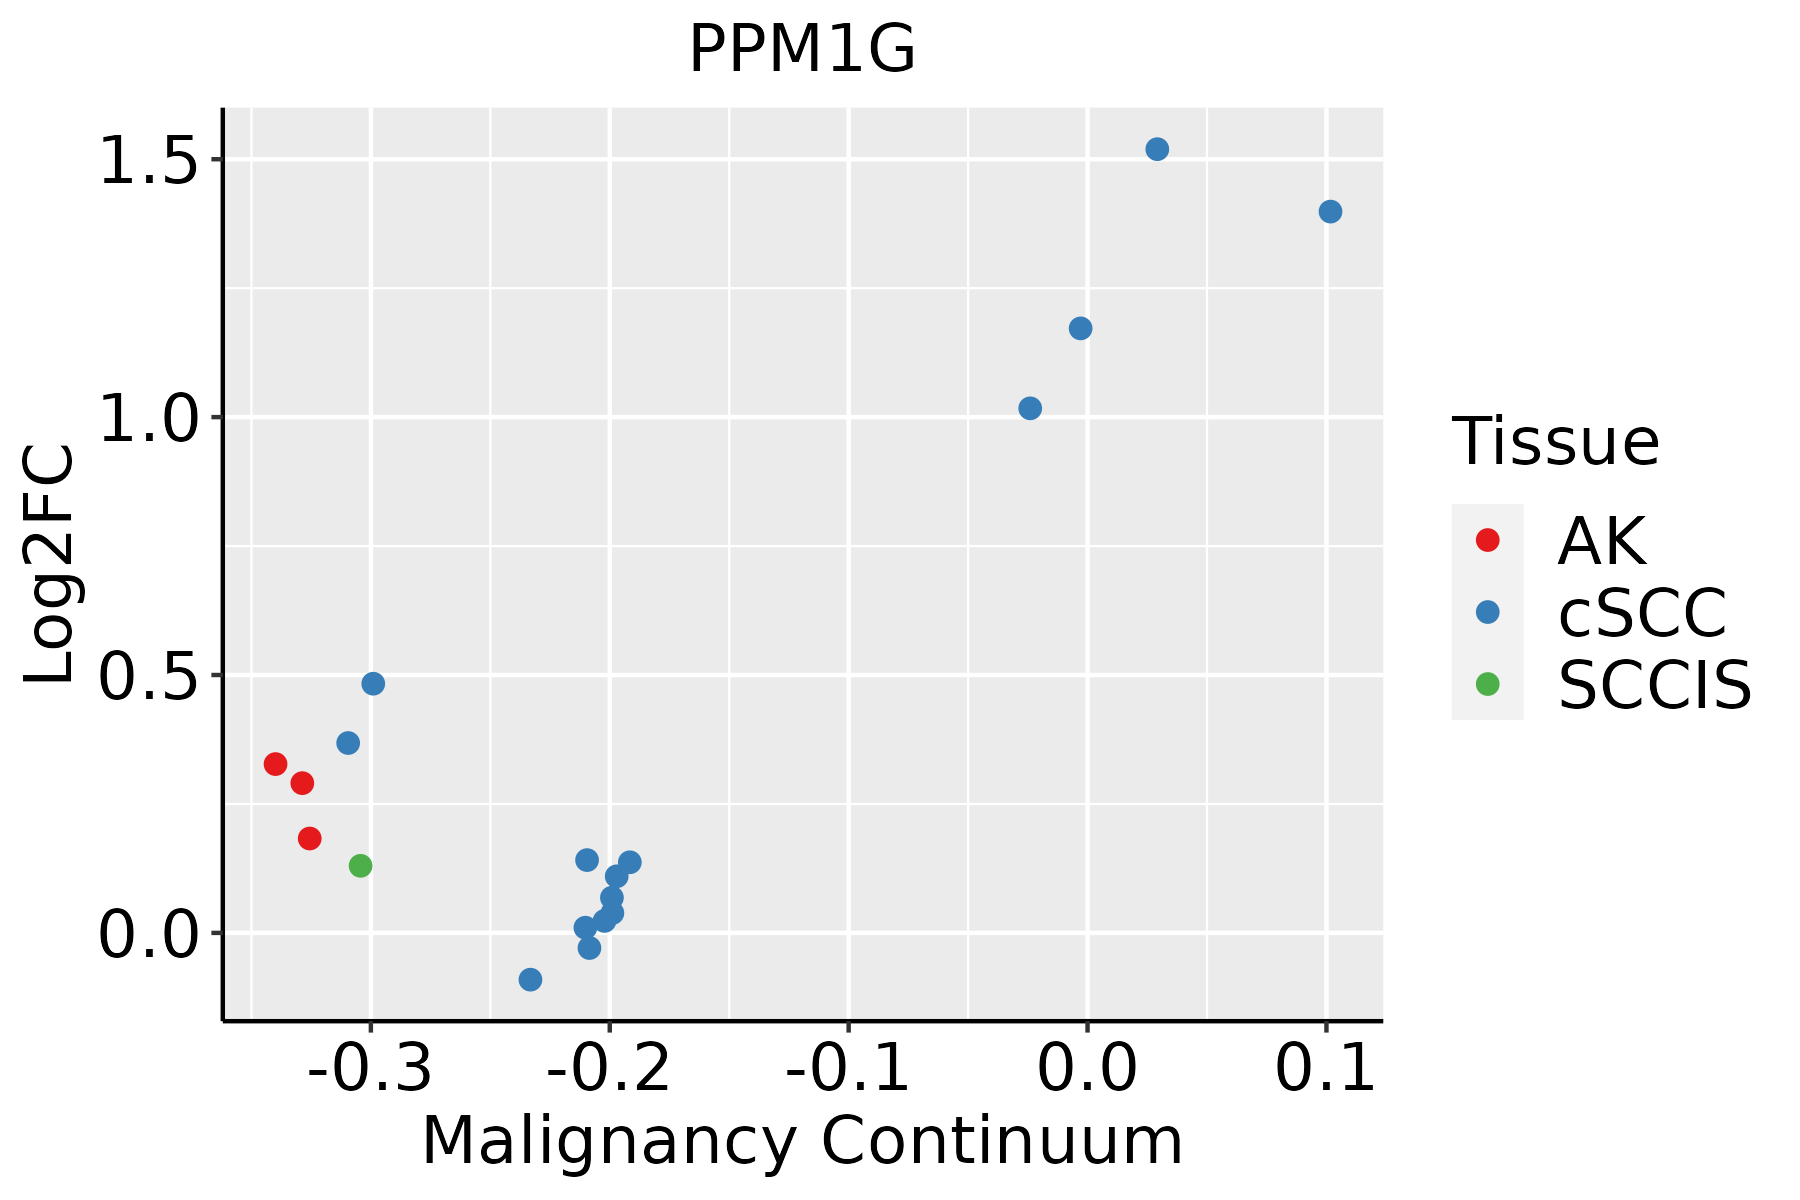 | AK: Actinic keratosis |
| cSCC: Cutaneous squamous cell carcinoma | ||
| SCCIS:squamous cell carcinoma in situ | ||
| Thyroid |  | ATC: Anaplastic thyroid cancer |
| HT: Hashimoto's thyroiditis | ||
| PTC: Papillary thyroid cancer |
| ∗log2FC in expression of this searched gene in stem-like cells from each diseased tissue sample relative to stem-like cells in normal samples in each tissue plotted against the malignancy continuum. Samples are colored based on if they are from different disease stage. |
Top |
Malignant transformation related pathway analysis |
| Find out the enriched GO biological processes and KEGG pathways involved in transition from healthy to precancer to cancer |
| Tissue | Disease Stage | Enriched GO biological Processes |
| Colorectum | AD |  |
| Colorectum | SER |  |
| Colorectum | MSS |  |
| Colorectum | MSI-H |  |
| Colorectum | FAP |  |
| ∗Top 15 enriched GO BP terms are showed in the bar plot of each disease state in each tissue. Each row represents a significant GO biological process which is colored according to the -log10(p.adjust). |
| Page: 1 2 3 4 5 6 7 8 9 |
| GO ID | Tissue | Disease Stage | Description | Gene Ratio | Bg Ratio | pvalue | p.adjust | Count |
| GO:0016311 | Colorectum | AD | dephosphorylation | 123/3918 | 417/18723 | 1.84e-05 | 3.82e-04 | 123 |
| GO:0006470 | Colorectum | AD | protein dephosphorylation | 88/3918 | 281/18723 | 2.56e-05 | 4.89e-04 | 88 |
| GO:00064701 | Colorectum | SER | protein dephosphorylation | 65/2897 | 281/18723 | 4.44e-04 | 6.51e-03 | 65 |
| GO:00163111 | Colorectum | SER | dephosphorylation | 86/2897 | 417/18723 | 2.73e-03 | 2.46e-02 | 86 |
| GO:00064702 | Colorectum | MSS | protein dephosphorylation | 73/3467 | 281/18723 | 1.15e-03 | 1.12e-02 | 73 |
| GO:00163112 | Colorectum | MSS | dephosphorylation | 101/3467 | 417/18723 | 1.98e-03 | 1.70e-02 | 101 |
| GO:00064703 | Colorectum | MSI-H | protein dephosphorylation | 34/1319 | 281/18723 | 1.43e-03 | 2.22e-02 | 34 |
| GO:00163113 | Colorectum | FAP | dephosphorylation | 95/2622 | 417/18723 | 7.07e-07 | 3.32e-05 | 95 |
| GO:00064704 | Colorectum | FAP | protein dephosphorylation | 69/2622 | 281/18723 | 1.47e-06 | 6.39e-05 | 69 |
| GO:000647017 | Esophagus | HGIN | protein dephosphorylation | 61/2587 | 281/18723 | 1.86e-04 | 3.51e-03 | 61 |
| GO:001631110 | Esophagus | ESCC | dephosphorylation | 251/8552 | 417/18723 | 1.26e-09 | 2.99e-08 | 251 |
| GO:000647018 | Esophagus | ESCC | protein dephosphorylation | 177/8552 | 281/18723 | 3.13e-09 | 6.72e-08 | 177 |
| GO:00359703 | Esophagus | ESCC | peptidyl-threonine dephosphorylation | 13/8552 | 16/18723 | 4.05e-03 | 1.62e-02 | 13 |
| GO:000647011 | Liver | Cirrhotic | protein dephosphorylation | 96/4634 | 281/18723 | 2.32e-04 | 2.11e-03 | 96 |
| GO:001631111 | Liver | Cirrhotic | dephosphorylation | 130/4634 | 417/18723 | 1.58e-03 | 1.03e-02 | 130 |
| GO:0035970 | Liver | Cirrhotic | peptidyl-threonine dephosphorylation | 9/4634 | 16/18723 | 6.94e-03 | 3.38e-02 | 9 |
| GO:001631121 | Liver | HCC | dephosphorylation | 230/7958 | 417/18723 | 1.00e-07 | 1.96e-06 | 230 |
| GO:000647021 | Liver | HCC | protein dephosphorylation | 162/7958 | 281/18723 | 1.91e-07 | 3.46e-06 | 162 |
| GO:00359701 | Liver | HCC | peptidyl-threonine dephosphorylation | 13/7958 | 16/18723 | 1.84e-03 | 9.42e-03 | 13 |
| GO:000647015 | Oral cavity | OSCC | protein dephosphorylation | 162/7305 | 281/18723 | 1.56e-10 | 4.56e-09 | 162 |
| Page: 1 2 |
| Pathway ID | Tissue | Disease Stage | Description | Gene Ratio | Bg Ratio | pvalue | p.adjust | qvalue | Count |
| Page: 1 |
Top |
Cell-cell communication analysis |
| Identification of potential cell-cell interactions between two cell types and their ligand-receptor pairs for different disease states |
| Ligand | Receptor | LRpair | Pathway | Tissue | Disease Stage |
| Page: 1 |
Top |
Single-cell gene regulatory network inference analysis |
| Find out the significant the regulons (TFs) and the target genes of each regulon across cell types for different disease states |
| TF | Cell Type | Tissue | Disease Stage | Target Gene | RSS | Regulon Activity |
| ∗The dot plots of a searched regulon are shown for all cell subpopulations in each disease state of each tissue based on the regulon specific score inferred using pySCENIC and by calculating the average expression. |
| Page: 1 |
Top |
Somatic mutation of malignant transformation related genes |
| Annotation of somatic variants for genes involved in malignant transformation |
| Hugo Symbol | Variant Class | Variant Classification | dbSNP RS | HGVSc | HGVSp | HGVSp Short | SWISSPROT | BIOTYPE | SIFT | PolyPhen | Tumor Sample Barcode | Tissue | Histology | Sex | Age | Stage | Therapy Types | Drugs | Outcome |
| PPM1G | SNV | Missense_Mutation | c.776N>G | p.Asp259Gly | p.D259G | O15355 | protein_coding | deleterious(0.01) | benign(0.221) | TCGA-A8-A09Z-01 | Breast | breast invasive carcinoma | Female | >=65 | I/II | Unknown | Unknown | SD | |
| PPM1G | SNV | Missense_Mutation | c.1127N>A | p.Arg376His | p.R376H | O15355 | protein_coding | deleterious(0) | probably_damaging(0.997) | TCGA-AN-A0AK-01 | Breast | breast invasive carcinoma | Female | >=65 | I/II | Unknown | Unknown | SD | |
| PPM1G | SNV | Missense_Mutation | c.1494N>A | p.Met498Ile | p.M498I | O15355 | protein_coding | deleterious(0.01) | benign(0.022) | TCGA-DS-A1OC-01 | Cervix | cervical & endocervical cancer | Female | <65 | I/II | Chemotherapy | gemcitabine | SD | |
| PPM1G | SNV | Missense_Mutation | c.594N>C | p.Glu198Asp | p.E198D | O15355 | protein_coding | tolerated(0.34) | benign(0.046) | TCGA-FU-A40J-01 | Cervix | cervical & endocervical cancer | Female | <65 | III/IV | Chemotherapy | carboplatin | CR | |
| PPM1G | SNV | Missense_Mutation | c.772N>C | p.Glu258Gln | p.E258Q | O15355 | protein_coding | deleterious(0.02) | benign(0.362) | TCGA-Q1-A73O-01 | Cervix | cervical & endocervical cancer | Female | <65 | I/II | Chemotherapy | cisplatin | CR | |
| PPM1G | SNV | Missense_Mutation | novel | c.909N>T | p.Glu303Asp | p.E303D | O15355 | protein_coding | tolerated(0.98) | probably_damaging(0.973) | TCGA-CA-6717-01 | Colorectum | colon adenocarcinoma | Male | <65 | I/II | Chemotherapy | oxaliplatin | CR |
| PPM1G | SNV | Missense_Mutation | novel | c.809N>C | p.Glu270Ala | p.E270A | O15355 | protein_coding | tolerated(0.29) | possibly_damaging(0.685) | TCGA-A5-A0G2-01 | Endometrium | uterine corpus endometrioid carcinoma | Female | <65 | III/IV | Unknown | Unknown | SD |
| PPM1G | SNV | Missense_Mutation | novel | c.532N>T | p.Gly178Cys | p.G178C | O15355 | protein_coding | deleterious(0.02) | probably_damaging(0.956) | TCGA-A5-A0G2-01 | Endometrium | uterine corpus endometrioid carcinoma | Female | <65 | III/IV | Unknown | Unknown | SD |
| PPM1G | SNV | Missense_Mutation | c.1559N>A | p.Arg520Gln | p.R520Q | O15355 | protein_coding | deleterious_low_confidence(0.03) | benign(0.098) | TCGA-A5-A2K5-01 | Endometrium | uterine corpus endometrioid carcinoma | Female | >=65 | I/II | Unknown | Unknown | SD | |
| PPM1G | SNV | Missense_Mutation | c.475N>T | p.Arg159Cys | p.R159C | O15355 | protein_coding | deleterious(0) | probably_damaging(0.99) | TCGA-AJ-A3BG-01 | Endometrium | uterine corpus endometrioid carcinoma | Female | >=65 | I/II | Chemotherapy | carboplatin | PD |
| Page: 1 2 3 4 5 |
Top |
Related drugs of malignant transformation related genes |
| Identification of chemicals and drugs interact with genes involved in malignant transfromation |
| (DGIdb 4.0) |
| Entrez ID | Symbol | Category | Interaction Types | Drug Claim Name | Drug Name | PMIDs |
| Page: 1 |

Copyright 2023-Present -The University of Texas Health Science Center at Houston |