
|
|||||
|
 | |
| |
| |
| |
| |
| |
|
Gene: PPM1F |
Gene summary for PPM1F |
| Gene information | Species | Human | Gene symbol | PPM1F | Gene ID | 9647 |
| Gene name | protein phosphatase, Mg2+/Mn2+ dependent 1F | |
| Gene Alias | CAMKP | |
| Cytomap | 22q11.22 | |
| Gene Type | protein-coding | GO ID | GO:0001667 | UniProtAcc | P49593 |
Top |
Malignant transformation analysis |
| Identification of the aberrant gene expression in precancerous and cancerous lesions by comparing the gene expression of stem-like cells in diseased tissues with normal stem cells |
| Entrez ID | Symbol | Replicates | Species | Organ | Tissue | Adj P-value | Log2FC | Malignancy |
| 9647 | PPM1F | LZE24T | Human | Esophagus | ESCC | 7.58e-03 | 3.91e-02 | 0.0596 |
| 9647 | PPM1F | P2T-E | Human | Esophagus | ESCC | 6.25e-03 | 6.52e-02 | 0.1177 |
| 9647 | PPM1F | P4T-E | Human | Esophagus | ESCC | 3.44e-07 | 7.68e-02 | 0.1323 |
| 9647 | PPM1F | P8T-E | Human | Esophagus | ESCC | 2.93e-09 | 3.06e-02 | 0.0889 |
| 9647 | PPM1F | P9T-E | Human | Esophagus | ESCC | 1.84e-14 | 1.43e-01 | 0.1131 |
| 9647 | PPM1F | P10T-E | Human | Esophagus | ESCC | 1.76e-08 | 7.72e-02 | 0.116 |
| 9647 | PPM1F | P12T-E | Human | Esophagus | ESCC | 8.82e-08 | 4.67e-02 | 0.1122 |
| 9647 | PPM1F | P15T-E | Human | Esophagus | ESCC | 4.55e-10 | 8.79e-02 | 0.1149 |
| 9647 | PPM1F | P16T-E | Human | Esophagus | ESCC | 1.19e-12 | 1.83e-01 | 0.1153 |
| 9647 | PPM1F | P17T-E | Human | Esophagus | ESCC | 2.79e-03 | 1.54e-01 | 0.1278 |
| 9647 | PPM1F | P20T-E | Human | Esophagus | ESCC | 1.57e-03 | 8.12e-02 | 0.1124 |
| 9647 | PPM1F | P21T-E | Human | Esophagus | ESCC | 5.03e-10 | 1.11e-01 | 0.1617 |
| 9647 | PPM1F | P22T-E | Human | Esophagus | ESCC | 1.24e-04 | 5.84e-02 | 0.1236 |
| 9647 | PPM1F | P23T-E | Human | Esophagus | ESCC | 2.28e-15 | 1.62e-01 | 0.108 |
| 9647 | PPM1F | P24T-E | Human | Esophagus | ESCC | 5.19e-05 | 6.35e-02 | 0.1287 |
| 9647 | PPM1F | P26T-E | Human | Esophagus | ESCC | 1.60e-18 | 1.47e-01 | 0.1276 |
| 9647 | PPM1F | P27T-E | Human | Esophagus | ESCC | 1.05e-02 | 5.95e-02 | 0.1055 |
| 9647 | PPM1F | P28T-E | Human | Esophagus | ESCC | 2.43e-06 | 8.34e-02 | 0.1149 |
| 9647 | PPM1F | P30T-E | Human | Esophagus | ESCC | 2.09e-15 | 5.68e-01 | 0.137 |
| 9647 | PPM1F | P31T-E | Human | Esophagus | ESCC | 4.86e-06 | 3.94e-02 | 0.1251 |
| Page: 1 2 3 |
| Tissue | Expression Dynamics | Abbreviation |
| Esophagus | 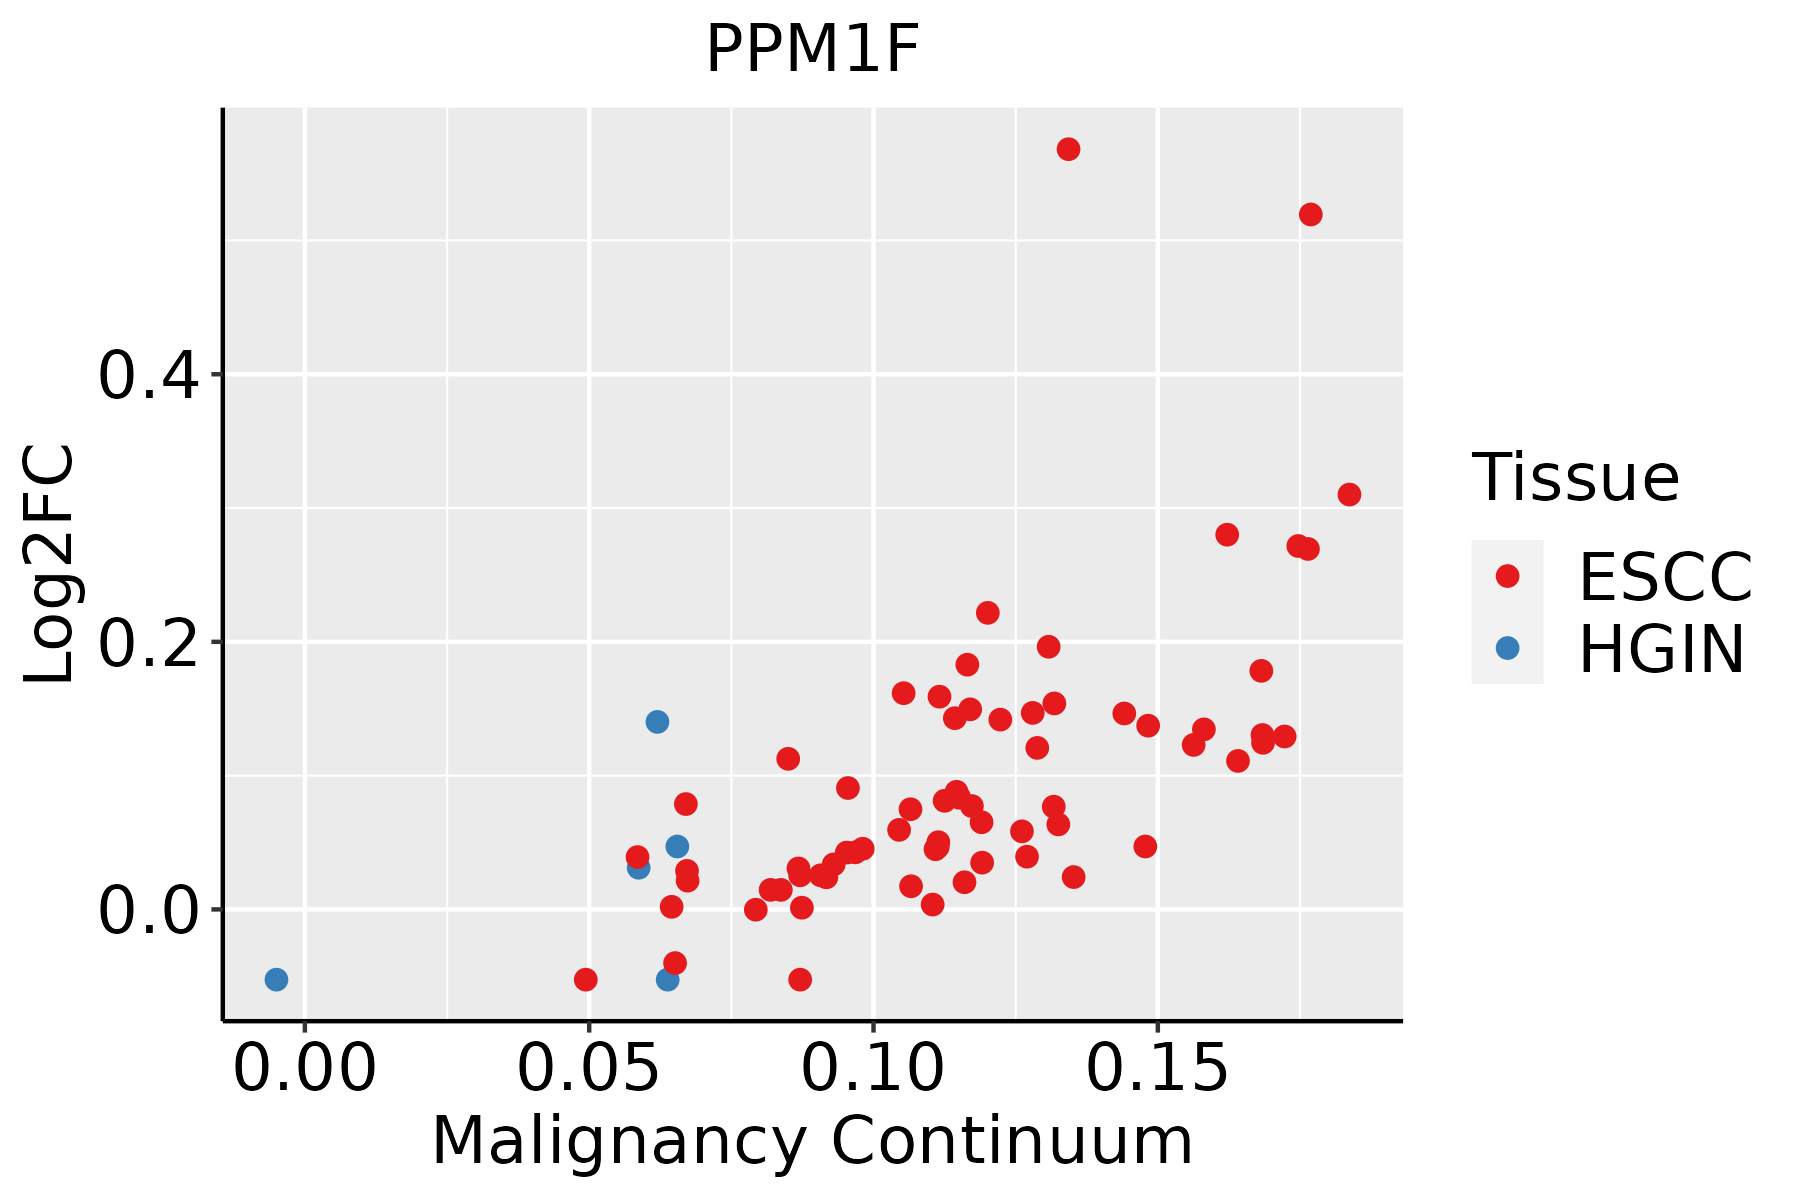 | ESCC: Esophageal squamous cell carcinoma |
| HGIN: High-grade intraepithelial neoplasias | ||
| LGIN: Low-grade intraepithelial neoplasias | ||
| Oral Cavity |  | EOLP: Erosive Oral lichen planus |
| LP: leukoplakia | ||
| NEOLP: Non-erosive oral lichen planus | ||
| OSCC: Oral squamous cell carcinoma |
| ∗log2FC in expression of this searched gene in stem-like cells from each diseased tissue sample relative to stem-like cells in normal samples in each tissue plotted against the malignancy continuum. Samples are colored based on if they are from different disease stage. |
Top |
Malignant transformation related pathway analysis |
| Find out the enriched GO biological processes and KEGG pathways involved in transition from healthy to precancer to cancer |
| Tissue | Disease Stage | Enriched GO biological Processes |
| Colorectum | AD |  |
| Colorectum | SER |  |
| Colorectum | MSS |  |
| Colorectum | MSI-H |  |
| Colorectum | FAP |  |
| ∗Top 15 enriched GO BP terms are showed in the bar plot of each disease state in each tissue. Each row represents a significant GO biological process which is colored according to the -log10(p.adjust). |
| Page: 1 2 3 4 5 6 7 8 9 |
| GO ID | Tissue | Disease Stage | Description | Gene Ratio | Bg Ratio | pvalue | p.adjust | Count |
| GO:0097193111 | Esophagus | ESCC | intrinsic apoptotic signaling pathway | 222/8552 | 288/18723 | 5.87e-28 | 2.02e-25 | 222 |
| GO:001657015 | Esophagus | ESCC | histone modification | 323/8552 | 463/18723 | 2.61e-26 | 7.88e-24 | 323 |
| GO:0045862111 | Esophagus | ESCC | positive regulation of proteolysis | 256/8552 | 372/18723 | 7.88e-20 | 9.43e-18 | 256 |
| GO:0010563111 | Esophagus | ESCC | negative regulation of phosphorus metabolic process | 274/8552 | 442/18723 | 2.32e-12 | 9.41e-11 | 274 |
| GO:0045936111 | Esophagus | ESCC | negative regulation of phosphate metabolic process | 273/8552 | 441/18723 | 3.18e-12 | 1.25e-10 | 273 |
| GO:0051348111 | Esophagus | ESCC | negative regulation of transferase activity | 177/8552 | 268/18723 | 1.08e-11 | 4.00e-10 | 177 |
| GO:2000116111 | Esophagus | ESCC | regulation of cysteine-type endopeptidase activity | 158/8552 | 235/18723 | 1.67e-11 | 5.90e-10 | 158 |
| GO:0043281111 | Esophagus | ESCC | regulation of cysteine-type endopeptidase activity involved in apoptotic process | 143/8552 | 209/18723 | 2.12e-11 | 7.31e-10 | 143 |
| GO:1902905111 | Esophagus | ESCC | positive regulation of supramolecular fiber organization | 142/8552 | 209/18723 | 5.51e-11 | 1.76e-09 | 142 |
| GO:1902903111 | Esophagus | ESCC | regulation of supramolecular fiber organization | 237/8552 | 383/18723 | 9.06e-11 | 2.75e-09 | 237 |
| GO:0042326111 | Esophagus | ESCC | negative regulation of phosphorylation | 237/8552 | 385/18723 | 1.86e-10 | 5.33e-09 | 237 |
| GO:0150115110 | Esophagus | ESCC | cell-substrate junction organization | 77/8552 | 101/18723 | 3.46e-10 | 9.57e-09 | 77 |
| GO:0001933111 | Esophagus | ESCC | negative regulation of protein phosphorylation | 213/8552 | 342/18723 | 3.54e-10 | 9.76e-09 | 213 |
| GO:0010952111 | Esophagus | ESCC | positive regulation of peptidase activity | 133/8552 | 197/18723 | 4.31e-10 | 1.14e-08 | 133 |
| GO:000704418 | Esophagus | ESCC | cell-substrate junction assembly | 73/8552 | 95/18723 | 5.27e-10 | 1.35e-08 | 73 |
| GO:0052547111 | Esophagus | ESCC | regulation of peptidase activity | 275/8552 | 461/18723 | 7.54e-10 | 1.88e-08 | 275 |
| GO:001631110 | Esophagus | ESCC | dephosphorylation | 251/8552 | 417/18723 | 1.26e-09 | 2.99e-08 | 251 |
| GO:003367319 | Esophagus | ESCC | negative regulation of kinase activity | 154/8552 | 237/18723 | 1.38e-09 | 3.27e-08 | 154 |
| GO:000646920 | Esophagus | ESCC | negative regulation of protein kinase activity | 140/8552 | 212/18723 | 1.53e-09 | 3.56e-08 | 140 |
| GO:005149520 | Esophagus | ESCC | positive regulation of cytoskeleton organization | 147/8552 | 226/18723 | 2.93e-09 | 6.38e-08 | 147 |
| Page: 1 2 3 4 5 6 7 |
| Pathway ID | Tissue | Disease Stage | Description | Gene Ratio | Bg Ratio | pvalue | p.adjust | qvalue | Count |
| Page: 1 |
Top |
Cell-cell communication analysis |
| Identification of potential cell-cell interactions between two cell types and their ligand-receptor pairs for different disease states |
| Ligand | Receptor | LRpair | Pathway | Tissue | Disease Stage |
| Page: 1 |
Top |
Single-cell gene regulatory network inference analysis |
| Find out the significant the regulons (TFs) and the target genes of each regulon across cell types for different disease states |
| TF | Cell Type | Tissue | Disease Stage | Target Gene | RSS | Regulon Activity |
| ∗The dot plots of a searched regulon are shown for all cell subpopulations in each disease state of each tissue based on the regulon specific score inferred using pySCENIC and by calculating the average expression. |
| Page: 1 |
Top |
Somatic mutation of malignant transformation related genes |
| Annotation of somatic variants for genes involved in malignant transformation |
| Hugo Symbol | Variant Class | Variant Classification | dbSNP RS | HGVSc | HGVSp | HGVSp Short | SWISSPROT | BIOTYPE | SIFT | PolyPhen | Tumor Sample Barcode | Tissue | Histology | Sex | Age | Stage | Therapy Types | Drugs | Outcome |
| PPM1F | SNV | Missense_Mutation | novel | c.686N>T | p.Gly229Val | p.G229V | P49593 | protein_coding | tolerated(0.15) | benign(0.158) | TCGA-A2-A0YK-01 | Breast | breast invasive carcinoma | Female | <65 | I/II | Chemotherapy | cytoxan | SD |
| PPM1F | SNV | Missense_Mutation | c.1055N>G | p.Glu352Gly | p.E352G | P49593 | protein_coding | deleterious(0) | probably_damaging(0.995) | TCGA-A8-A09Z-01 | Breast | breast invasive carcinoma | Female | >=65 | I/II | Unknown | Unknown | SD | |
| PPM1F | SNV | Missense_Mutation | novel | c.1024G>A | p.Asp342Asn | p.D342N | P49593 | protein_coding | deleterious(0) | probably_damaging(0.997) | TCGA-AR-A2LH-01 | Breast | breast invasive carcinoma | Female | <65 | III/IV | Chemotherapy | adriamycin | PD |
| PPM1F | SNV | Missense_Mutation | c.661N>T | p.Pro221Ser | p.P221S | P49593 | protein_coding | tolerated(0.35) | possibly_damaging(0.472) | TCGA-BH-A18G-01 | Breast | breast invasive carcinoma | Female | >=65 | I/II | Unknown | Unknown | SD | |
| PPM1F | SNV | Missense_Mutation | c.1267N>A | p.Gly423Arg | p.G423R | P49593 | protein_coding | tolerated(0.3) | benign(0) | TCGA-BH-A202-01 | Breast | breast invasive carcinoma | Female | <65 | I/II | Chemotherapy | carboplatin | CR | |
| PPM1F | insertion | Nonsense_Mutation | novel | c.221_222insCCATGGTTAGATGCTGGTGGAAGCTTGTCTG | p.Leu75HisfsTer3 | p.L75Hfs*3 | P49593 | protein_coding | TCGA-BH-A0E7-01 | Breast | breast invasive carcinoma | Female | >=65 | I/II | Hormone Therapy | arimidex | SD | ||
| PPM1F | SNV | Missense_Mutation | rs550518307 | c.409N>A | p.Ala137Thr | p.A137T | P49593 | protein_coding | deleterious(0.02) | benign(0.019) | TCGA-2W-A8YY-01 | Cervix | cervical & endocervical cancer | Female | <65 | I/II | Chemotherapy | cisplatin | CR |
| PPM1F | SNV | Missense_Mutation | novel | c.1090N>A | p.Asp364Asn | p.D364N | P49593 | protein_coding | deleterious(0) | probably_damaging(0.999) | TCGA-DG-A2KM-01 | Cervix | cervical & endocervical cancer | Female | <65 | I/II | Chemotherapy | cisplatin | SD |
| PPM1F | SNV | Missense_Mutation | rs549205418 | c.905N>A | p.Arg302His | p.R302H | P49593 | protein_coding | deleterious(0) | probably_damaging(0.997) | TCGA-EX-A69M-01 | Cervix | cervical & endocervical cancer | Female | <65 | I/II | Unknown | Unknown | PD |
| PPM1F | SNV | Missense_Mutation | novel | c.1261N>C | p.Glu421Gln | p.E421Q | P49593 | protein_coding | tolerated(0.06) | benign(0.116) | TCGA-HM-A4S6-01 | Cervix | cervical & endocervical cancer | Female | <65 | III/IV | Chemotherapy | cisplatin | CR |
| Page: 1 2 3 4 5 |
Top |
Related drugs of malignant transformation related genes |
| Identification of chemicals and drugs interact with genes involved in malignant transfromation |
| (DGIdb 4.0) |
| Entrez ID | Symbol | Category | Interaction Types | Drug Claim Name | Drug Name | PMIDs |
| Page: 1 |

Copyright 2023-Present -The University of Texas Health Science Center at Houston |