
|
|||||
|
 | |
| |
| |
| |
| |
| |
|
Gene: PPM1B |
Gene summary for PPM1B |
| Gene information | Species | Human | Gene symbol | PPM1B | Gene ID | 5495 |
| Gene name | protein phosphatase, Mg2+/Mn2+ dependent 1B | |
| Gene Alias | PP2C-beta | |
| Cytomap | 2p21 | |
| Gene Type | protein-coding | GO ID | GO:0001816 | UniProtAcc | O75688 |
Top |
Malignant transformation analysis |
| Identification of the aberrant gene expression in precancerous and cancerous lesions by comparing the gene expression of stem-like cells in diseased tissues with normal stem cells |
| Entrez ID | Symbol | Replicates | Species | Organ | Tissue | Adj P-value | Log2FC | Malignancy |
| 5495 | PPM1B | LZE4T | Human | Esophagus | ESCC | 1.45e-09 | 3.16e-01 | 0.0811 |
| 5495 | PPM1B | LZE7T | Human | Esophagus | ESCC | 3.13e-03 | 3.97e-01 | 0.0667 |
| 5495 | PPM1B | LZE8T | Human | Esophagus | ESCC | 1.65e-02 | -3.37e-02 | 0.067 |
| 5495 | PPM1B | LZE20T | Human | Esophagus | ESCC | 5.64e-08 | 1.98e-02 | 0.0662 |
| 5495 | PPM1B | LZE24T | Human | Esophagus | ESCC | 2.30e-17 | 4.57e-01 | 0.0596 |
| 5495 | PPM1B | LZE21T | Human | Esophagus | ESCC | 4.04e-07 | 3.42e-01 | 0.0655 |
| 5495 | PPM1B | P1T-E | Human | Esophagus | ESCC | 1.82e-12 | 4.33e-01 | 0.0875 |
| 5495 | PPM1B | P2T-E | Human | Esophagus | ESCC | 4.31e-36 | 6.57e-01 | 0.1177 |
| 5495 | PPM1B | P4T-E | Human | Esophagus | ESCC | 2.38e-17 | 5.52e-01 | 0.1323 |
| 5495 | PPM1B | P5T-E | Human | Esophagus | ESCC | 2.40e-23 | 3.16e-01 | 0.1327 |
| 5495 | PPM1B | P8T-E | Human | Esophagus | ESCC | 5.28e-17 | 2.64e-01 | 0.0889 |
| 5495 | PPM1B | P9T-E | Human | Esophagus | ESCC | 1.66e-27 | 3.28e-01 | 0.1131 |
| 5495 | PPM1B | P10T-E | Human | Esophagus | ESCC | 4.82e-23 | 3.90e-01 | 0.116 |
| 5495 | PPM1B | P11T-E | Human | Esophagus | ESCC | 1.58e-13 | 6.31e-01 | 0.1426 |
| 5495 | PPM1B | P12T-E | Human | Esophagus | ESCC | 8.21e-38 | 6.54e-01 | 0.1122 |
| 5495 | PPM1B | P15T-E | Human | Esophagus | ESCC | 1.49e-24 | 6.71e-01 | 0.1149 |
| 5495 | PPM1B | P16T-E | Human | Esophagus | ESCC | 1.11e-31 | 4.49e-01 | 0.1153 |
| 5495 | PPM1B | P19T-E | Human | Esophagus | ESCC | 3.16e-10 | 3.24e-01 | 0.1662 |
| 5495 | PPM1B | P20T-E | Human | Esophagus | ESCC | 1.49e-13 | 2.34e-01 | 0.1124 |
| 5495 | PPM1B | P21T-E | Human | Esophagus | ESCC | 4.25e-18 | 1.37e-01 | 0.1617 |
| Page: 1 2 3 4 5 |
| Tissue | Expression Dynamics | Abbreviation |
| Esophagus |  | ESCC: Esophageal squamous cell carcinoma |
| HGIN: High-grade intraepithelial neoplasias | ||
| LGIN: Low-grade intraepithelial neoplasias | ||
| Liver | 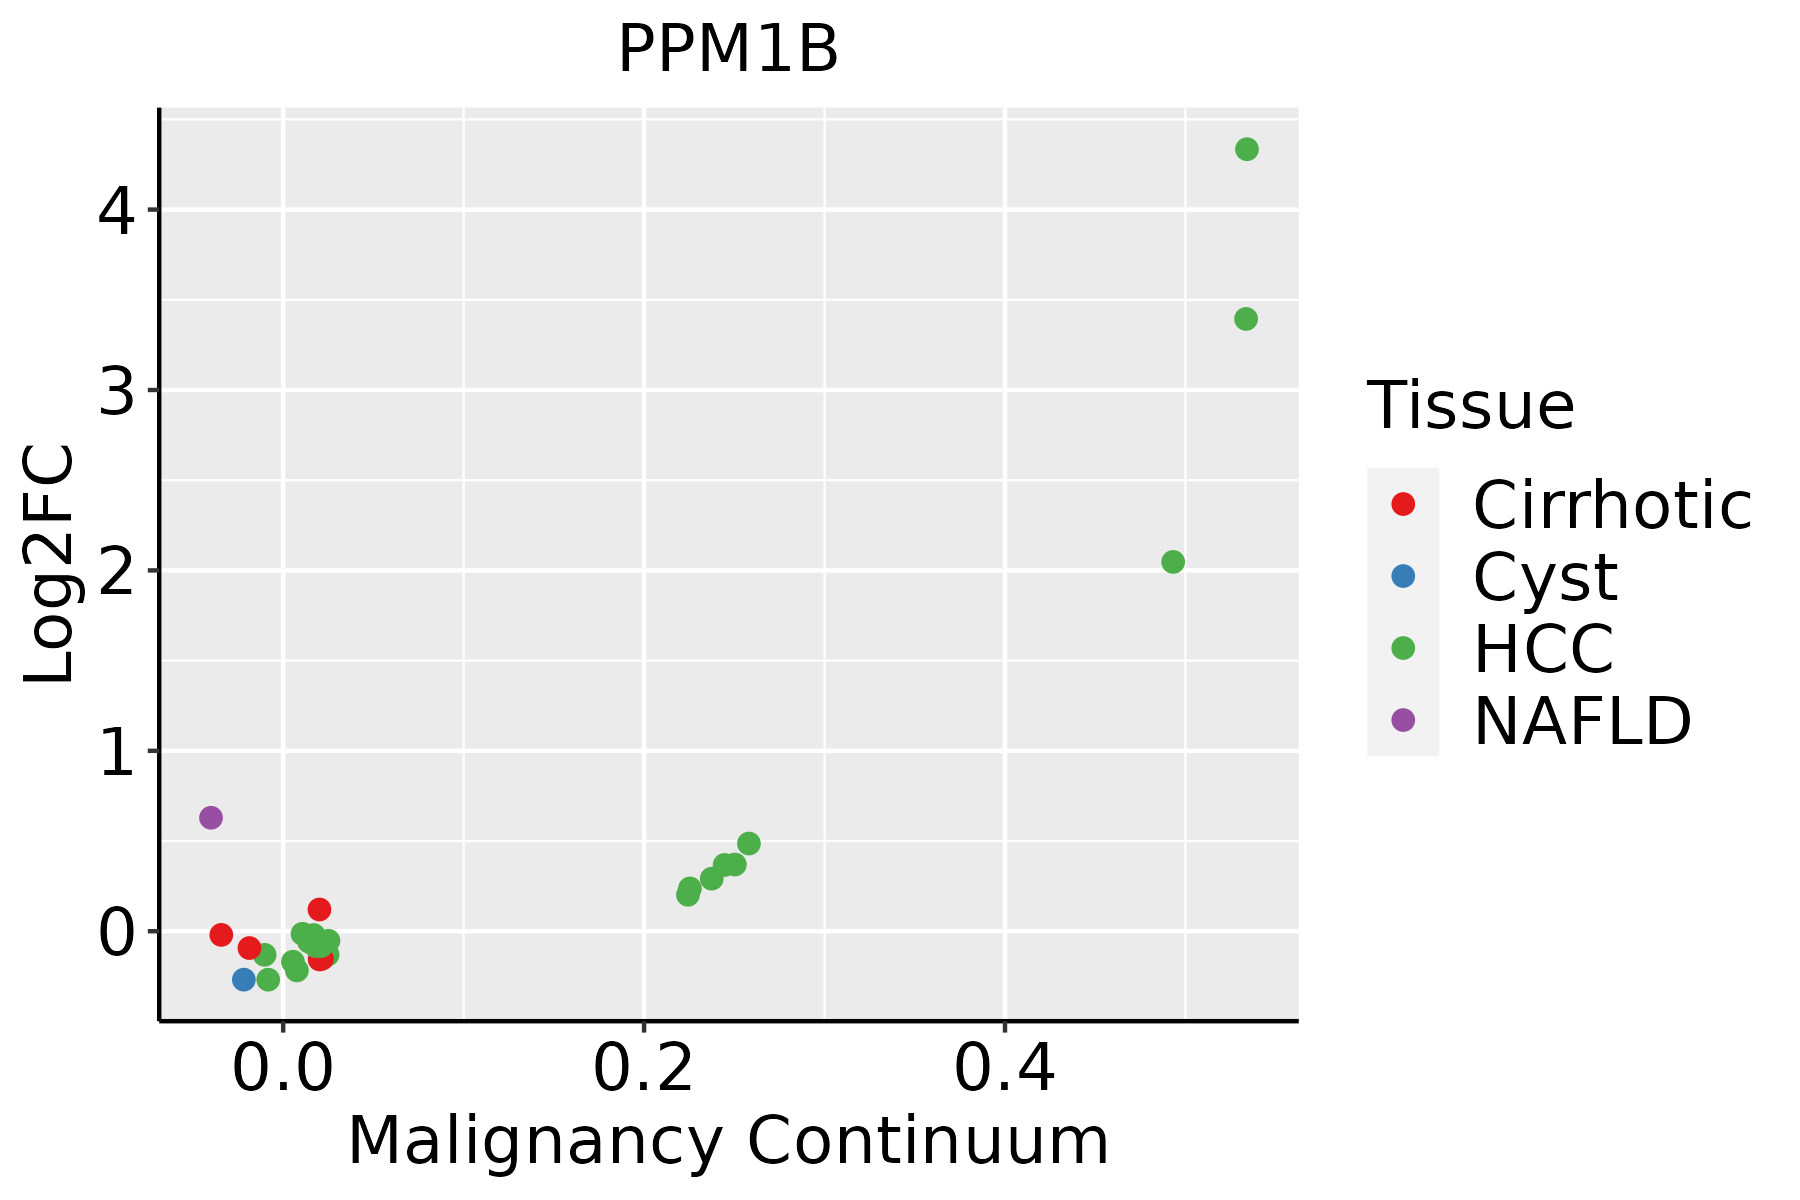 | HCC: Hepatocellular carcinoma |
| NAFLD: Non-alcoholic fatty liver disease | ||
| Oral Cavity |  | EOLP: Erosive Oral lichen planus |
| LP: leukoplakia | ||
| NEOLP: Non-erosive oral lichen planus | ||
| OSCC: Oral squamous cell carcinoma |
| ∗log2FC in expression of this searched gene in stem-like cells from each diseased tissue sample relative to stem-like cells in normal samples in each tissue plotted against the malignancy continuum. Samples are colored based on if they are from different disease stage. |
Top |
Malignant transformation related pathway analysis |
| Find out the enriched GO biological processes and KEGG pathways involved in transition from healthy to precancer to cancer |
| Tissue | Disease Stage | Enriched GO biological Processes |
| Colorectum | AD |  |
| Colorectum | SER |  |
| Colorectum | MSS |  |
| Colorectum | MSI-H |  |
| Colorectum | FAP |  |
| ∗Top 15 enriched GO BP terms are showed in the bar plot of each disease state in each tissue. Each row represents a significant GO biological process which is colored according to the -log10(p.adjust). |
| Page: 1 2 3 4 5 6 7 8 9 |
| GO ID | Tissue | Disease Stage | Description | Gene Ratio | Bg Ratio | pvalue | p.adjust | Count |
| GO:000961518 | Esophagus | ESCC | response to virus | 238/8552 | 367/18723 | 6.65e-14 | 3.32e-12 | 238 |
| GO:004354313 | Esophagus | ESCC | protein acylation | 165/8552 | 243/18723 | 1.69e-12 | 7.14e-11 | 165 |
| GO:0043122110 | Esophagus | ESCC | regulation of I-kappaB kinase/NF-kappaB signaling | 167/8552 | 249/18723 | 6.11e-12 | 2.32e-10 | 167 |
| GO:000724919 | Esophagus | ESCC | I-kappaB kinase/NF-kappaB signaling | 183/8552 | 281/18723 | 3.02e-11 | 1.01e-09 | 183 |
| GO:001605517 | Esophagus | ESCC | Wnt signaling pathway | 268/8552 | 444/18723 | 2.32e-10 | 6.58e-09 | 268 |
| GO:019873817 | Esophagus | ESCC | cell-cell signaling by wnt | 269/8552 | 446/18723 | 2.41e-10 | 6.79e-09 | 269 |
| GO:00516075 | Esophagus | ESCC | defense response to virus | 171/8552 | 265/18723 | 3.91e-10 | 1.05e-08 | 171 |
| GO:01405465 | Esophagus | ESCC | defense response to symbiont | 171/8552 | 265/18723 | 3.91e-10 | 1.05e-08 | 171 |
| GO:001631110 | Esophagus | ESCC | dephosphorylation | 251/8552 | 417/18723 | 1.26e-09 | 2.99e-08 | 251 |
| GO:000647018 | Esophagus | ESCC | protein dephosphorylation | 177/8552 | 281/18723 | 3.13e-09 | 6.72e-08 | 177 |
| GO:003011117 | Esophagus | ESCC | regulation of Wnt signaling pathway | 194/8552 | 328/18723 | 5.39e-07 | 7.14e-06 | 194 |
| GO:006007016 | Esophagus | ESCC | canonical Wnt signaling pathway | 180/8552 | 303/18723 | 9.15e-07 | 1.17e-05 | 180 |
| GO:006082817 | Esophagus | ESCC | regulation of canonical Wnt signaling pathway | 153/8552 | 253/18723 | 1.38e-06 | 1.67e-05 | 153 |
| GO:00028318 | Esophagus | ESCC | regulation of response to biotic stimulus | 191/8552 | 327/18723 | 2.12e-06 | 2.45e-05 | 191 |
| GO:000283212 | Esophagus | ESCC | negative regulation of response to biotic stimulus | 72/8552 | 108/18723 | 8.36e-06 | 8.11e-05 | 72 |
| GO:00421573 | Esophagus | ESCC | lipoprotein metabolic process | 86/8552 | 135/18723 | 1.78e-05 | 1.57e-04 | 86 |
| GO:00064973 | Esophagus | ESCC | protein lipidation | 62/8552 | 92/18723 | 2.08e-05 | 1.80e-04 | 62 |
| GO:00421583 | Esophagus | ESCC | lipoprotein biosynthetic process | 64/8552 | 96/18723 | 2.61e-05 | 2.20e-04 | 64 |
| GO:009026316 | Esophagus | ESCC | positive regulation of canonical Wnt signaling pathway | 69/8552 | 106/18723 | 4.22e-05 | 3.39e-04 | 69 |
| GO:003017716 | Esophagus | ESCC | positive regulation of Wnt signaling pathway | 87/8552 | 140/18723 | 6.18e-05 | 4.73e-04 | 87 |
| Page: 1 2 3 4 5 6 7 8 9 10 |
| Pathway ID | Tissue | Disease Stage | Description | Gene Ratio | Bg Ratio | pvalue | p.adjust | qvalue | Count |
| hsa0401014 | Oral cavity | OSCC | MAPK signaling pathway | 165/3704 | 302/8465 | 7.11e-05 | 2.74e-04 | 1.40e-04 | 165 |
| hsa0401015 | Oral cavity | OSCC | MAPK signaling pathway | 165/3704 | 302/8465 | 7.11e-05 | 2.74e-04 | 1.40e-04 | 165 |
| hsa0401023 | Oral cavity | EOLP | MAPK signaling pathway | 68/1218 | 302/8465 | 7.48e-05 | 3.40e-04 | 2.01e-04 | 68 |
| hsa0401033 | Oral cavity | EOLP | MAPK signaling pathway | 68/1218 | 302/8465 | 7.48e-05 | 3.40e-04 | 2.01e-04 | 68 |
| hsa0401041 | Oral cavity | NEOLP | MAPK signaling pathway | 59/1112 | 302/8465 | 9.40e-04 | 4.67e-03 | 2.94e-03 | 59 |
| hsa0401051 | Oral cavity | NEOLP | MAPK signaling pathway | 59/1112 | 302/8465 | 9.40e-04 | 4.67e-03 | 2.94e-03 | 59 |
| Page: 1 |
Top |
Cell-cell communication analysis |
| Identification of potential cell-cell interactions between two cell types and their ligand-receptor pairs for different disease states |
| Ligand | Receptor | LRpair | Pathway | Tissue | Disease Stage |
| Page: 1 |
Top |
Single-cell gene regulatory network inference analysis |
| Find out the significant the regulons (TFs) and the target genes of each regulon across cell types for different disease states |
| TF | Cell Type | Tissue | Disease Stage | Target Gene | RSS | Regulon Activity |
| ∗The dot plots of a searched regulon are shown for all cell subpopulations in each disease state of each tissue based on the regulon specific score inferred using pySCENIC and by calculating the average expression. |
| Page: 1 |
Top |
Somatic mutation of malignant transformation related genes |
| Annotation of somatic variants for genes involved in malignant transformation |
| Hugo Symbol | Variant Class | Variant Classification | dbSNP RS | HGVSc | HGVSp | HGVSp Short | SWISSPROT | BIOTYPE | SIFT | PolyPhen | Tumor Sample Barcode | Tissue | Histology | Sex | Age | Stage | Therapy Types | Drugs | Outcome |
| PPM1B | SNV | Missense_Mutation | novel | c.821N>T | p.Trp274Leu | p.W274L | O75688 | protein_coding | tolerated(0.11) | benign(0) | TCGA-A1-A0SN-01 | Breast | breast invasive carcinoma | Female | <65 | I/II | Chemotherapy | ac | SD |
| PPM1B | SNV | Missense_Mutation | novel | c.145N>T | p.Gly49Cys | p.G49C | O75688 | protein_coding | deleterious(0.01) | probably_damaging(0.962) | TCGA-A7-A0DB-01 | Breast | breast invasive carcinoma | Female | <65 | I/II | Hormone Therapy | arimidex | SD |
| PPM1B | SNV | Missense_Mutation | novel | c.953C>T | p.Ser318Leu | p.S318L | O75688 | protein_coding | tolerated(0.09) | benign(0.035) | TCGA-A8-A06Q-01 | Breast | breast invasive carcinoma | Female | <65 | III/IV | Unknown | Unknown | SD |
| PPM1B | SNV | Missense_Mutation | c.387N>C | p.Arg129Ser | p.R129S | O75688 | protein_coding | deleterious(0.02) | possibly_damaging(0.666) | TCGA-AC-A23H-01 | Breast | breast invasive carcinoma | Female | >=65 | I/II | Unknown | Unknown | PD | |
| PPM1B | SNV | Missense_Mutation | c.1242N>A | p.Met414Ile | p.M414I | O75688 | protein_coding | tolerated_low_confidence(0.06) | benign(0.003) | TCGA-AO-A0J5-01 | Breast | breast invasive carcinoma | Female | <65 | III/IV | Other, specify in notesBisphosphonate | zoledronic | PD | |
| PPM1B | SNV | Missense_Mutation | c.1261N>C | p.Ala421Pro | p.A421P | O75688 | protein_coding | deleterious_low_confidence(0.02) | benign(0.401) | TCGA-E2-A158-01 | Breast | breast invasive carcinoma | Female | <65 | I/II | Chemotherapy | arimidex | SD | |
| PPM1B | SNV | Missense_Mutation | novel | c.1019G>A | p.Arg340His | p.R340H | O75688 | protein_coding | tolerated(0.18) | benign(0.009) | TCGA-2W-A8YY-01 | Cervix | cervical & endocervical cancer | Female | <65 | I/II | Chemotherapy | cisplatin | CR |
| PPM1B | SNV | Missense_Mutation | novel | c.1378C>A | p.Leu460Ile | p.L460I | O75688 | protein_coding | tolerated_low_confidence(0.12) | benign(0.003) | TCGA-2W-A8YY-01 | Cervix | cervical & endocervical cancer | Female | <65 | I/II | Chemotherapy | cisplatin | CR |
| PPM1B | SNV | Missense_Mutation | novel | c.1210N>T | p.Arg404Trp | p.R404W | O75688 | protein_coding | deleterious_low_confidence(0) | probably_damaging(0.984) | TCGA-VS-A953-01 | Cervix | cervical & endocervical cancer | Female | <65 | I/II | Unknown | Unknown | PD |
| PPM1B | SNV | Missense_Mutation | rs758211363 | c.353N>A | p.Arg118His | p.R118H | O75688 | protein_coding | tolerated(0.1) | benign(0.255) | TCGA-A6-6781-01 | Colorectum | colon adenocarcinoma | Male | <65 | III/IV | Chemotherapy | oxaliplatin | SD |
| Page: 1 2 3 4 5 6 7 8 |
Top |
Related drugs of malignant transformation related genes |
| Identification of chemicals and drugs interact with genes involved in malignant transfromation |
| (DGIdb 4.0) |
| Entrez ID | Symbol | Category | Interaction Types | Drug Claim Name | Drug Name | PMIDs |
| Page: 1 |

Copyright 2023-Present -The University of Texas Health Science Center at Houston |