
|
|||||
|
 | |
| |
| |
| |
| |
| |
|
Gene: PPM1A |
Gene summary for PPM1A |
| Gene information | Species | Human | Gene symbol | PPM1A | Gene ID | 5494 |
| Gene name | protein phosphatase, Mg2+/Mn2+ dependent 1A | |
| Gene Alias | PP2C-ALPHA | |
| Cytomap | 14q23.1 | |
| Gene Type | protein-coding | GO ID | GO:0000122 | UniProtAcc | A0A024R6A5 |
Top |
Malignant transformation analysis |
| Identification of the aberrant gene expression in precancerous and cancerous lesions by comparing the gene expression of stem-like cells in diseased tissues with normal stem cells |
| Entrez ID | Symbol | Replicates | Species | Organ | Tissue | Adj P-value | Log2FC | Malignancy |
| 5494 | PPM1A | LZE4T | Human | Esophagus | ESCC | 9.89e-07 | 6.53e-02 | 0.0811 |
| 5494 | PPM1A | LZE7T | Human | Esophagus | ESCC | 7.38e-05 | 1.15e-01 | 0.0667 |
| 5494 | PPM1A | LZE20T | Human | Esophagus | ESCC | 1.26e-07 | 2.50e-01 | 0.0662 |
| 5494 | PPM1A | LZE22T | Human | Esophagus | ESCC | 2.12e-05 | 2.54e-01 | 0.068 |
| 5494 | PPM1A | LZE24T | Human | Esophagus | ESCC | 7.26e-15 | 2.87e-01 | 0.0596 |
| 5494 | PPM1A | P1T-E | Human | Esophagus | ESCC | 2.97e-04 | 2.12e-01 | 0.0875 |
| 5494 | PPM1A | P2T-E | Human | Esophagus | ESCC | 2.55e-19 | 3.10e-01 | 0.1177 |
| 5494 | PPM1A | P4T-E | Human | Esophagus | ESCC | 2.58e-20 | 3.06e-01 | 0.1323 |
| 5494 | PPM1A | P5T-E | Human | Esophagus | ESCC | 2.53e-14 | 5.09e-02 | 0.1327 |
| 5494 | PPM1A | P8T-E | Human | Esophagus | ESCC | 1.51e-30 | 4.89e-01 | 0.0889 |
| 5494 | PPM1A | P9T-E | Human | Esophagus | ESCC | 3.83e-10 | 1.22e-01 | 0.1131 |
| 5494 | PPM1A | P10T-E | Human | Esophagus | ESCC | 1.79e-28 | 4.98e-01 | 0.116 |
| 5494 | PPM1A | P11T-E | Human | Esophagus | ESCC | 3.18e-07 | 3.76e-01 | 0.1426 |
| 5494 | PPM1A | P12T-E | Human | Esophagus | ESCC | 4.33e-27 | 5.91e-01 | 0.1122 |
| 5494 | PPM1A | P15T-E | Human | Esophagus | ESCC | 1.25e-32 | 8.23e-01 | 0.1149 |
| 5494 | PPM1A | P16T-E | Human | Esophagus | ESCC | 2.45e-18 | 2.27e-01 | 0.1153 |
| 5494 | PPM1A | P17T-E | Human | Esophagus | ESCC | 2.51e-07 | 2.29e-01 | 0.1278 |
| 5494 | PPM1A | P19T-E | Human | Esophagus | ESCC | 3.77e-04 | 5.11e-01 | 0.1662 |
| 5494 | PPM1A | P20T-E | Human | Esophagus | ESCC | 3.26e-13 | 1.72e-01 | 0.1124 |
| 5494 | PPM1A | P21T-E | Human | Esophagus | ESCC | 2.06e-30 | 1.87e-01 | 0.1617 |
| Page: 1 2 3 4 5 |
| Tissue | Expression Dynamics | Abbreviation |
| Esophagus | 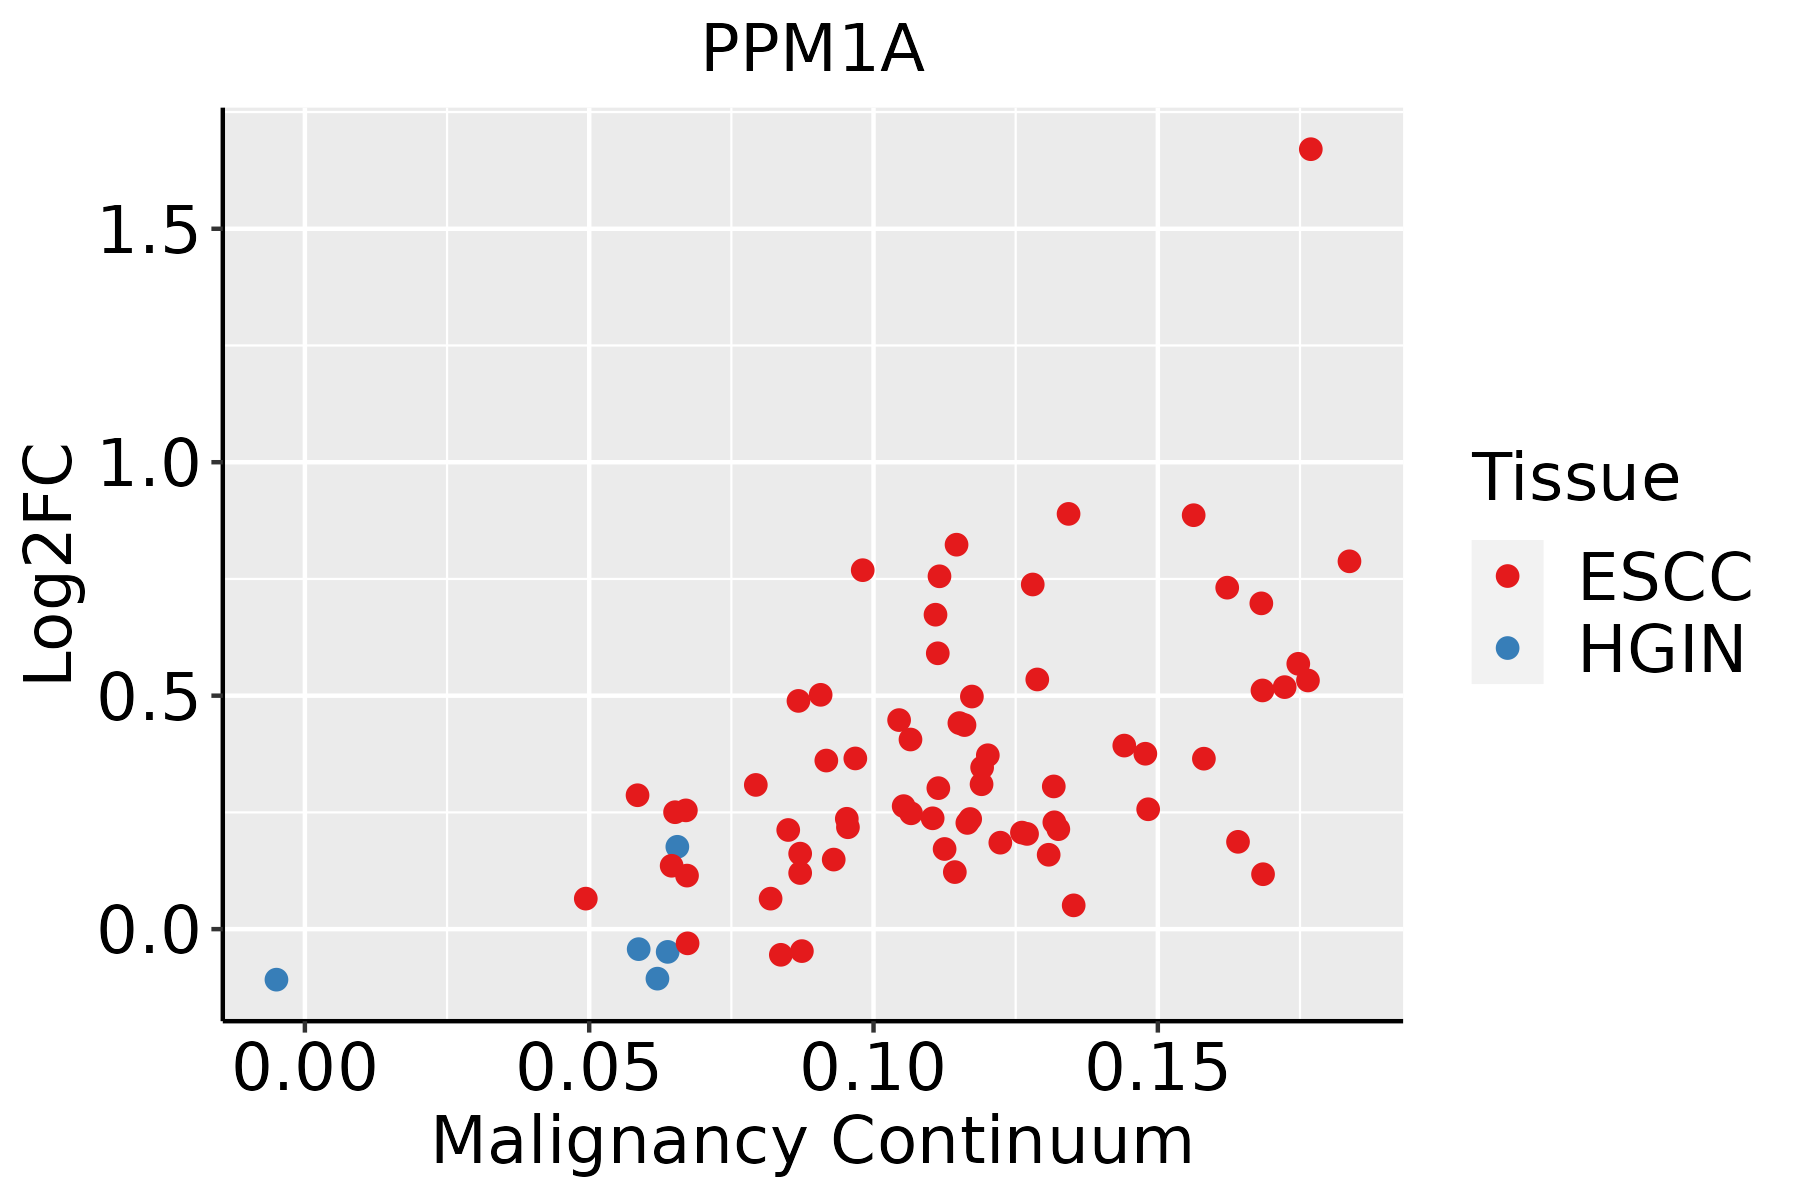 | ESCC: Esophageal squamous cell carcinoma |
| HGIN: High-grade intraepithelial neoplasias | ||
| LGIN: Low-grade intraepithelial neoplasias | ||
| Liver |  | HCC: Hepatocellular carcinoma |
| NAFLD: Non-alcoholic fatty liver disease | ||
| Oral Cavity | 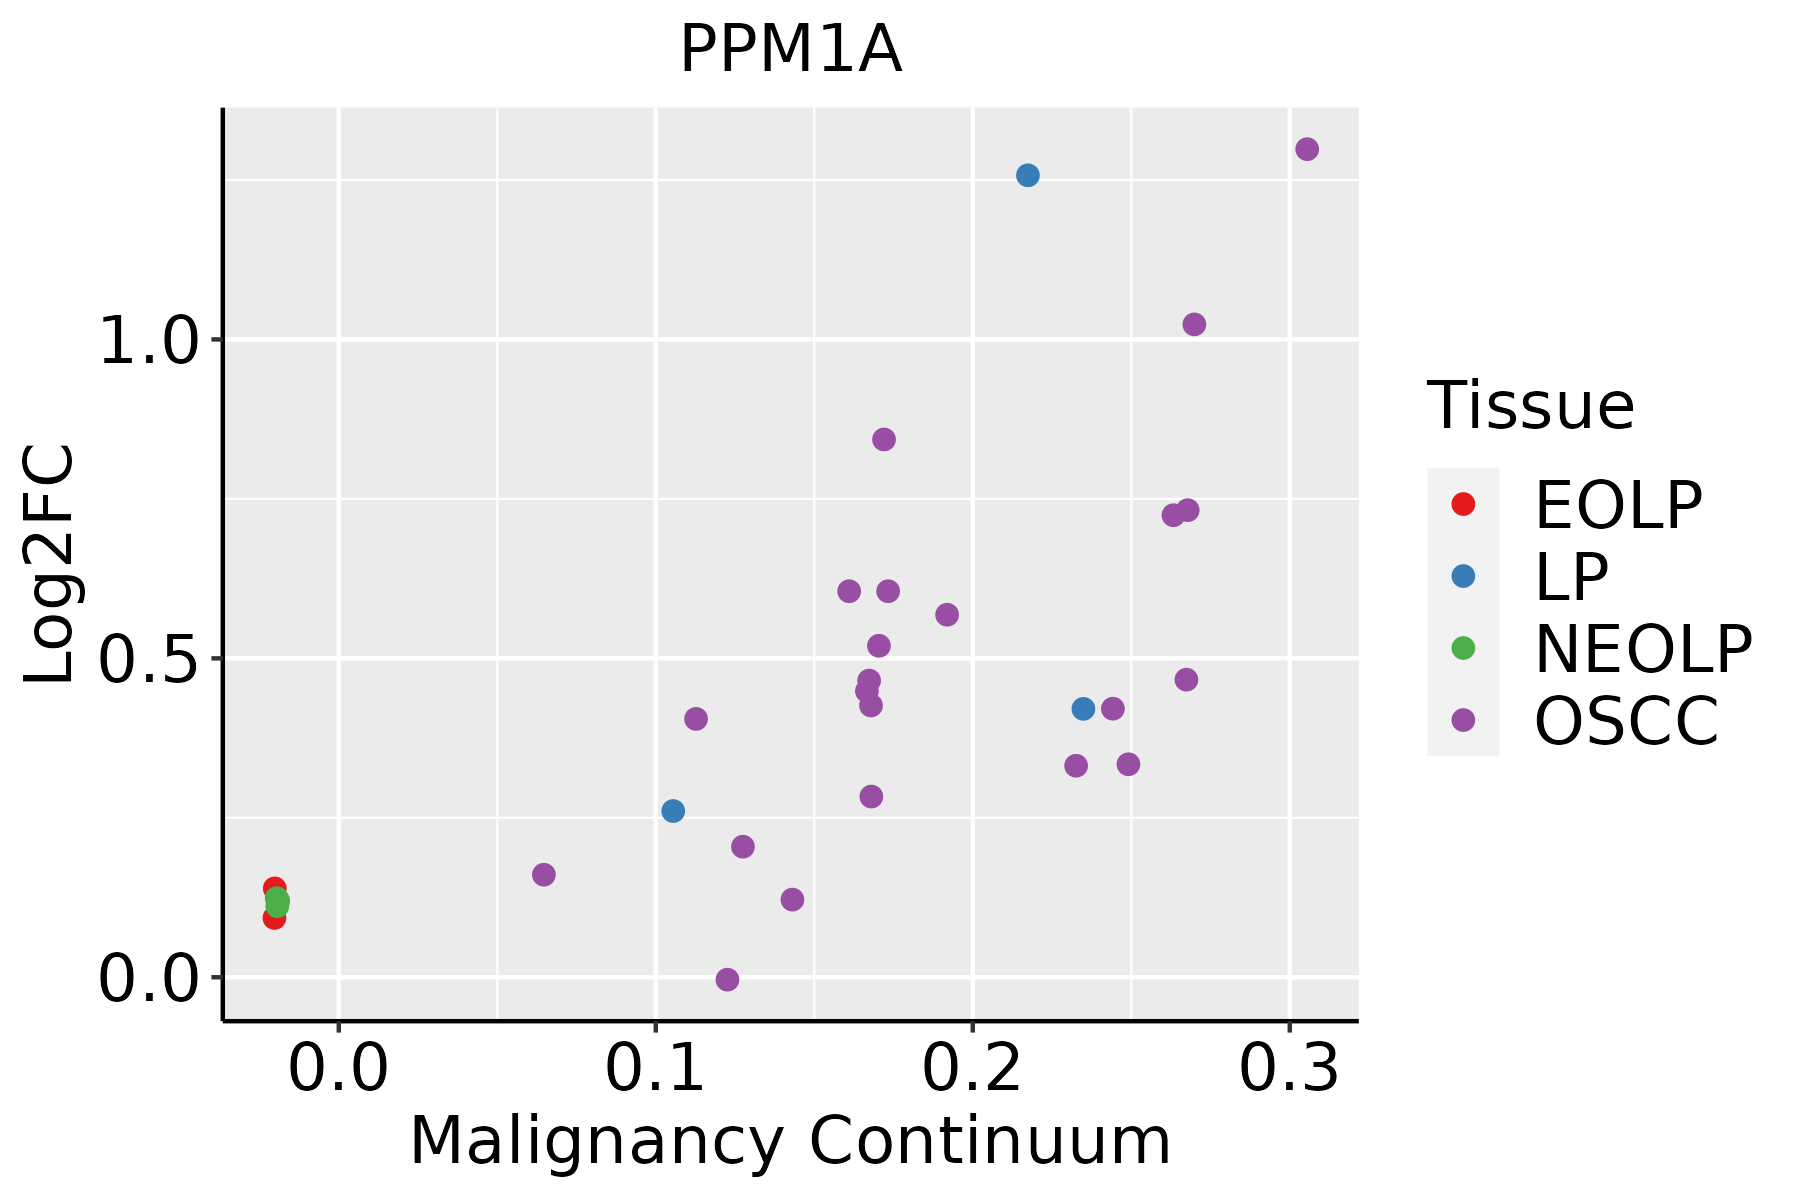 | EOLP: Erosive Oral lichen planus |
| LP: leukoplakia | ||
| NEOLP: Non-erosive oral lichen planus | ||
| OSCC: Oral squamous cell carcinoma | ||
| Prostate |  | BPH: Benign Prostatic Hyperplasia |
| ∗log2FC in expression of this searched gene in stem-like cells from each diseased tissue sample relative to stem-like cells in normal samples in each tissue plotted against the malignancy continuum. Samples are colored based on if they are from different disease stage. |
Top |
Malignant transformation related pathway analysis |
| Find out the enriched GO biological processes and KEGG pathways involved in transition from healthy to precancer to cancer |
| Tissue | Disease Stage | Enriched GO biological Processes |
| Colorectum | AD |  |
| Colorectum | SER |  |
| Colorectum | MSS |  |
| Colorectum | MSI-H |  |
| Colorectum | FAP |  |
| ∗Top 15 enriched GO BP terms are showed in the bar plot of each disease state in each tissue. Each row represents a significant GO biological process which is colored according to the -log10(p.adjust). |
| Page: 1 2 3 4 5 6 7 8 9 |
| GO ID | Tissue | Disease Stage | Description | Gene Ratio | Bg Ratio | pvalue | p.adjust | Count |
| GO:0043254111 | Esophagus | ESCC | regulation of protein-containing complex assembly | 278/8552 | 428/18723 | 3.81e-16 | 2.77e-14 | 278 |
| GO:004354313 | Esophagus | ESCC | protein acylation | 165/8552 | 243/18723 | 1.69e-12 | 7.14e-11 | 165 |
| GO:004312318 | Esophagus | ESCC | positive regulation of I-kappaB kinase/NF-kappaB signaling | 132/8552 | 186/18723 | 2.07e-12 | 8.58e-11 | 132 |
| GO:0043122110 | Esophagus | ESCC | regulation of I-kappaB kinase/NF-kappaB signaling | 167/8552 | 249/18723 | 6.11e-12 | 2.32e-10 | 167 |
| GO:000724919 | Esophagus | ESCC | I-kappaB kinase/NF-kappaB signaling | 183/8552 | 281/18723 | 3.02e-11 | 1.01e-09 | 183 |
| GO:001605517 | Esophagus | ESCC | Wnt signaling pathway | 268/8552 | 444/18723 | 2.32e-10 | 6.58e-09 | 268 |
| GO:019873817 | Esophagus | ESCC | cell-cell signaling by wnt | 269/8552 | 446/18723 | 2.41e-10 | 6.79e-09 | 269 |
| GO:001631110 | Esophagus | ESCC | dephosphorylation | 251/8552 | 417/18723 | 1.26e-09 | 2.99e-08 | 251 |
| GO:000647018 | Esophagus | ESCC | protein dephosphorylation | 177/8552 | 281/18723 | 3.13e-09 | 6.72e-08 | 177 |
| GO:00715599 | Esophagus | ESCC | response to transforming growth factor beta | 157/8552 | 256/18723 | 2.95e-07 | 4.23e-06 | 157 |
| GO:003011117 | Esophagus | ESCC | regulation of Wnt signaling pathway | 194/8552 | 328/18723 | 5.39e-07 | 7.14e-06 | 194 |
| GO:006007016 | Esophagus | ESCC | canonical Wnt signaling pathway | 180/8552 | 303/18723 | 9.15e-07 | 1.17e-05 | 180 |
| GO:006082817 | Esophagus | ESCC | regulation of canonical Wnt signaling pathway | 153/8552 | 253/18723 | 1.38e-06 | 1.67e-05 | 153 |
| GO:00715609 | Esophagus | ESCC | cellular response to transforming growth factor beta stimulus | 151/8552 | 250/18723 | 1.78e-06 | 2.10e-05 | 151 |
| GO:00071799 | Esophagus | ESCC | transforming growth factor beta receptor signaling pathway | 121/8552 | 198/18723 | 8.26e-06 | 8.03e-05 | 121 |
| GO:00421573 | Esophagus | ESCC | lipoprotein metabolic process | 86/8552 | 135/18723 | 1.78e-05 | 1.57e-04 | 86 |
| GO:00064973 | Esophagus | ESCC | protein lipidation | 62/8552 | 92/18723 | 2.08e-05 | 1.80e-04 | 62 |
| GO:00421583 | Esophagus | ESCC | lipoprotein biosynthetic process | 64/8552 | 96/18723 | 2.61e-05 | 2.20e-04 | 64 |
| GO:009026316 | Esophagus | ESCC | positive regulation of canonical Wnt signaling pathway | 69/8552 | 106/18723 | 4.22e-05 | 3.39e-04 | 69 |
| GO:003017716 | Esophagus | ESCC | positive regulation of Wnt signaling pathway | 87/8552 | 140/18723 | 6.18e-05 | 4.73e-04 | 87 |
| Page: 1 2 3 4 5 6 7 8 9 10 11 12 13 |
| Pathway ID | Tissue | Disease Stage | Description | Gene Ratio | Bg Ratio | pvalue | p.adjust | qvalue | Count |
| hsa0401014 | Oral cavity | OSCC | MAPK signaling pathway | 165/3704 | 302/8465 | 7.11e-05 | 2.74e-04 | 1.40e-04 | 165 |
| hsa0401015 | Oral cavity | OSCC | MAPK signaling pathway | 165/3704 | 302/8465 | 7.11e-05 | 2.74e-04 | 1.40e-04 | 165 |
| hsa0401023 | Oral cavity | EOLP | MAPK signaling pathway | 68/1218 | 302/8465 | 7.48e-05 | 3.40e-04 | 2.01e-04 | 68 |
| hsa0401033 | Oral cavity | EOLP | MAPK signaling pathway | 68/1218 | 302/8465 | 7.48e-05 | 3.40e-04 | 2.01e-04 | 68 |
| hsa0401041 | Oral cavity | NEOLP | MAPK signaling pathway | 59/1112 | 302/8465 | 9.40e-04 | 4.67e-03 | 2.94e-03 | 59 |
| hsa0401051 | Oral cavity | NEOLP | MAPK signaling pathway | 59/1112 | 302/8465 | 9.40e-04 | 4.67e-03 | 2.94e-03 | 59 |
| hsa0401010 | Prostate | BPH | MAPK signaling pathway | 87/1718 | 302/8465 | 2.05e-04 | 1.13e-03 | 6.98e-04 | 87 |
| hsa0401013 | Prostate | BPH | MAPK signaling pathway | 87/1718 | 302/8465 | 2.05e-04 | 1.13e-03 | 6.98e-04 | 87 |
| hsa0401022 | Prostate | Tumor | MAPK signaling pathway | 87/1791 | 302/8465 | 8.46e-04 | 3.94e-03 | 2.45e-03 | 87 |
| hsa0401032 | Prostate | Tumor | MAPK signaling pathway | 87/1791 | 302/8465 | 8.46e-04 | 3.94e-03 | 2.45e-03 | 87 |
| Page: 1 |
Top |
Cell-cell communication analysis |
| Identification of potential cell-cell interactions between two cell types and their ligand-receptor pairs for different disease states |
| Ligand | Receptor | LRpair | Pathway | Tissue | Disease Stage |
| Page: 1 |
Top |
Single-cell gene regulatory network inference analysis |
| Find out the significant the regulons (TFs) and the target genes of each regulon across cell types for different disease states |
| TF | Cell Type | Tissue | Disease Stage | Target Gene | RSS | Regulon Activity |
| ∗The dot plots of a searched regulon are shown for all cell subpopulations in each disease state of each tissue based on the regulon specific score inferred using pySCENIC and by calculating the average expression. |
| Page: 1 |
Top |
Somatic mutation of malignant transformation related genes |
| Annotation of somatic variants for genes involved in malignant transformation |
| Hugo Symbol | Variant Class | Variant Classification | dbSNP RS | HGVSc | HGVSp | HGVSp Short | SWISSPROT | BIOTYPE | SIFT | PolyPhen | Tumor Sample Barcode | Tissue | Histology | Sex | Age | Stage | Therapy Types | Drugs | Outcome |
| PPM1A | SNV | Missense_Mutation | novel | c.413C>G | p.Ser138Cys | p.S138C | P35813 | protein_coding | deleterious(0.04) | probably_damaging(0.985) | TCGA-E9-A3Q9-01 | Breast | breast invasive carcinoma | Female | >=65 | III/IV | Chemotherapy | cyclophosphane | CR |
| PPM1A | SNV | Missense_Mutation | c.1027G>A | p.Glu343Lys | p.E343K | P35813 | protein_coding | tolerated(0.09) | possibly_damaging(0.764) | TCGA-EW-A1J5-01 | Breast | breast invasive carcinoma | Female | <65 | I/II | Chemotherapy | adriamycin | SD | |
| PPM1A | insertion | Frame_Shift_Ins | novel | c.541_542insGTATCATTAGCATCATCAATACCCTAGT | p.Ile181SerfsTer11 | p.I181Sfs*11 | P35813 | protein_coding | TCGA-AO-A03T-01 | Breast | breast invasive carcinoma | Female | <65 | I/II | Chemotherapy | cyclophosphamide | SD | ||
| PPM1A | SNV | Missense_Mutation | novel | c.710N>G | p.His237Arg | p.H237R | P35813 | protein_coding | deleterious(0) | benign(0.279) | TCGA-2W-A8YY-01 | Cervix | cervical & endocervical cancer | Female | <65 | I/II | Chemotherapy | cisplatin | CR |
| PPM1A | SNV | Missense_Mutation | c.245A>C | p.Lys82Thr | p.K82T | P35813 | protein_coding | tolerated(0.06) | probably_damaging(0.999) | TCGA-AA-3715-01 | Colorectum | colon adenocarcinoma | Male | >=65 | I/II | Unknown | Unknown | PD | |
| PPM1A | SNV | Missense_Mutation | c.562A>G | p.Met188Val | p.M188V | P35813 | protein_coding | tolerated(0.07) | benign(0.001) | TCGA-AA-3715-01 | Colorectum | colon adenocarcinoma | Male | >=65 | I/II | Unknown | Unknown | PD | |
| PPM1A | SNV | Missense_Mutation | c.317N>A | p.Arg106His | p.R106H | P35813 | protein_coding | deleterious(0.03) | probably_damaging(0.998) | TCGA-AA-3864-01 | Colorectum | colon adenocarcinoma | Male | >=65 | I/II | Unknown | Unknown | SD | |
| PPM1A | SNV | Missense_Mutation | novel | c.643N>G | p.Ile215Val | p.I215V | P35813 | protein_coding | tolerated(0.23) | benign(0.387) | TCGA-AA-3877-01 | Colorectum | colon adenocarcinoma | Female | >=65 | I/II | Unknown | Unknown | SD |
| PPM1A | SNV | Missense_Mutation | rs755451132 | c.1223G>A | p.Arg408His | p.R408H | P35813 | protein_coding | tolerated(0.14) | benign(0.013) | TCGA-AA-3947-01 | Colorectum | colon adenocarcinoma | Female | <65 | I/II | Unknown | Unknown | SD |
| PPM1A | SNV | Missense_Mutation | c.316N>T | p.Arg106Cys | p.R106C | P35813 | protein_coding | deleterious(0) | probably_damaging(0.999) | TCGA-AA-A010-01 | Colorectum | colon adenocarcinoma | Female | <65 | I/II | Chemotherapy | folinic | CR |
| Page: 1 2 3 4 5 |
Top |
Related drugs of malignant transformation related genes |
| Identification of chemicals and drugs interact with genes involved in malignant transfromation |
| (DGIdb 4.0) |
| Entrez ID | Symbol | Category | Interaction Types | Drug Claim Name | Drug Name | PMIDs |
| 5494 | PPM1A | ENZYME, KINASE, TUMOR SUPPRESSOR | VP-102 |
| Page: 1 |

Copyright 2023-Present -The University of Texas Health Science Center at Houston |