
|
|||||
|
 | |
| |
| |
| |
| |
| |
|
Gene: PPIP5K2 |
Gene summary for PPIP5K2 |
| Gene information | Species | Human | Gene symbol | PPIP5K2 | Gene ID | 23262 |
| Gene name | diphosphoinositol pentakisphosphate kinase 2 | |
| Gene Alias | CFAP160 | |
| Cytomap | 5q21.1 | |
| Gene Type | protein-coding | GO ID | GO:0003008 | UniProtAcc | O43314 |
Top |
Malignant transformation analysis |
| Identification of the aberrant gene expression in precancerous and cancerous lesions by comparing the gene expression of stem-like cells in diseased tissues with normal stem cells |
| Entrez ID | Symbol | Replicates | Species | Organ | Tissue | Adj P-value | Log2FC | Malignancy |
| 23262 | PPIP5K2 | HTA11_3410_2000001011 | Human | Colorectum | AD | 6.12e-20 | -6.78e-01 | 0.0155 |
| 23262 | PPIP5K2 | HTA11_2487_2000001011 | Human | Colorectum | SER | 5.56e-09 | -5.76e-01 | -0.1808 |
| 23262 | PPIP5K2 | HTA11_1938_2000001011 | Human | Colorectum | AD | 1.82e-03 | -4.82e-01 | -0.0811 |
| 23262 | PPIP5K2 | HTA11_3361_2000001011 | Human | Colorectum | AD | 1.37e-09 | -6.92e-01 | -0.1207 |
| 23262 | PPIP5K2 | HTA11_83_2000001011 | Human | Colorectum | SER | 1.15e-04 | -5.73e-01 | -0.1526 |
| 23262 | PPIP5K2 | HTA11_696_2000001011 | Human | Colorectum | AD | 2.29e-17 | -5.18e-01 | -0.1464 |
| 23262 | PPIP5K2 | HTA11_866_2000001011 | Human | Colorectum | AD | 3.87e-08 | -4.53e-01 | -0.1001 |
| 23262 | PPIP5K2 | HTA11_1391_2000001011 | Human | Colorectum | AD | 6.64e-06 | -5.05e-01 | -0.059 |
| 23262 | PPIP5K2 | HTA11_546_2000001011 | Human | Colorectum | AD | 2.36e-02 | -5.61e-01 | -0.0842 |
| 23262 | PPIP5K2 | HTA11_866_3004761011 | Human | Colorectum | AD | 2.77e-17 | -6.90e-01 | 0.096 |
| 23262 | PPIP5K2 | HTA11_9408_2000001011 | Human | Colorectum | AD | 1.46e-03 | -7.91e-01 | 0.0451 |
| 23262 | PPIP5K2 | HTA11_8622_2000001021 | Human | Colorectum | SER | 1.97e-03 | -6.74e-01 | 0.0528 |
| 23262 | PPIP5K2 | HTA11_10711_2000001011 | Human | Colorectum | AD | 1.16e-09 | -6.56e-01 | 0.0338 |
| 23262 | PPIP5K2 | HTA11_7696_3000711011 | Human | Colorectum | AD | 1.27e-26 | -6.50e-01 | 0.0674 |
| 23262 | PPIP5K2 | HTA11_6818_2000001021 | Human | Colorectum | AD | 4.10e-06 | -6.09e-01 | 0.0588 |
| 23262 | PPIP5K2 | HTA11_99999970781_79442 | Human | Colorectum | MSS | 3.54e-29 | -6.20e-01 | 0.294 |
| 23262 | PPIP5K2 | HTA11_99999965104_69814 | Human | Colorectum | MSS | 7.68e-04 | -4.61e-01 | 0.281 |
| 23262 | PPIP5K2 | HTA11_99999971662_82457 | Human | Colorectum | MSS | 2.96e-19 | -5.79e-01 | 0.3859 |
| 23262 | PPIP5K2 | HTA11_99999973899_84307 | Human | Colorectum | MSS | 3.83e-05 | -6.36e-01 | 0.2585 |
| 23262 | PPIP5K2 | HTA11_99999974143_84620 | Human | Colorectum | MSS | 1.81e-36 | -7.08e-01 | 0.3005 |
| Page: 1 2 3 4 5 6 7 |
| Tissue | Expression Dynamics | Abbreviation |
| Colorectum (GSE201348) |  | FAP: Familial adenomatous polyposis |
| CRC: Colorectal cancer | ||
| Colorectum (HTA11) |  | AD: Adenomas |
| SER: Sessile serrated lesions | ||
| MSI-H: Microsatellite-high colorectal cancer | ||
| MSS: Microsatellite stable colorectal cancer | ||
| Esophagus | 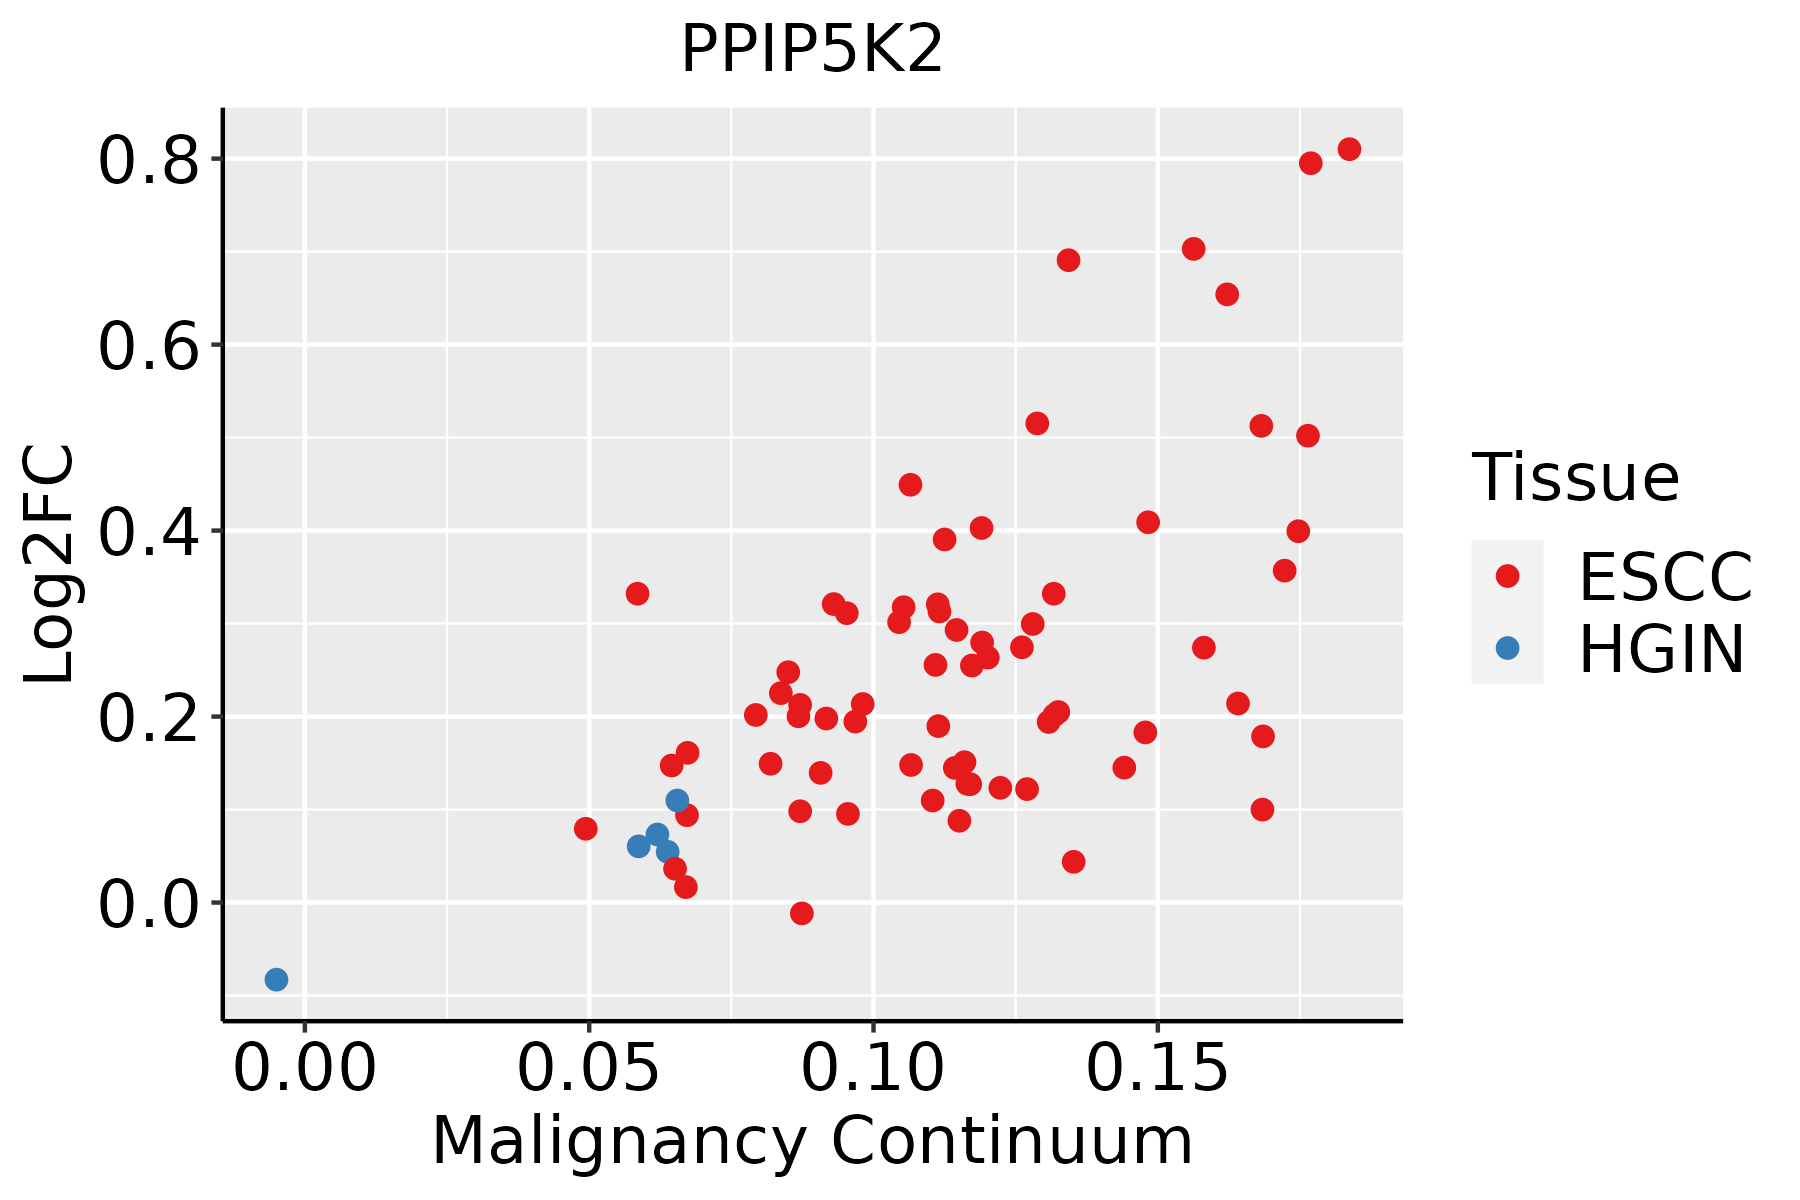 | ESCC: Esophageal squamous cell carcinoma |
| HGIN: High-grade intraepithelial neoplasias | ||
| LGIN: Low-grade intraepithelial neoplasias | ||
| Liver | 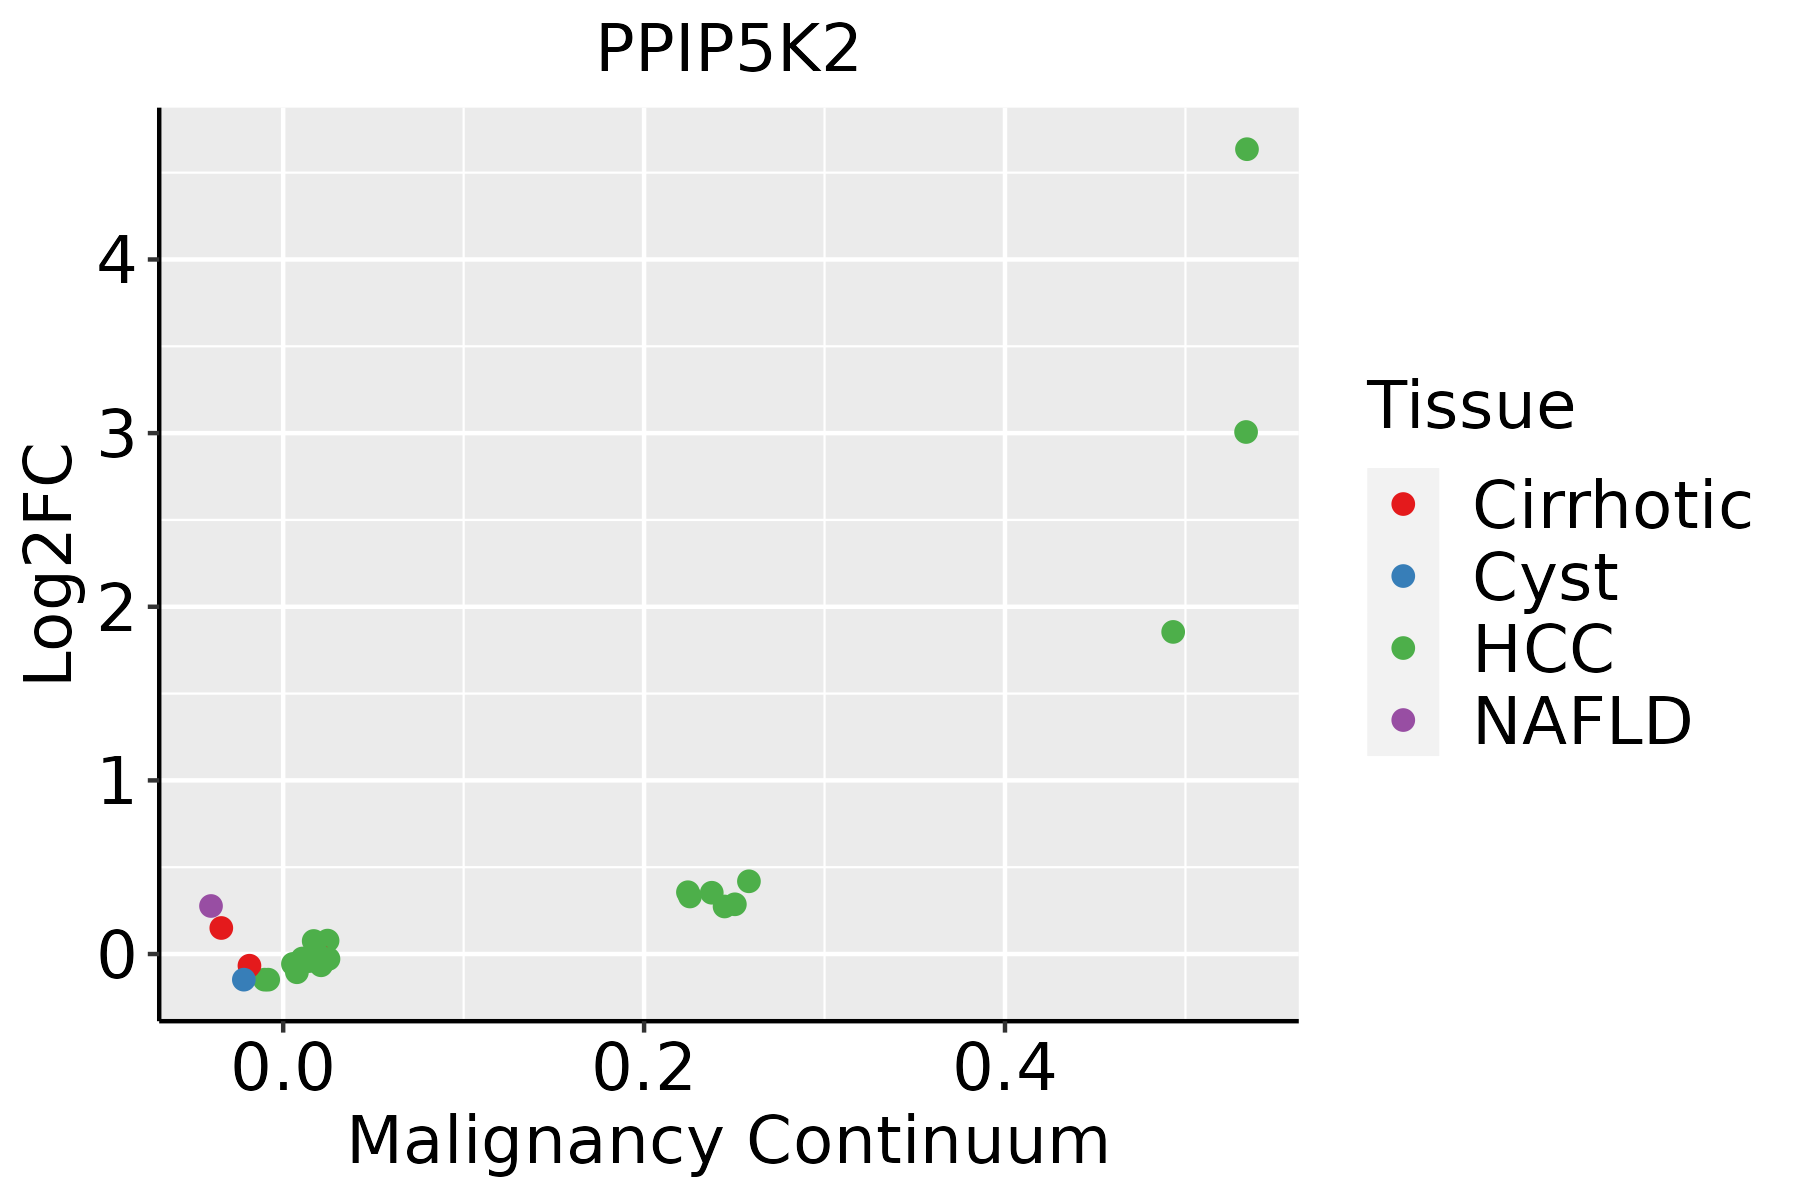 | HCC: Hepatocellular carcinoma |
| NAFLD: Non-alcoholic fatty liver disease | ||
| Thyroid | 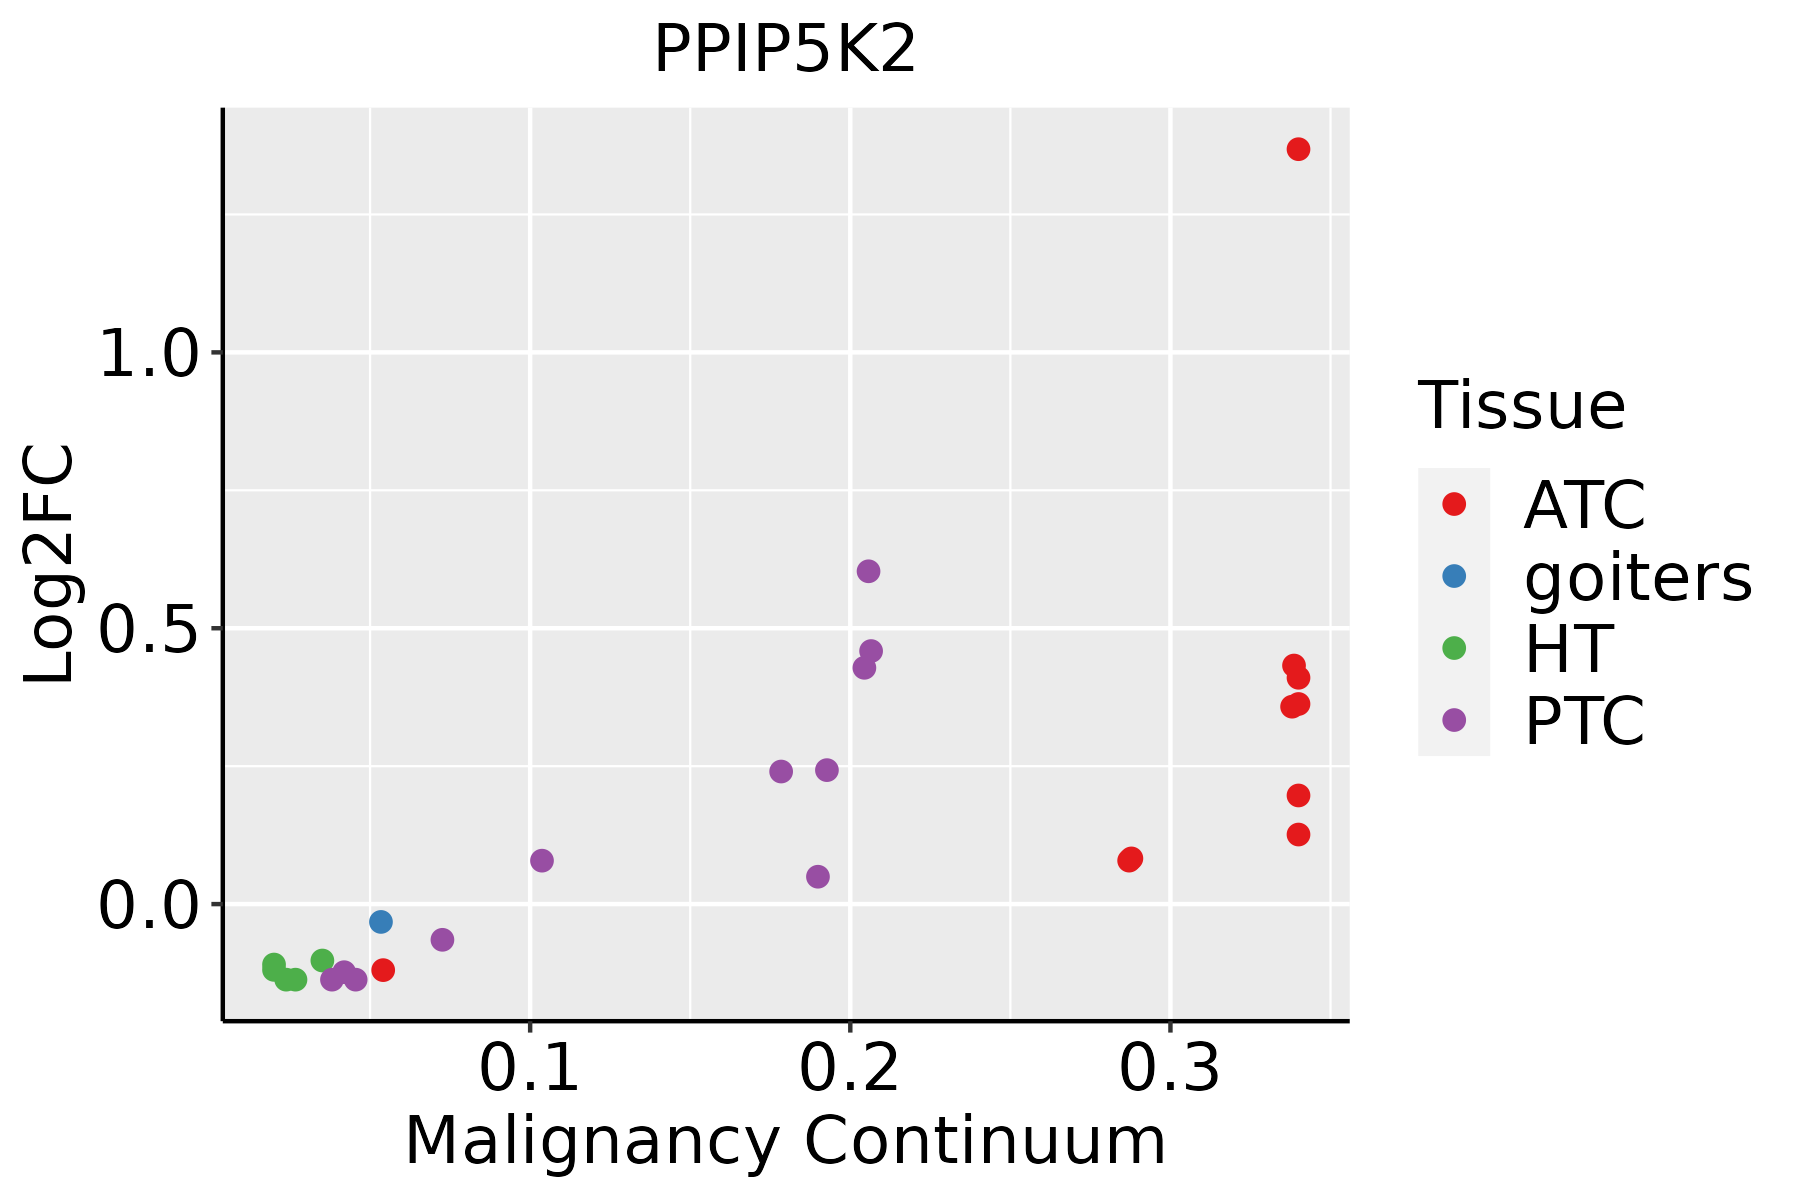 | ATC: Anaplastic thyroid cancer |
| HT: Hashimoto's thyroiditis | ||
| PTC: Papillary thyroid cancer |
| ∗log2FC in expression of this searched gene in stem-like cells from each diseased tissue sample relative to stem-like cells in normal samples in each tissue plotted against the malignancy continuum. Samples are colored based on if they are from different disease stage. |
Top |
Malignant transformation related pathway analysis |
| Find out the enriched GO biological processes and KEGG pathways involved in transition from healthy to precancer to cancer |
| Tissue | Disease Stage | Enriched GO biological Processes |
| Colorectum | AD |  |
| Colorectum | SER |  |
| Colorectum | MSS |  |
| Colorectum | MSI-H |  |
| Colorectum | FAP |  |
| ∗Top 15 enriched GO BP terms are showed in the bar plot of each disease state in each tissue. Each row represents a significant GO biological process which is colored according to the -log10(p.adjust). |
| Page: 1 2 3 4 5 6 7 8 9 |
| GO ID | Tissue | Disease Stage | Description | Gene Ratio | Bg Ratio | pvalue | p.adjust | Count |
| GO:0006066 | Colorectum | AD | alcohol metabolic process | 106/3918 | 353/18723 | 3.02e-05 | 5.57e-04 | 106 |
| GO:0044262 | Colorectum | AD | cellular carbohydrate metabolic process | 87/3918 | 283/18723 | 6.00e-05 | 1.01e-03 | 87 |
| GO:00060661 | Colorectum | SER | alcohol metabolic process | 79/2897 | 353/18723 | 3.50e-04 | 5.50e-03 | 79 |
| GO:00060662 | Colorectum | MSS | alcohol metabolic process | 92/3467 | 353/18723 | 2.57e-04 | 3.46e-03 | 92 |
| GO:00442621 | Colorectum | FAP | cellular carbohydrate metabolic process | 66/2622 | 283/18723 | 1.53e-05 | 4.01e-04 | 66 |
| GO:00060663 | Colorectum | FAP | alcohol metabolic process | 69/2622 | 353/18723 | 2.29e-03 | 1.85e-02 | 69 |
| GO:00442622 | Colorectum | CRC | cellular carbohydrate metabolic process | 49/2078 | 283/18723 | 1.06e-03 | 1.24e-02 | 49 |
| GO:00060664 | Colorectum | CRC | alcohol metabolic process | 57/2078 | 353/18723 | 2.37e-03 | 2.27e-02 | 57 |
| GO:0019751 | Colorectum | CRC | polyol metabolic process | 22/2078 | 114/18723 | 6.73e-03 | 4.77e-02 | 22 |
| GO:00060668 | Esophagus | ESCC | alcohol metabolic process | 202/8552 | 353/18723 | 7.32e-06 | 7.26e-05 | 202 |
| GO:00442626 | Esophagus | ESCC | cellular carbohydrate metabolic process | 160/8552 | 283/18723 | 1.43e-04 | 9.66e-04 | 160 |
| GO:00461653 | Esophagus | ESCC | alcohol biosynthetic process | 83/8552 | 140/18723 | 8.04e-04 | 4.16e-03 | 83 |
| GO:19016174 | Esophagus | ESCC | organic hydroxy compound biosynthetic process | 128/8552 | 237/18723 | 5.86e-03 | 2.16e-02 | 128 |
| GO:000606621 | Liver | HCC | alcohol metabolic process | 208/7958 | 353/18723 | 2.80e-10 | 9.50e-09 | 208 |
| GO:004426221 | Liver | HCC | cellular carbohydrate metabolic process | 153/7958 | 283/18723 | 5.27e-05 | 5.00e-04 | 153 |
| GO:19016172 | Liver | HCC | organic hydroxy compound biosynthetic process | 129/7958 | 237/18723 | 1.32e-04 | 1.08e-03 | 129 |
| GO:00461651 | Liver | HCC | alcohol biosynthetic process | 81/7958 | 140/18723 | 1.73e-04 | 1.36e-03 | 81 |
| Page: 1 |
| Pathway ID | Tissue | Disease Stage | Description | Gene Ratio | Bg Ratio | pvalue | p.adjust | qvalue | Count |
| hsa04070 | Colorectum | CRC | Phosphatidylinositol signaling system | 25/1091 | 97/8465 | 4.27e-04 | 4.60e-03 | 3.12e-03 | 25 |
| hsa040701 | Colorectum | CRC | Phosphatidylinositol signaling system | 25/1091 | 97/8465 | 4.27e-04 | 4.60e-03 | 3.12e-03 | 25 |
| Page: 1 |
Top |
Cell-cell communication analysis |
| Identification of potential cell-cell interactions between two cell types and their ligand-receptor pairs for different disease states |
| Ligand | Receptor | LRpair | Pathway | Tissue | Disease Stage |
| Page: 1 |
Top |
Single-cell gene regulatory network inference analysis |
| Find out the significant the regulons (TFs) and the target genes of each regulon across cell types for different disease states |
| TF | Cell Type | Tissue | Disease Stage | Target Gene | RSS | Regulon Activity |
| ∗The dot plots of a searched regulon are shown for all cell subpopulations in each disease state of each tissue based on the regulon specific score inferred using pySCENIC and by calculating the average expression. |
| Page: 1 |
Top |
Somatic mutation of malignant transformation related genes |
| Annotation of somatic variants for genes involved in malignant transformation |
| Hugo Symbol | Variant Class | Variant Classification | dbSNP RS | HGVSc | HGVSp | HGVSp Short | SWISSPROT | BIOTYPE | SIFT | PolyPhen | Tumor Sample Barcode | Tissue | Histology | Sex | Age | Stage | Therapy Types | Drugs | Outcome |
| PPIP5K2 | SNV | Missense_Mutation | novel | c.2905G>A | p.Glu969Lys | p.E969K | protein_coding | deleterious_low_confidence(0) | benign(0.253) | TCGA-5L-AAT0-01 | Breast | breast invasive carcinoma | Female | <65 | I/II | Hormone Therapy | tamoxiphen | SD | |
| PPIP5K2 | SNV | Missense_Mutation | c.866N>A | p.Arg289Gln | p.R289Q | protein_coding | tolerated(0.48) | probably_damaging(0.98) | TCGA-A8-A0A7-01 | Breast | breast invasive carcinoma | Female | <65 | I/II | Unknown | Unknown | SD | ||
| PPIP5K2 | SNV | Missense_Mutation | c.3699N>C | p.Lys1233Asn | p.K1233N | protein_coding | tolerated_low_confidence(0.39) | benign(0.363) | TCGA-AC-A23H-01 | Breast | breast invasive carcinoma | Female | >=65 | I/II | Unknown | Unknown | PD | ||
| PPIP5K2 | SNV | Missense_Mutation | rs782492973 | c.2359N>T | p.Arg787Cys | p.R787C | protein_coding | deleterious(0) | probably_damaging(0.998) | TCGA-AN-A046-01 | Breast | breast invasive carcinoma | Female | >=65 | I/II | Unknown | Unknown | SD | |
| PPIP5K2 | SNV | Missense_Mutation | c.3092N>T | p.Ser1031Phe | p.S1031F | protein_coding | deleterious_low_confidence(0.01) | possibly_damaging(0.837) | TCGA-BH-A18P-01 | Breast | breast invasive carcinoma | Female | <65 | I/II | Unknown | Unknown | PD | ||
| PPIP5K2 | SNV | Missense_Mutation | c.700N>C | p.Tyr234His | p.Y234H | protein_coding | deleterious(0) | probably_damaging(0.999) | TCGA-C8-A26Y-01 | Breast | breast invasive carcinoma | Female | >=65 | I/II | Unknown | Unknown | SD | ||
| PPIP5K2 | SNV | Missense_Mutation | c.3585G>C | p.Lys1195Asn | p.K1195N | protein_coding | tolerated_low_confidence(0.25) | benign(0.07) | TCGA-D8-A147-01 | Breast | breast invasive carcinoma | Female | <65 | I/II | Chemotherapy | doxorubicine | SD | ||
| PPIP5K2 | insertion | Frame_Shift_Ins | novel | c.1260_1261insTTTTC | p.Lys421PhefsTer4 | p.K421Ffs*4 | protein_coding | TCGA-AR-A0U0-01 | Breast | breast invasive carcinoma | Female | >=65 | I/II | Unknown | Unknown | SD | |||
| PPIP5K2 | deletion | Frame_Shift_Del | rs782113272 | c.3818delA | p.Asn1273ThrfsTer35 | p.N1273Tfs*35 | protein_coding | TCGA-BH-A18G-01 | Breast | breast invasive carcinoma | Female | >=65 | I/II | Unknown | Unknown | SD | |||
| PPIP5K2 | SNV | Missense_Mutation | novel | c.1225N>C | p.Asp409His | p.D409H | protein_coding | deleterious(0) | probably_damaging(0.999) | TCGA-C5-A2LZ-01 | Cervix | cervical & endocervical cancer | Female | >=65 | III/IV | Unknown | Unknown | PD |
| Page: 1 2 3 4 5 6 7 8 9 10 11 12 13 |
Top |
Related drugs of malignant transformation related genes |
| Identification of chemicals and drugs interact with genes involved in malignant transfromation |
| (DGIdb 4.0) |
| Entrez ID | Symbol | Category | Interaction Types | Drug Claim Name | Drug Name | PMIDs |
| Page: 1 |

Copyright 2023-Present -The University of Texas Health Science Center at Houston |