
|
|||||
|
 | |
| |
| |
| |
| |
| |
|
Gene: PPIL4 |
Gene summary for PPIL4 |
| Gene information | Species | Human | Gene symbol | PPIL4 | Gene ID | 85313 |
| Gene name | peptidylprolyl isomerase like 4 | |
| Gene Alias | HDCME13P | |
| Cytomap | 6q25.1 | |
| Gene Type | protein-coding | GO ID | GO:0000413 | UniProtAcc | Q8WUA2 |
Top |
Malignant transformation analysis |
| Identification of the aberrant gene expression in precancerous and cancerous lesions by comparing the gene expression of stem-like cells in diseased tissues with normal stem cells |
| Entrez ID | Symbol | Replicates | Species | Organ | Tissue | Adj P-value | Log2FC | Malignancy |
| 85313 | PPIL4 | LZE4T | Human | Esophagus | ESCC | 2.82e-14 | 4.19e-01 | 0.0811 |
| 85313 | PPIL4 | LZE7T | Human | Esophagus | ESCC | 3.01e-08 | 4.73e-01 | 0.0667 |
| 85313 | PPIL4 | LZE20T | Human | Esophagus | ESCC | 3.76e-04 | 2.27e-02 | 0.0662 |
| 85313 | PPIL4 | LZE24T | Human | Esophagus | ESCC | 6.18e-20 | 4.94e-01 | 0.0596 |
| 85313 | PPIL4 | LZE21T | Human | Esophagus | ESCC | 1.68e-05 | 2.03e-01 | 0.0655 |
| 85313 | PPIL4 | LZE6T | Human | Esophagus | ESCC | 5.98e-03 | 1.77e-01 | 0.0845 |
| 85313 | PPIL4 | P1T-E | Human | Esophagus | ESCC | 9.49e-08 | 3.28e-01 | 0.0875 |
| 85313 | PPIL4 | P2T-E | Human | Esophagus | ESCC | 4.52e-31 | 5.23e-01 | 0.1177 |
| 85313 | PPIL4 | P4T-E | Human | Esophagus | ESCC | 4.12e-24 | 6.53e-01 | 0.1323 |
| 85313 | PPIL4 | P5T-E | Human | Esophagus | ESCC | 1.32e-24 | 5.39e-01 | 0.1327 |
| 85313 | PPIL4 | P8T-E | Human | Esophagus | ESCC | 4.10e-26 | 4.36e-01 | 0.0889 |
| 85313 | PPIL4 | P9T-E | Human | Esophagus | ESCC | 1.65e-11 | 2.25e-01 | 0.1131 |
| 85313 | PPIL4 | P10T-E | Human | Esophagus | ESCC | 1.05e-21 | 3.98e-01 | 0.116 |
| 85313 | PPIL4 | P11T-E | Human | Esophagus | ESCC | 1.23e-09 | 5.33e-01 | 0.1426 |
| 85313 | PPIL4 | P12T-E | Human | Esophagus | ESCC | 1.22e-23 | 4.94e-01 | 0.1122 |
| 85313 | PPIL4 | P15T-E | Human | Esophagus | ESCC | 2.17e-24 | 5.71e-01 | 0.1149 |
| 85313 | PPIL4 | P16T-E | Human | Esophagus | ESCC | 2.37e-51 | 9.63e-01 | 0.1153 |
| 85313 | PPIL4 | P17T-E | Human | Esophagus | ESCC | 6.98e-09 | 3.50e-01 | 0.1278 |
| 85313 | PPIL4 | P19T-E | Human | Esophagus | ESCC | 1.68e-06 | 5.54e-01 | 0.1662 |
| 85313 | PPIL4 | P20T-E | Human | Esophagus | ESCC | 5.69e-18 | 4.18e-01 | 0.1124 |
| Page: 1 2 3 4 5 |
| Tissue | Expression Dynamics | Abbreviation |
| Esophagus |  | ESCC: Esophageal squamous cell carcinoma |
| HGIN: High-grade intraepithelial neoplasias | ||
| LGIN: Low-grade intraepithelial neoplasias | ||
| Liver | 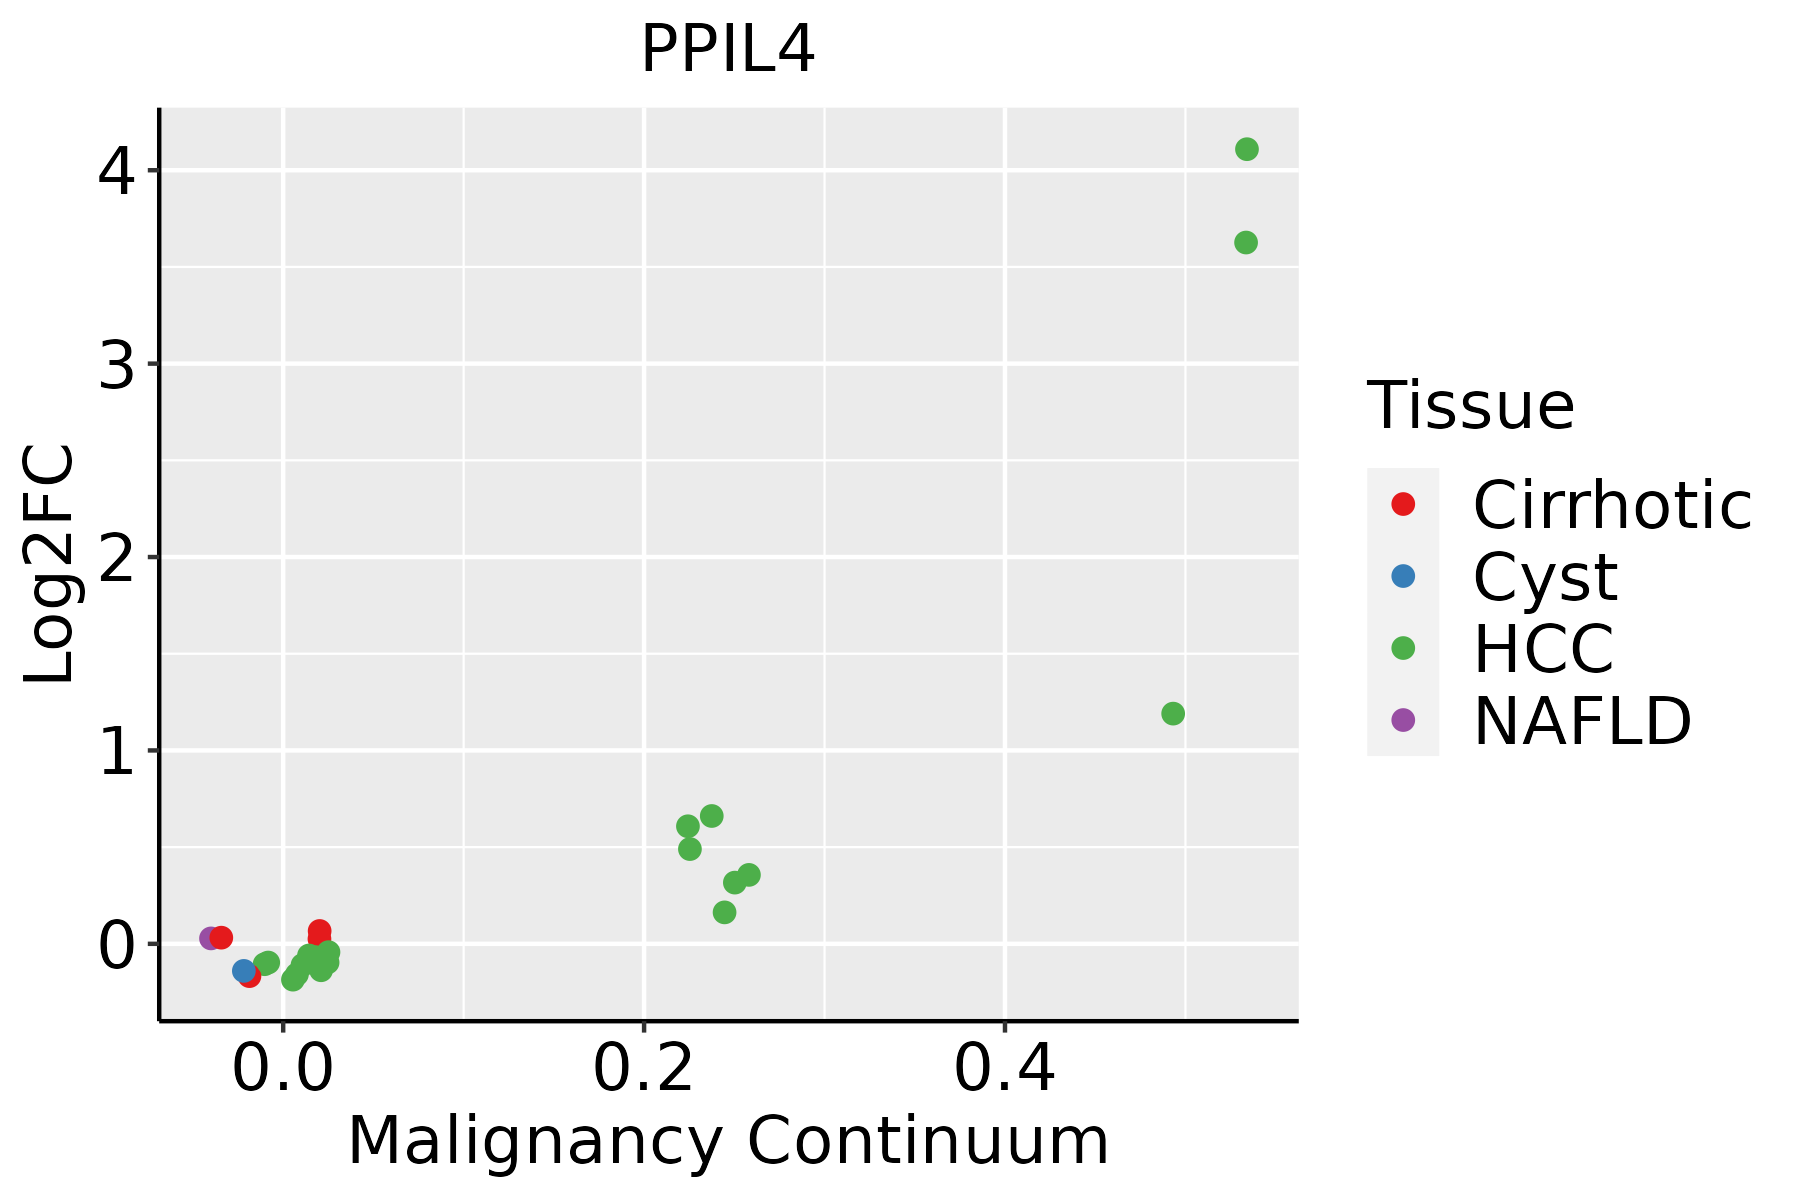 | HCC: Hepatocellular carcinoma |
| NAFLD: Non-alcoholic fatty liver disease | ||
| Skin | 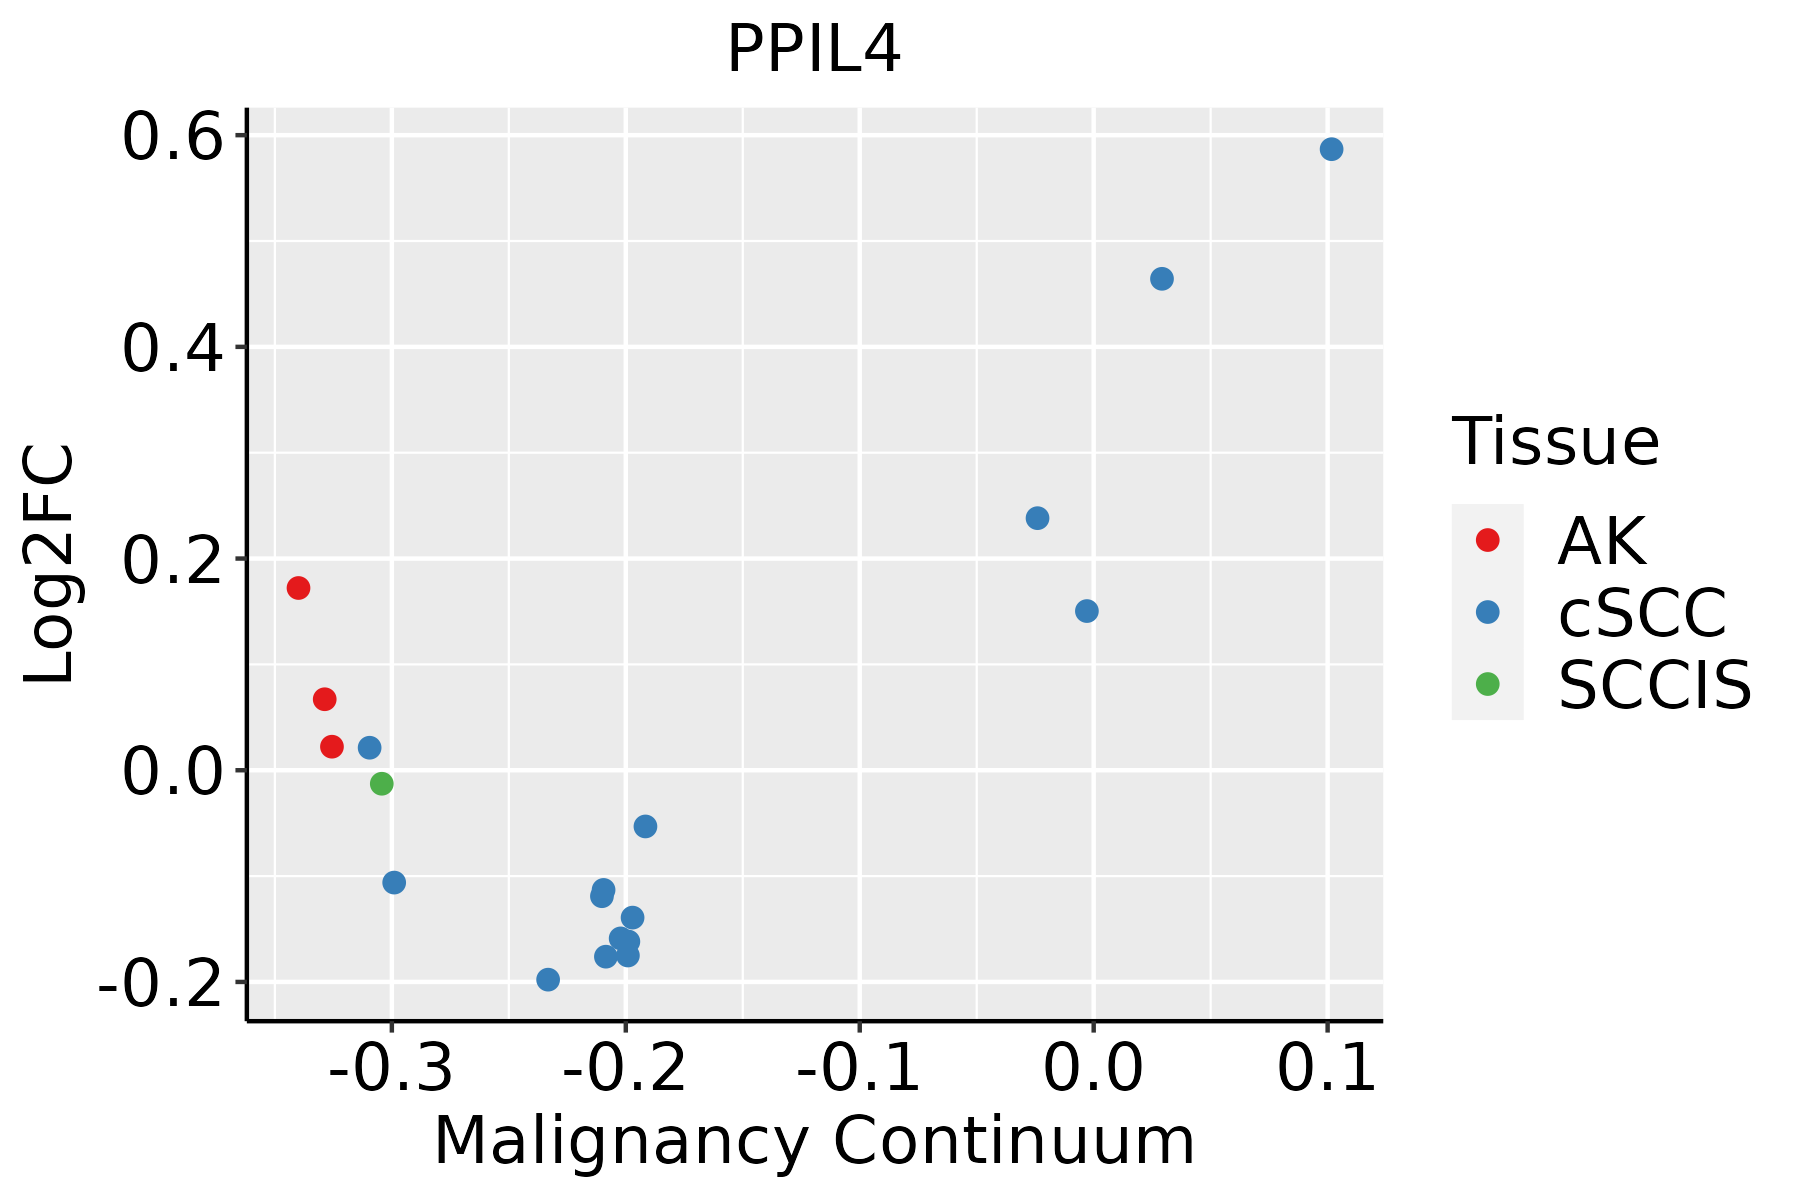 | AK: Actinic keratosis |
| cSCC: Cutaneous squamous cell carcinoma | ||
| SCCIS:squamous cell carcinoma in situ | ||
| Thyroid |  | ATC: Anaplastic thyroid cancer |
| HT: Hashimoto's thyroiditis | ||
| PTC: Papillary thyroid cancer |
| ∗log2FC in expression of this searched gene in stem-like cells from each diseased tissue sample relative to stem-like cells in normal samples in each tissue plotted against the malignancy continuum. Samples are colored based on if they are from different disease stage. |
Top |
Malignant transformation related pathway analysis |
| Find out the enriched GO biological processes and KEGG pathways involved in transition from healthy to precancer to cancer |
| Tissue | Disease Stage | Enriched GO biological Processes |
| Colorectum | AD |  |
| Colorectum | SER |  |
| Colorectum | MSS |  |
| Colorectum | MSI-H |  |
| Colorectum | FAP |  |
| ∗Top 15 enriched GO BP terms are showed in the bar plot of each disease state in each tissue. Each row represents a significant GO biological process which is colored according to the -log10(p.adjust). |
| Page: 1 2 3 4 5 6 7 8 9 |
| GO ID | Tissue | Disease Stage | Description | Gene Ratio | Bg Ratio | pvalue | p.adjust | Count |
| GO:001820816 | Esophagus | ESCC | peptidyl-proline modification | 46/8552 | 58/18723 | 1.59e-07 | 2.51e-06 | 46 |
| GO:000041313 | Esophagus | ESCC | protein peptidyl-prolyl isomerization | 32/8552 | 42/18723 | 5.52e-05 | 4.27e-04 | 32 |
| GO:00708161 | Esophagus | ESCC | phosphorylation of RNA polymerase II C-terminal domain | 12/8552 | 12/18723 | 8.21e-05 | 6.01e-04 | 12 |
| GO:00182084 | Liver | Cirrhotic | peptidyl-proline modification | 26/4634 | 58/18723 | 6.65e-04 | 5.04e-03 | 26 |
| GO:00004132 | Liver | Cirrhotic | protein peptidyl-prolyl isomerization | 19/4634 | 42/18723 | 3.00e-03 | 1.71e-02 | 19 |
| GO:001820811 | Liver | HCC | peptidyl-proline modification | 42/7958 | 58/18723 | 3.73e-06 | 4.85e-05 | 42 |
| GO:00004131 | Liver | HCC | protein peptidyl-prolyl isomerization | 31/7958 | 42/18723 | 3.83e-05 | 3.80e-04 | 31 |
| GO:001820810 | Skin | cSCC | peptidyl-proline modification | 37/4864 | 58/18723 | 1.53e-09 | 5.82e-08 | 37 |
| GO:00004136 | Skin | cSCC | protein peptidyl-prolyl isomerization | 26/4864 | 42/18723 | 9.92e-07 | 1.78e-05 | 26 |
| GO:007081611 | Skin | cSCC | phosphorylation of RNA polymerase II C-terminal domain | 11/4864 | 12/18723 | 3.30e-06 | 5.08e-05 | 11 |
| GO:001820817 | Thyroid | PTC | peptidyl-proline modification | 42/5968 | 58/18723 | 2.71e-10 | 8.91e-09 | 42 |
| GO:00004137 | Thyroid | PTC | protein peptidyl-prolyl isomerization | 30/5968 | 42/18723 | 1.65e-07 | 3.13e-06 | 30 |
| GO:001820818 | Thyroid | ATC | peptidyl-proline modification | 42/6293 | 58/18723 | 1.70e-09 | 4.21e-08 | 42 |
| GO:000041314 | Thyroid | ATC | protein peptidyl-prolyl isomerization | 30/6293 | 42/18723 | 6.06e-07 | 8.44e-06 | 30 |
| Page: 1 |
| Pathway ID | Tissue | Disease Stage | Description | Gene Ratio | Bg Ratio | pvalue | p.adjust | qvalue | Count |
| Page: 1 |
Top |
Cell-cell communication analysis |
| Identification of potential cell-cell interactions between two cell types and their ligand-receptor pairs for different disease states |
| Ligand | Receptor | LRpair | Pathway | Tissue | Disease Stage |
| Page: 1 |
Top |
Single-cell gene regulatory network inference analysis |
| Find out the significant the regulons (TFs) and the target genes of each regulon across cell types for different disease states |
| TF | Cell Type | Tissue | Disease Stage | Target Gene | RSS | Regulon Activity |
| ∗The dot plots of a searched regulon are shown for all cell subpopulations in each disease state of each tissue based on the regulon specific score inferred using pySCENIC and by calculating the average expression. |
| Page: 1 |
Top |
Somatic mutation of malignant transformation related genes |
| Annotation of somatic variants for genes involved in malignant transformation |
| Hugo Symbol | Variant Class | Variant Classification | dbSNP RS | HGVSc | HGVSp | HGVSp Short | SWISSPROT | BIOTYPE | SIFT | PolyPhen | Tumor Sample Barcode | Tissue | Histology | Sex | Age | Stage | Therapy Types | Drugs | Outcome |
| PPIL4 | SNV | Missense_Mutation | rs769253589 | c.721N>A | p.Val241Ile | p.V241I | Q8WUA2 | protein_coding | deleterious(0.04) | benign(0.152) | TCGA-BH-A202-01 | Breast | breast invasive carcinoma | Female | <65 | I/II | Chemotherapy | carboplatin | CR |
| PPIL4 | SNV | Missense_Mutation | rs755983989 | c.181N>T | p.Arg61Cys | p.R61C | Q8WUA2 | protein_coding | tolerated(0.08) | possibly_damaging(0.877) | TCGA-E2-A15H-01 | Breast | breast invasive carcinoma | Female | <65 | I/II | Chemotherapy | herceptin | SD |
| PPIL4 | SNV | Missense_Mutation | c.1293G>T | p.Lys431Asn | p.K431N | Q8WUA2 | protein_coding | tolerated(0.14) | probably_damaging(0.95) | TCGA-2W-A8YY-01 | Cervix | cervical & endocervical cancer | Female | <65 | I/II | Chemotherapy | cisplatin | CR | |
| PPIL4 | SNV | Missense_Mutation | rs761631618 | c.1334N>A | p.Arg445Gln | p.R445Q | Q8WUA2 | protein_coding | tolerated(0.12) | benign(0.078) | TCGA-C5-A8XH-01 | Cervix | cervical & endocervical cancer | Female | <65 | I/II | Unknown | Unknown | SD |
| PPIL4 | SNV | Missense_Mutation | c.389N>T | p.Thr130Ile | p.T130I | Q8WUA2 | protein_coding | deleterious(0) | possibly_damaging(0.701) | TCGA-AA-3864-01 | Colorectum | colon adenocarcinoma | Male | >=65 | I/II | Unknown | Unknown | SD | |
| PPIL4 | SNV | Missense_Mutation | c.991T>C | p.Tyr331His | p.Y331H | Q8WUA2 | protein_coding | tolerated(0.24) | probably_damaging(0.973) | TCGA-AA-3950-01 | Colorectum | colon adenocarcinoma | Female | >=65 | I/II | Unknown | Unknown | SD | |
| PPIL4 | SNV | Missense_Mutation | c.989N>C | p.Lys330Thr | p.K330T | Q8WUA2 | protein_coding | tolerated(0.2) | benign(0.154) | TCGA-AA-3984-01 | Colorectum | colon adenocarcinoma | Female | <65 | I/II | Unknown | Unknown | SD | |
| PPIL4 | SNV | Missense_Mutation | c.991N>A | p.Tyr331Asn | p.Y331N | Q8WUA2 | protein_coding | tolerated(0.07) | probably_damaging(0.973) | TCGA-CK-4951-01 | Colorectum | colon adenocarcinoma | Female | >=65 | I/II | Unknown | Unknown | PD | |
| PPIL4 | SNV | Missense_Mutation | c.563G>T | p.Ser188Ile | p.S188I | Q8WUA2 | protein_coding | deleterious(0.02) | possibly_damaging(0.841) | TCGA-D5-6930-01 | Colorectum | colon adenocarcinoma | Male | >=65 | I/II | Unknown | Unknown | SD | |
| PPIL4 | deletion | Frame_Shift_Del | novel | c.897_898delNN | p.Phe299LeufsTer9 | p.F299Lfs*9 | Q8WUA2 | protein_coding | TCGA-AA-A01D-01 | Colorectum | colon adenocarcinoma | Female | <65 | III/IV | Chemotherapy | capecitabine | PD |
| Page: 1 2 3 4 5 6 |
Top |
Related drugs of malignant transformation related genes |
| Identification of chemicals and drugs interact with genes involved in malignant transfromation |
| (DGIdb 4.0) |
| Entrez ID | Symbol | Category | Interaction Types | Drug Claim Name | Drug Name | PMIDs |
| Page: 1 |

Copyright 2023-Present -The University of Texas Health Science Center at Houston |