
|
|||||
|
 | |
| |
| |
| |
| |
| |
|
Gene: PPIG |
Gene summary for PPIG |
| Gene information | Species | Human | Gene symbol | PPIG | Gene ID | 9360 |
| Gene name | peptidylprolyl isomerase G | |
| Gene Alias | CARS-Cyp | |
| Cytomap | 2q31.1 | |
| Gene Type | protein-coding | GO ID | GO:0000413 | UniProtAcc | Q13427 |
Top |
Malignant transformation analysis |
| Identification of the aberrant gene expression in precancerous and cancerous lesions by comparing the gene expression of stem-like cells in diseased tissues with normal stem cells |
| Entrez ID | Symbol | Replicates | Species | Organ | Tissue | Adj P-value | Log2FC | Malignancy |
| 9360 | PPIG | AEH-subject1 | Human | Endometrium | AEH | 1.39e-08 | -2.77e-01 | -0.3059 |
| 9360 | PPIG | AEH-subject2 | Human | Endometrium | AEH | 1.89e-05 | -2.09e-01 | -0.2525 |
| 9360 | PPIG | AEH-subject3 | Human | Endometrium | AEH | 2.60e-06 | -1.47e-01 | -0.2576 |
| 9360 | PPIG | AEH-subject4 | Human | Endometrium | AEH | 9.03e-03 | -2.07e-01 | -0.2657 |
| 9360 | PPIG | AEH-subject5 | Human | Endometrium | AEH | 1.60e-03 | -1.65e-01 | -0.2953 |
| 9360 | PPIG | EEC-subject1 | Human | Endometrium | EEC | 1.14e-07 | -2.39e-01 | -0.2682 |
| 9360 | PPIG | EEC-subject2 | Human | Endometrium | EEC | 2.79e-15 | -2.82e-01 | -0.2607 |
| 9360 | PPIG | EEC-subject3 | Human | Endometrium | EEC | 5.49e-29 | -3.99e-01 | -0.2525 |
| 9360 | PPIG | EEC-subject4 | Human | Endometrium | EEC | 3.82e-06 | -2.45e-01 | -0.2571 |
| 9360 | PPIG | EEC-subject5 | Human | Endometrium | EEC | 3.13e-04 | -1.88e-01 | -0.249 |
| 9360 | PPIG | GSM5276934 | Human | Endometrium | EEC | 2.30e-02 | -9.28e-02 | -0.0913 |
| 9360 | PPIG | GSM6177620_NYU_UCEC1_lib1_lib1 | Human | Endometrium | EEC | 1.39e-32 | -2.32e-01 | -0.1869 |
| 9360 | PPIG | GSM6177620_NYU_UCEC1_lib2_lib2 | Human | Endometrium | EEC | 2.18e-29 | -3.69e-01 | -0.1875 |
| 9360 | PPIG | GSM6177620_NYU_UCEC1_lib3_lib3 | Human | Endometrium | EEC | 3.22e-35 | -2.16e-01 | -0.1883 |
| 9360 | PPIG | GSM6177621_NYU_UCEC2_lib1_lib1 | Human | Endometrium | EEC | 3.22e-34 | -9.91e-02 | -0.1934 |
| 9360 | PPIG | GSM6177622_NYU_UCEC3_lib1_lib1 | Human | Endometrium | EEC | 1.87e-54 | -1.65e-01 | -0.1917 |
| 9360 | PPIG | GSM6177622_NYU_UCEC3_lib2_lib2 | Human | Endometrium | EEC | 3.94e-47 | -4.19e-01 | -0.1916 |
| 9360 | PPIG | GSM6177623_NYU_UCEC3_Vis | Human | Endometrium | EEC | 1.39e-17 | -3.77e-01 | -0.1269 |
| 9360 | PPIG | LZE3D | Human | Esophagus | HGIN | 2.87e-04 | 5.53e-01 | 0.0668 |
| 9360 | PPIG | LZE4T | Human | Esophagus | ESCC | 1.71e-26 | 1.05e+00 | 0.0811 |
| Page: 1 2 3 4 5 6 7 8 9 |
| Tissue | Expression Dynamics | Abbreviation |
| Endometrium | 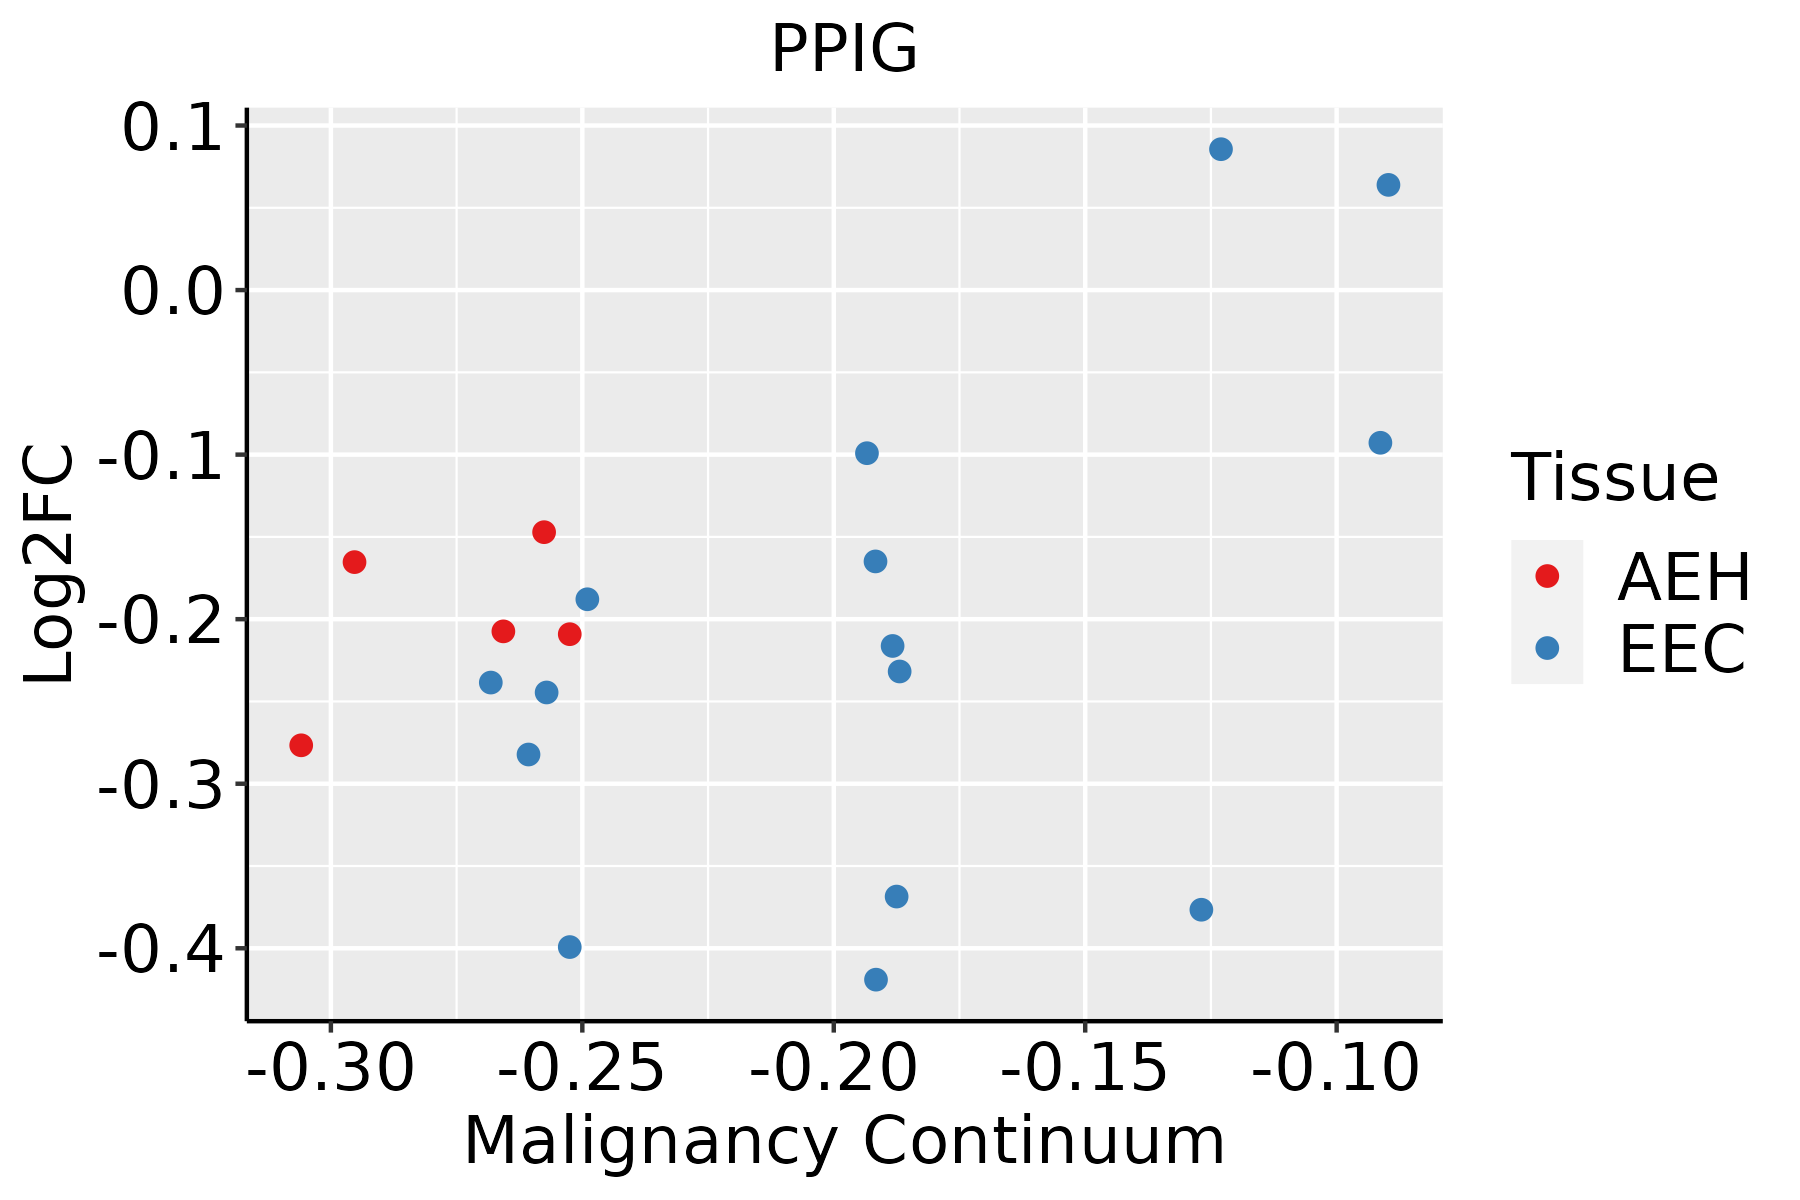 | AEH: Atypical endometrial hyperplasia |
| EEC: Endometrioid Cancer | ||
| Esophagus | 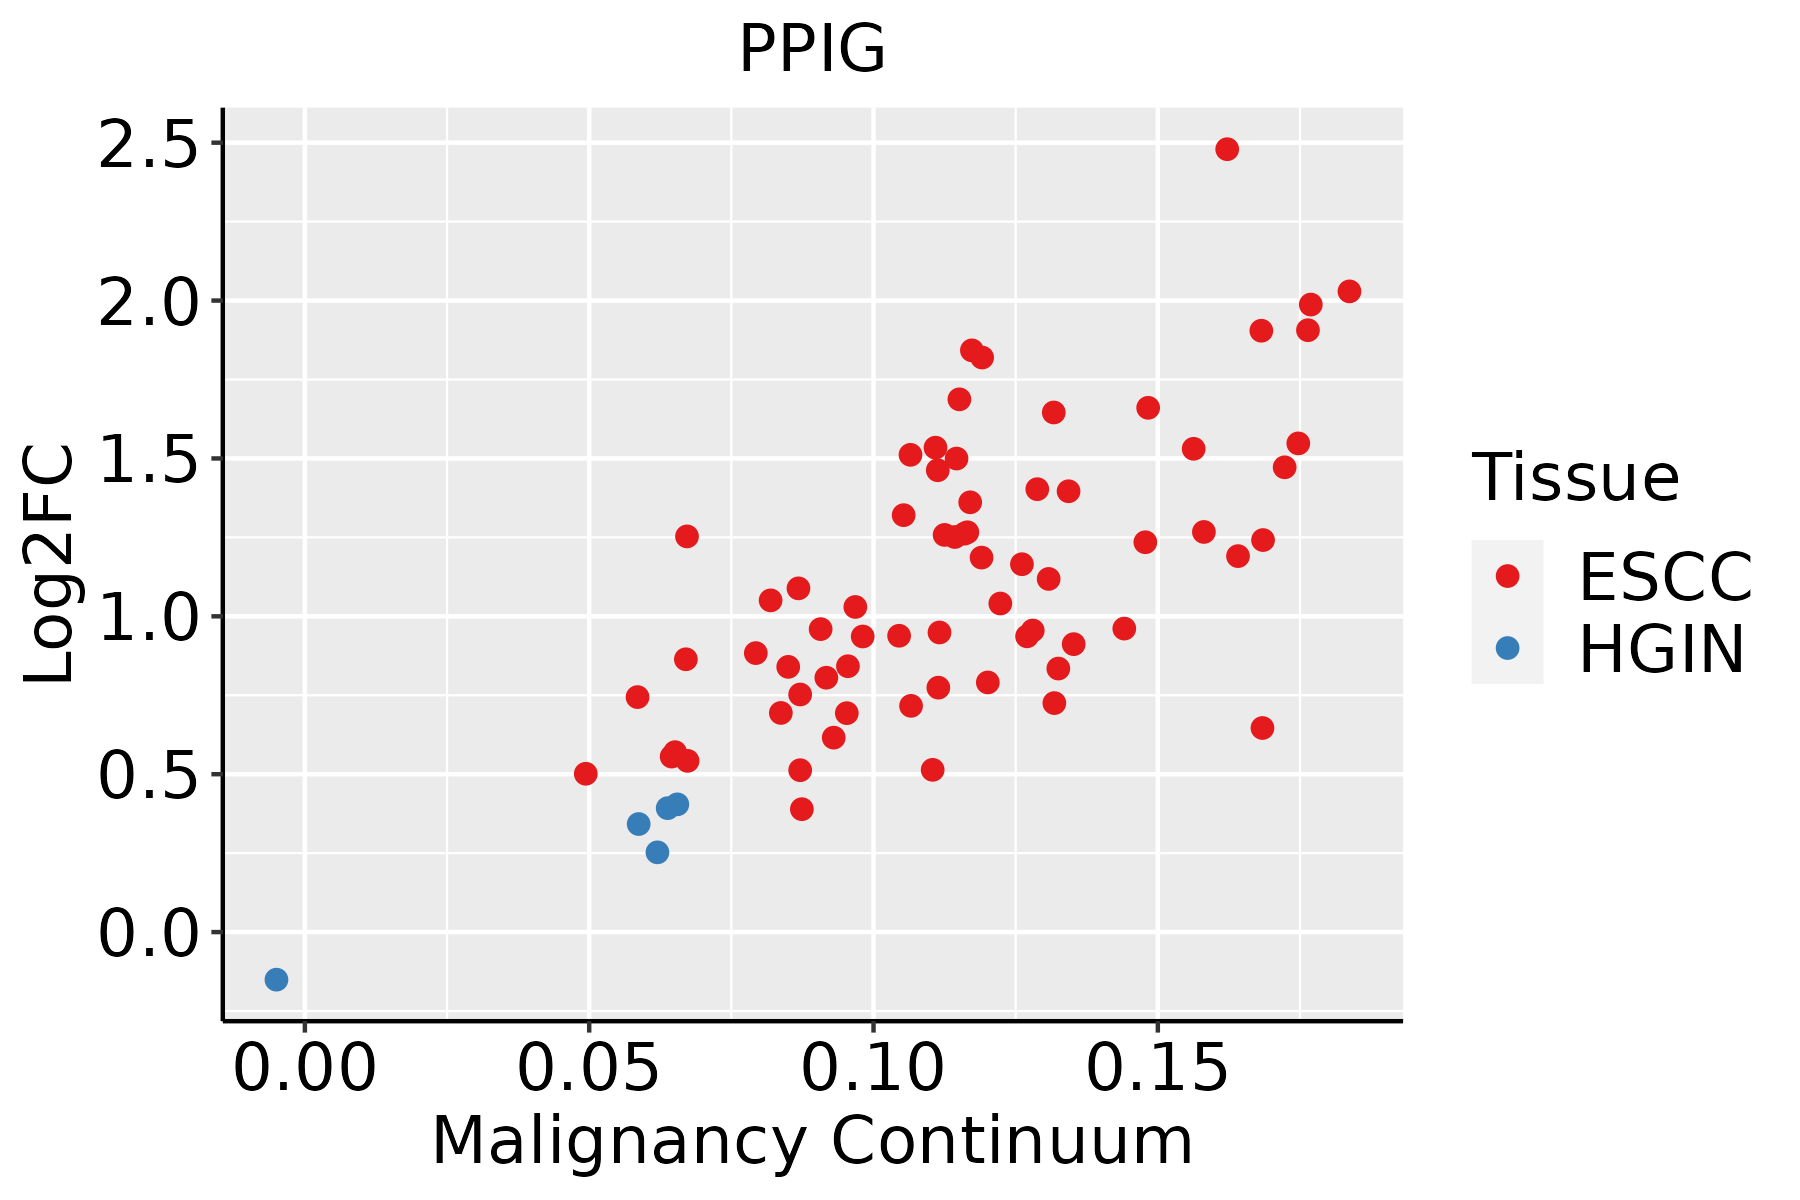 | ESCC: Esophageal squamous cell carcinoma |
| HGIN: High-grade intraepithelial neoplasias | ||
| LGIN: Low-grade intraepithelial neoplasias | ||
| Liver | 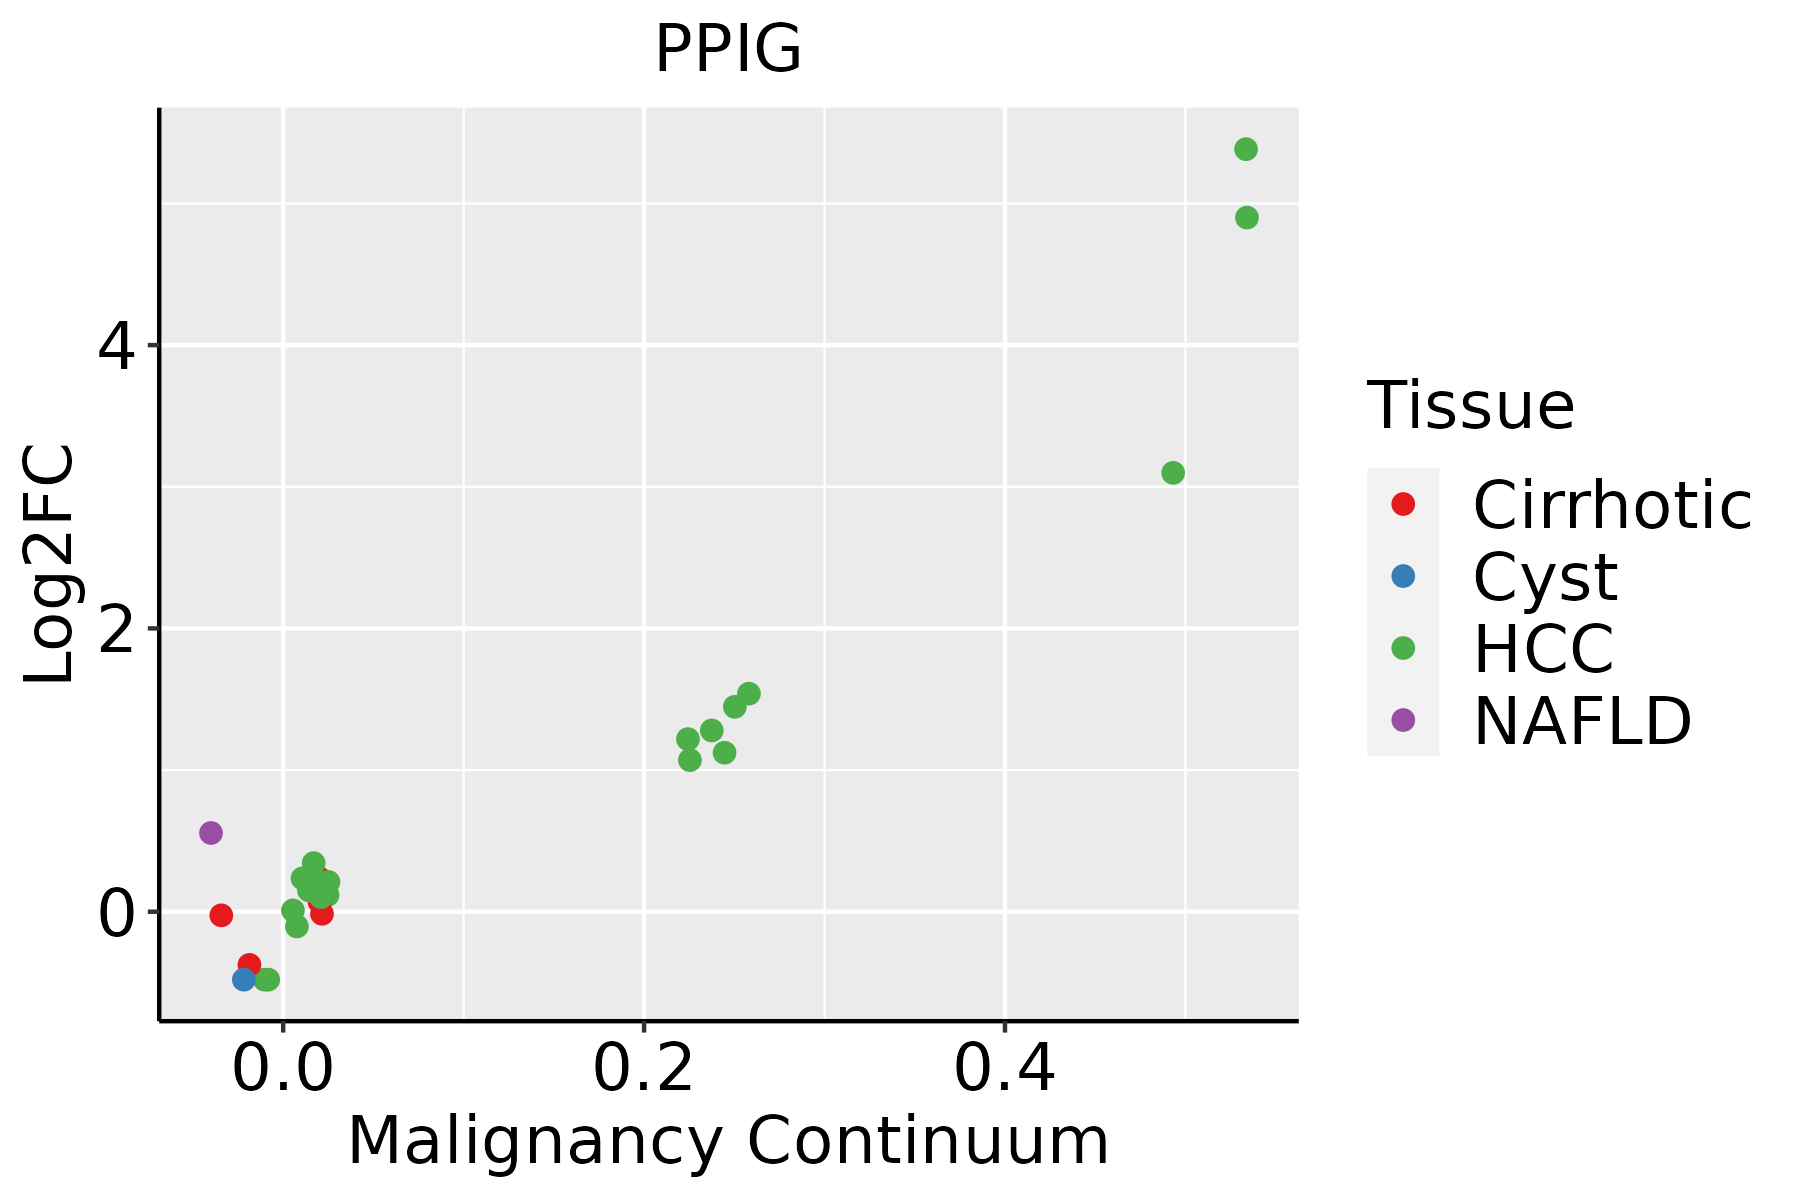 | HCC: Hepatocellular carcinoma |
| NAFLD: Non-alcoholic fatty liver disease | ||
| Oral Cavity | 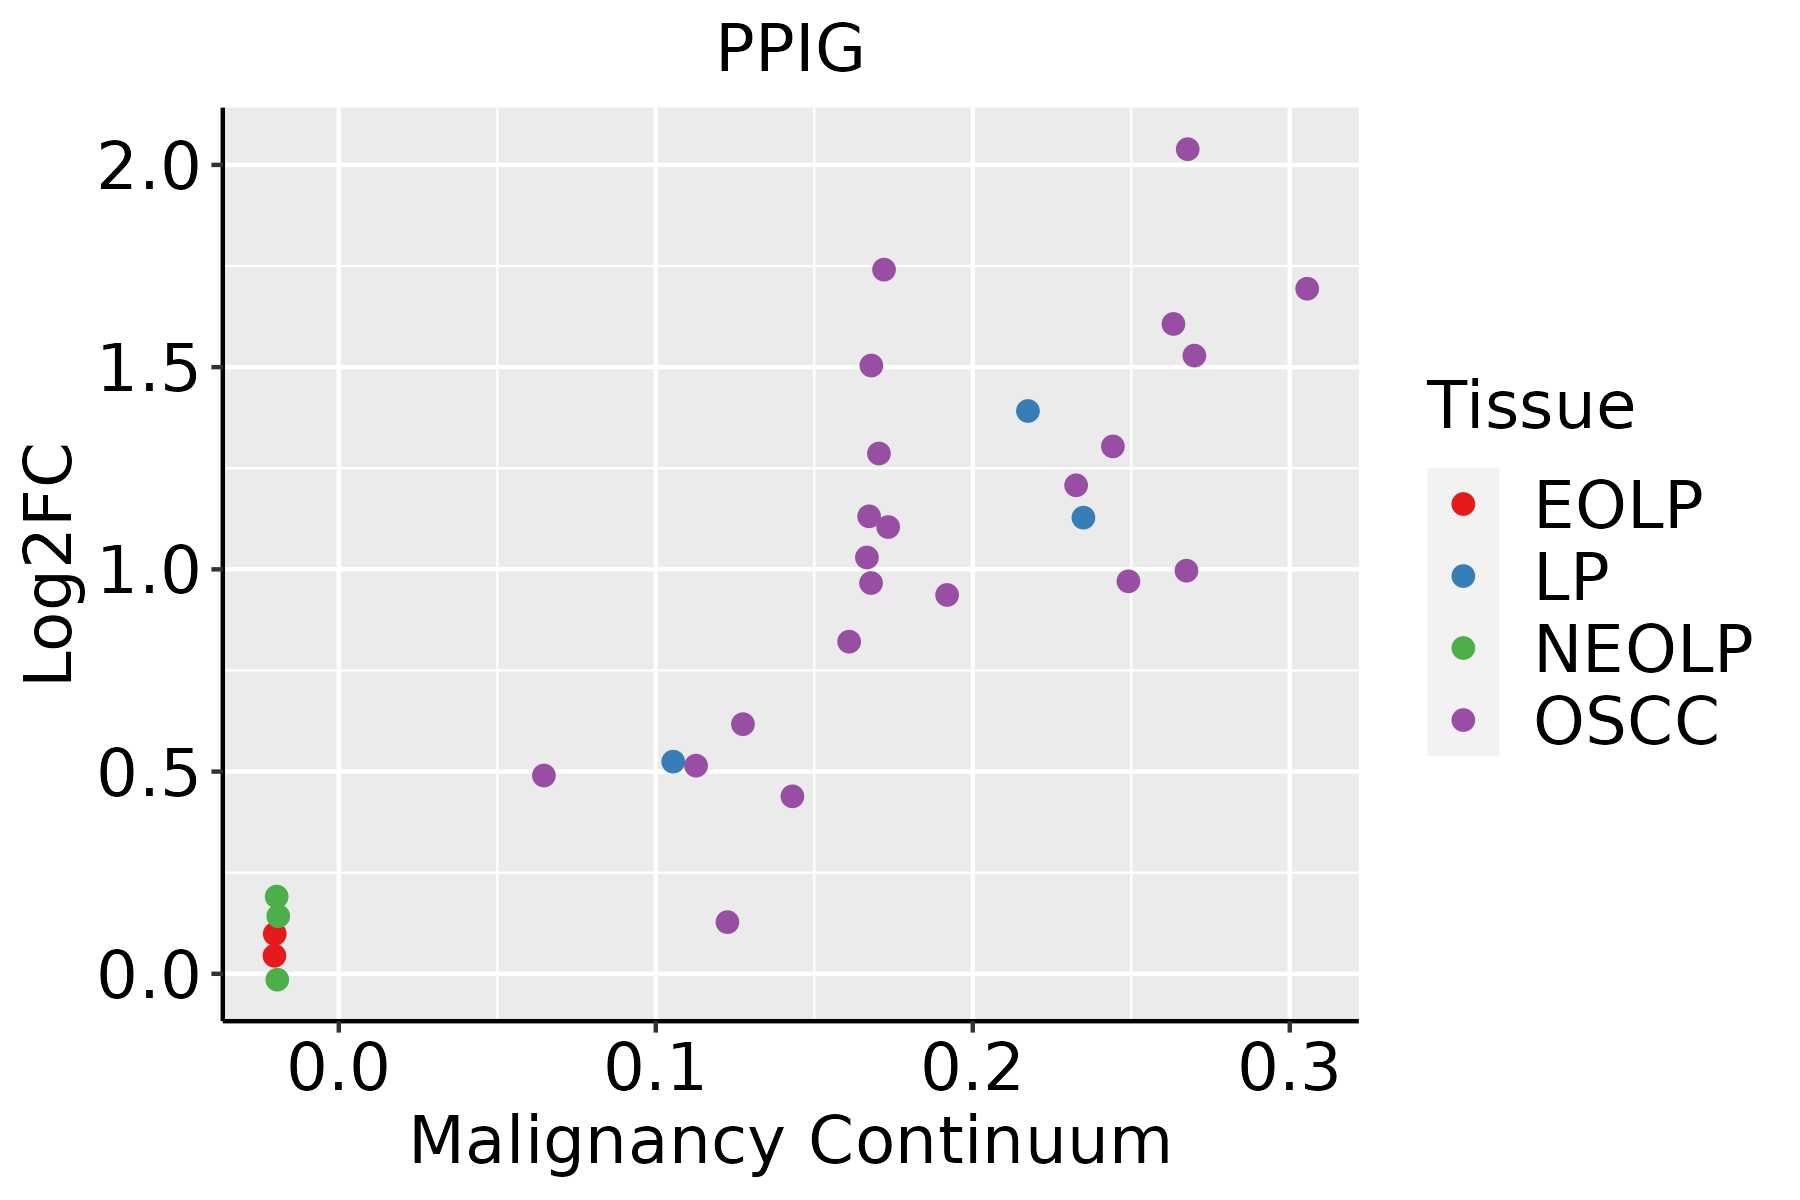 | EOLP: Erosive Oral lichen planus |
| LP: leukoplakia | ||
| NEOLP: Non-erosive oral lichen planus | ||
| OSCC: Oral squamous cell carcinoma | ||
| Prostate | 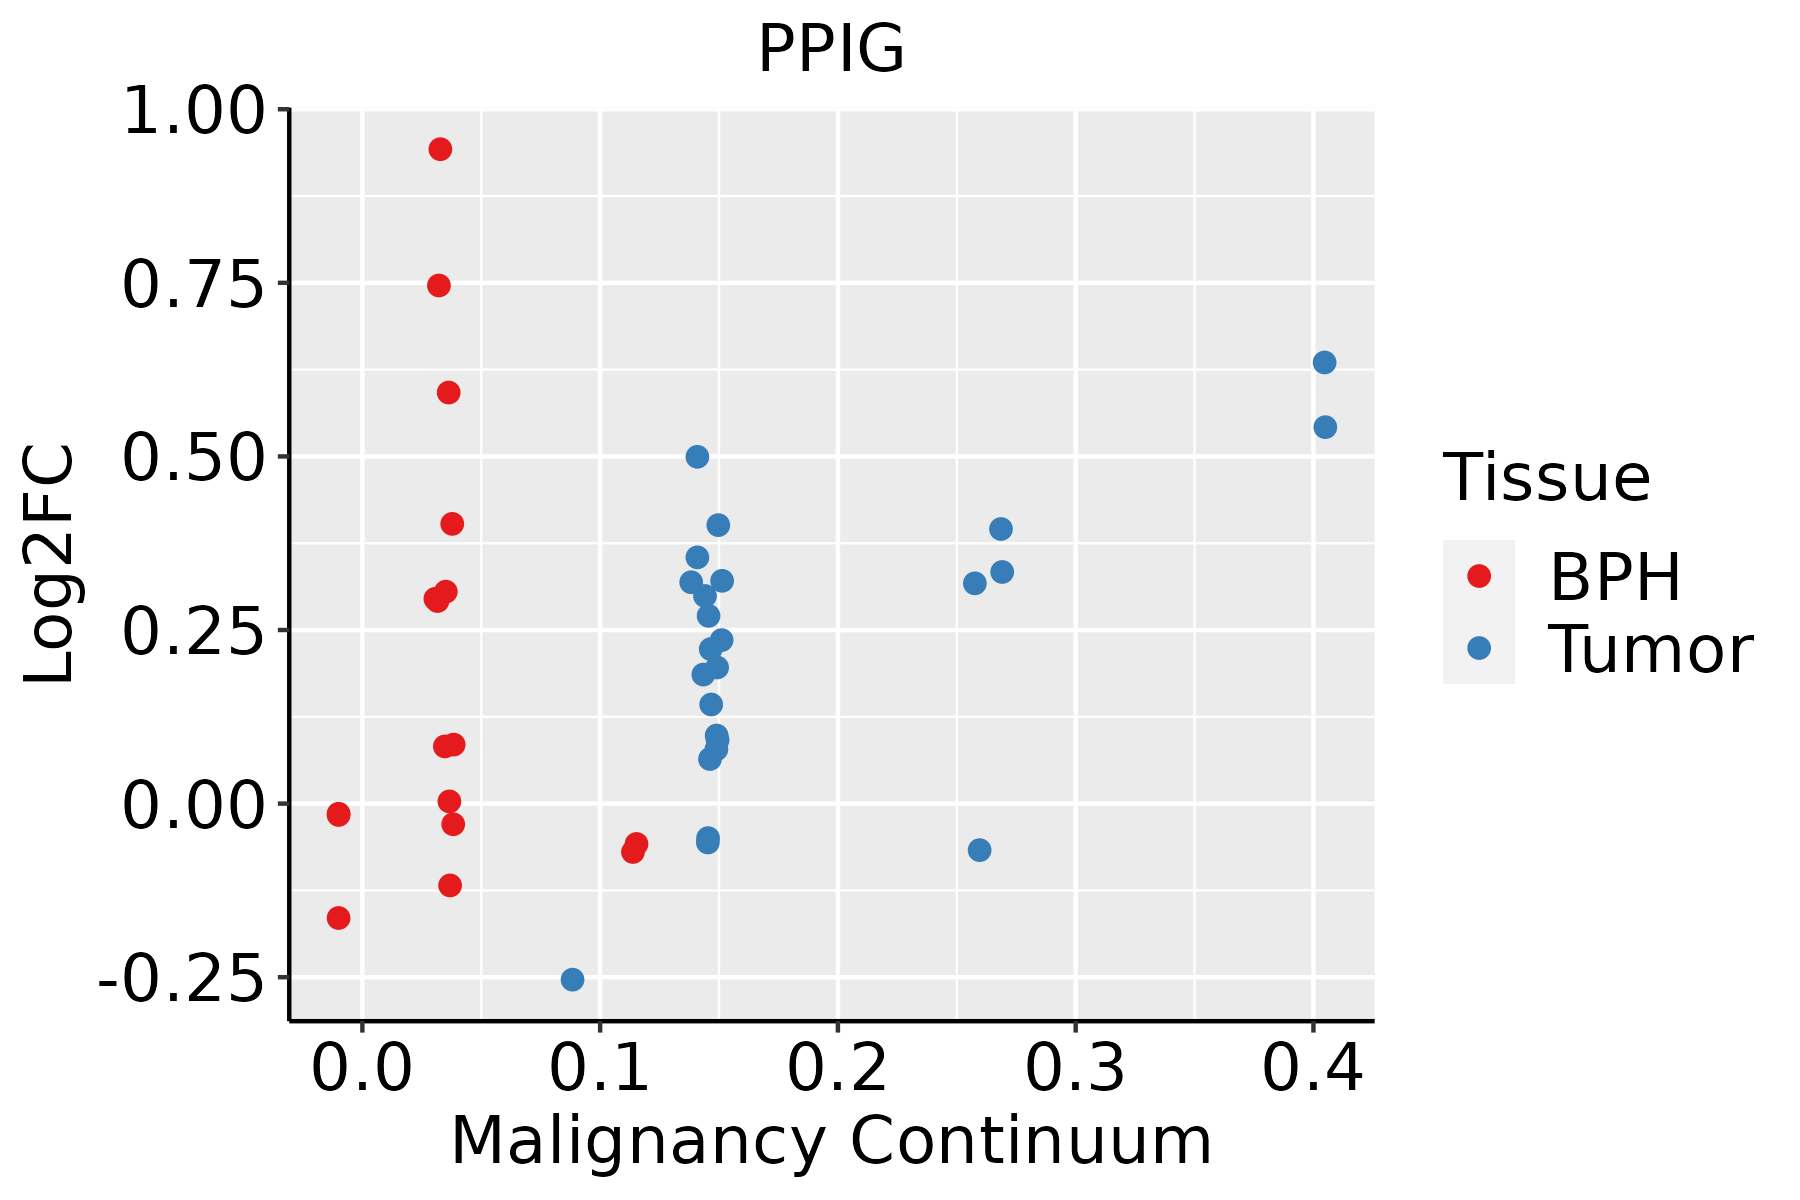 | BPH: Benign Prostatic Hyperplasia |
| Skin |  | AK: Actinic keratosis |
| cSCC: Cutaneous squamous cell carcinoma | ||
| SCCIS:squamous cell carcinoma in situ | ||
| Thyroid | 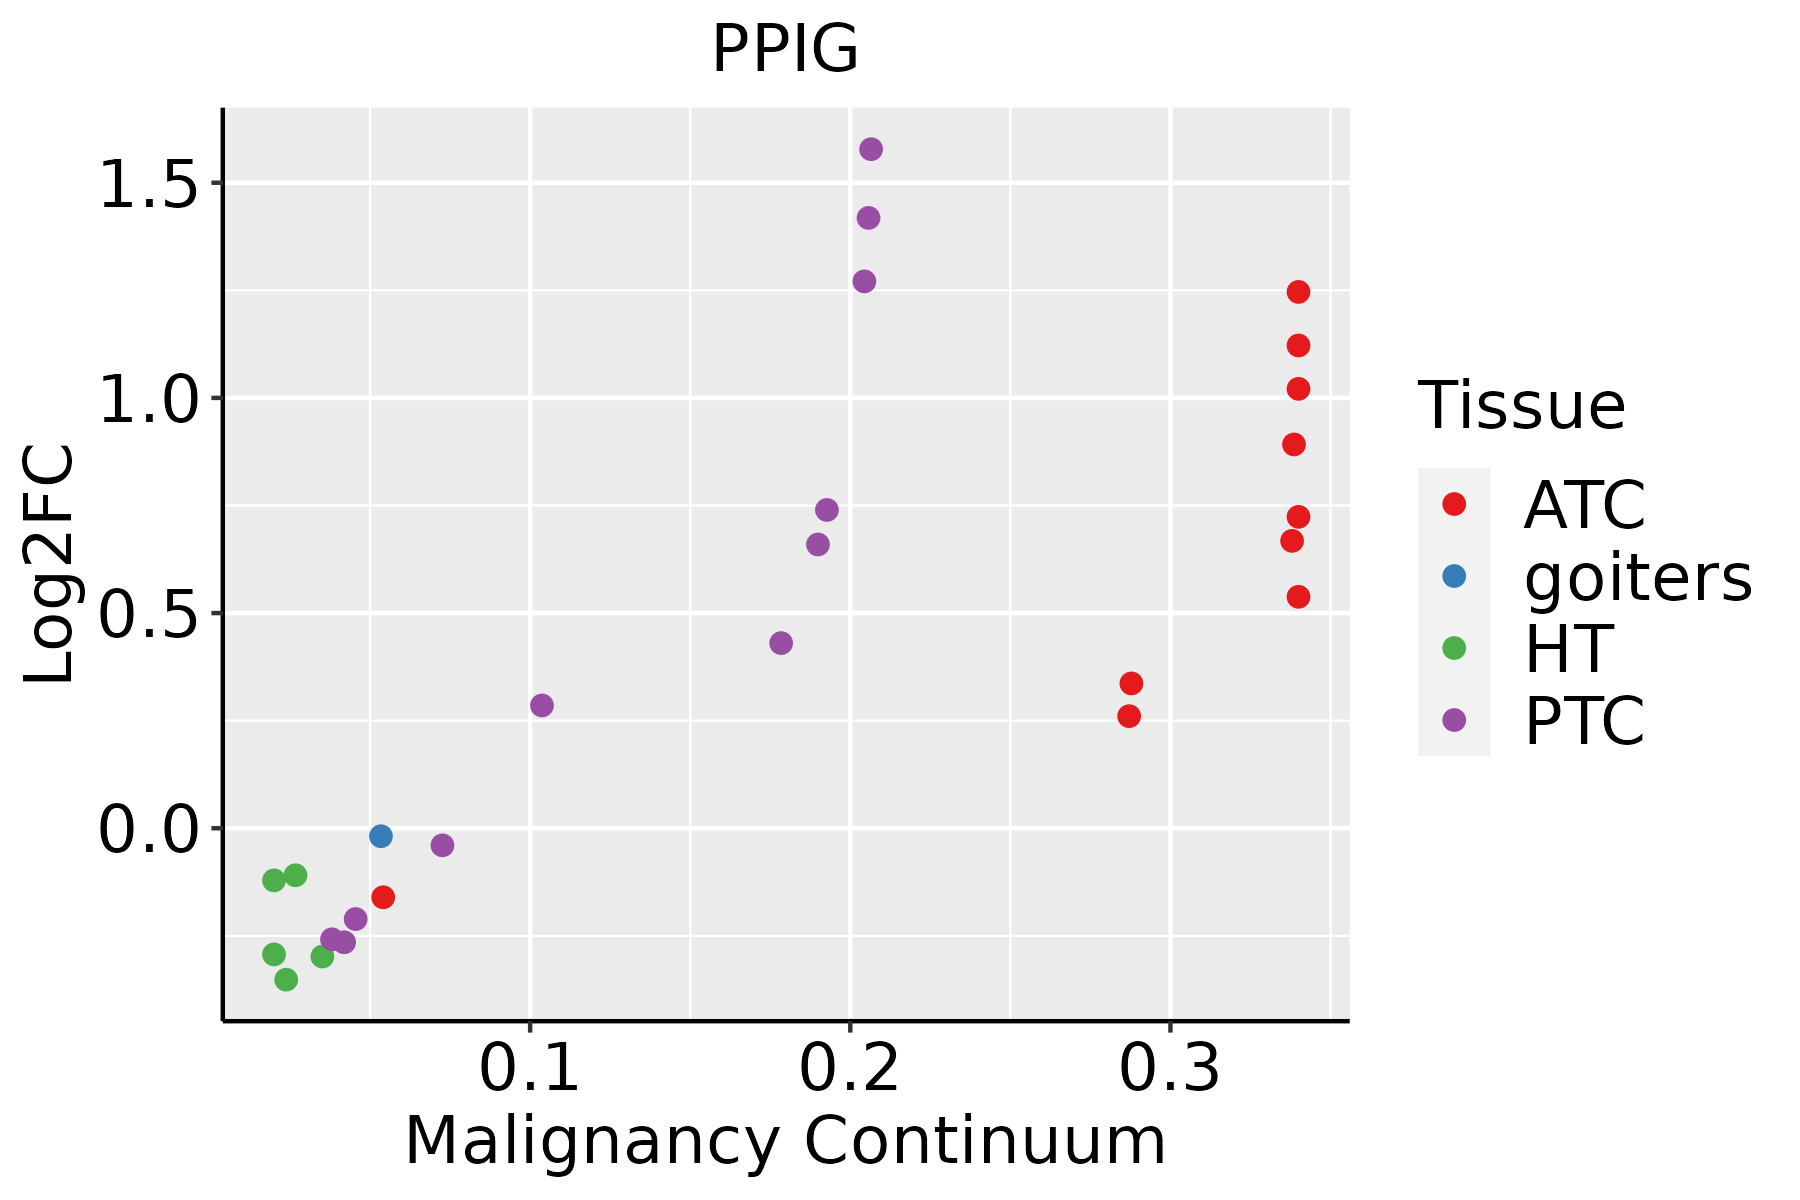 | ATC: Anaplastic thyroid cancer |
| HT: Hashimoto's thyroiditis | ||
| PTC: Papillary thyroid cancer |
| ∗log2FC in expression of this searched gene in stem-like cells from each diseased tissue sample relative to stem-like cells in normal samples in each tissue plotted against the malignancy continuum. Samples are colored based on if they are from different disease stage. |
Top |
Malignant transformation related pathway analysis |
| Find out the enriched GO biological processes and KEGG pathways involved in transition from healthy to precancer to cancer |
| Tissue | Disease Stage | Enriched GO biological Processes |
| Colorectum | AD |  |
| Colorectum | SER |  |
| Colorectum | MSS |  |
| Colorectum | MSI-H |  |
| Colorectum | FAP |  |
| ∗Top 15 enriched GO BP terms are showed in the bar plot of each disease state in each tissue. Each row represents a significant GO biological process which is colored according to the -log10(p.adjust). |
| Page: 1 2 3 4 5 6 7 8 9 |
| GO ID | Tissue | Disease Stage | Description | Gene Ratio | Bg Ratio | pvalue | p.adjust | Count |
| GO:000838016 | Endometrium | AEH | RNA splicing | 111/2100 | 434/18723 | 2.42e-17 | 1.12e-14 | 111 |
| GO:000645710 | Endometrium | AEH | protein folding | 61/2100 | 212/18723 | 1.86e-12 | 3.48e-10 | 61 |
| GO:00004133 | Endometrium | AEH | protein peptidyl-prolyl isomerization | 13/2100 | 42/18723 | 4.74e-04 | 4.91e-03 | 13 |
| GO:00182086 | Endometrium | AEH | peptidyl-proline modification | 16/2100 | 58/18723 | 4.75e-04 | 4.91e-03 | 16 |
| GO:000838017 | Endometrium | EEC | RNA splicing | 111/2168 | 434/18723 | 2.45e-16 | 1.13e-13 | 111 |
| GO:000645715 | Endometrium | EEC | protein folding | 63/2168 | 212/18723 | 6.82e-13 | 1.40e-10 | 63 |
| GO:000041311 | Endometrium | EEC | protein peptidyl-prolyl isomerization | 14/2168 | 42/18723 | 1.69e-04 | 2.10e-03 | 14 |
| GO:001820813 | Endometrium | EEC | peptidyl-proline modification | 17/2168 | 58/18723 | 2.11e-04 | 2.54e-03 | 17 |
| GO:000838026 | Esophagus | HGIN | RNA splicing | 160/2587 | 434/18723 | 3.74e-34 | 1.12e-30 | 160 |
| GO:000645720 | Esophagus | HGIN | protein folding | 75/2587 | 212/18723 | 1.61e-15 | 3.86e-13 | 75 |
| GO:00182089 | Esophagus | HGIN | peptidyl-proline modification | 17/2587 | 58/18723 | 1.64e-03 | 1.82e-02 | 17 |
| GO:00004135 | Esophagus | HGIN | protein peptidyl-prolyl isomerization | 13/2587 | 42/18723 | 3.32e-03 | 3.12e-02 | 13 |
| GO:0008380111 | Esophagus | ESCC | RNA splicing | 336/8552 | 434/18723 | 1.74e-42 | 3.67e-39 | 336 |
| GO:0006457110 | Esophagus | ESCC | protein folding | 163/8552 | 212/18723 | 1.13e-20 | 1.74e-18 | 163 |
| GO:001820816 | Esophagus | ESCC | peptidyl-proline modification | 46/8552 | 58/18723 | 1.59e-07 | 2.51e-06 | 46 |
| GO:000041313 | Esophagus | ESCC | protein peptidyl-prolyl isomerization | 32/8552 | 42/18723 | 5.52e-05 | 4.27e-04 | 32 |
| GO:00083807 | Liver | NAFLD | RNA splicing | 70/1882 | 434/18723 | 4.62e-05 | 1.10e-03 | 70 |
| GO:000838012 | Liver | Cirrhotic | RNA splicing | 229/4634 | 434/18723 | 9.13e-37 | 2.86e-33 | 229 |
| GO:00064577 | Liver | Cirrhotic | protein folding | 114/4634 | 212/18723 | 9.23e-20 | 2.31e-17 | 114 |
| GO:00182084 | Liver | Cirrhotic | peptidyl-proline modification | 26/4634 | 58/18723 | 6.65e-04 | 5.04e-03 | 26 |
| Page: 1 2 3 |
| Pathway ID | Tissue | Disease Stage | Description | Gene Ratio | Bg Ratio | pvalue | p.adjust | qvalue | Count |
| Page: 1 |
Top |
Cell-cell communication analysis |
| Identification of potential cell-cell interactions between two cell types and their ligand-receptor pairs for different disease states |
| Ligand | Receptor | LRpair | Pathway | Tissue | Disease Stage |
| Page: 1 |
Top |
Single-cell gene regulatory network inference analysis |
| Find out the significant the regulons (TFs) and the target genes of each regulon across cell types for different disease states |
| TF | Cell Type | Tissue | Disease Stage | Target Gene | RSS | Regulon Activity |
| ∗The dot plots of a searched regulon are shown for all cell subpopulations in each disease state of each tissue based on the regulon specific score inferred using pySCENIC and by calculating the average expression. |
| Page: 1 |
Top |
Somatic mutation of malignant transformation related genes |
| Annotation of somatic variants for genes involved in malignant transformation |
| Hugo Symbol | Variant Class | Variant Classification | dbSNP RS | HGVSc | HGVSp | HGVSp Short | SWISSPROT | BIOTYPE | SIFT | PolyPhen | Tumor Sample Barcode | Tissue | Histology | Sex | Age | Stage | Therapy Types | Drugs | Outcome |
| PPIG | SNV | Missense_Mutation | novel | c.809C>G | p.Ser270Cys | p.S270C | Q13427 | protein_coding | deleterious(0.01) | probably_damaging(0.995) | TCGA-5L-AAT1-01 | Breast | breast invasive carcinoma | Female | <65 | III/IV | Hormone Therapy | letrozol | SD |
| PPIG | SNV | Missense_Mutation | c.1975G>A | p.Glu659Lys | p.E659K | Q13427 | protein_coding | deleterious_low_confidence(0.01) | benign(0.081) | TCGA-A2-A04Q-01 | Breast | breast invasive carcinoma | Female | <65 | I/II | Chemotherapy | adriamycin | SD | |
| PPIG | SNV | Missense_Mutation | c.907N>C | p.Glu303Gln | p.E303Q | Q13427 | protein_coding | tolerated(0.08) | possibly_damaging(0.886) | TCGA-A2-A0CX-01 | Breast | breast invasive carcinoma | Female | <65 | I/II | Chemotherapy | adriamycin | SD | |
| PPIG | SNV | Missense_Mutation | c.383C>G | p.Thr128Arg | p.T128R | Q13427 | protein_coding | deleterious(0) | probably_damaging(1) | TCGA-A2-A4S3-01 | Breast | breast invasive carcinoma | Female | <65 | I/II | Unknown | Unknown | SD | |
| PPIG | SNV | Missense_Mutation | c.784N>C | p.Glu262Gln | p.E262Q | Q13427 | protein_coding | deleterious(0.02) | benign(0.067) | TCGA-D8-A1JA-01 | Breast | breast invasive carcinoma | Female | <65 | III/IV | Chemotherapy | adriamycin | PD | |
| PPIG | SNV | Missense_Mutation | c.121C>T | p.Arg41Cys | p.R41C | Q13427 | protein_coding | deleterious(0) | probably_damaging(0.999) | TCGA-2W-A8YY-01 | Cervix | cervical & endocervical cancer | Female | <65 | I/II | Chemotherapy | cisplatin | CR | |
| PPIG | SNV | Missense_Mutation | c.793N>C | p.Glu265Gln | p.E265Q | Q13427 | protein_coding | tolerated(0.06) | benign(0.223) | TCGA-DR-A0ZM-01 | Cervix | cervical & endocervical cancer | Female | <65 | III/IV | Unspecific | Cisplatin | SD | |
| PPIG | SNV | Missense_Mutation | novel | c.767N>G | p.Ser256Cys | p.S256C | Q13427 | protein_coding | deleterious(0.02) | benign(0.339) | TCGA-VS-A8QM-01 | Cervix | cervical & endocervical cancer | Female | <65 | I/II | Chemotherapy | cisplatin | PD |
| PPIG | SNV | Missense_Mutation | novel | c.190N>G | p.Leu64Val | p.L64V | Q13427 | protein_coding | tolerated(0.17) | benign(0.045) | TCGA-VS-A94Z-01 | Cervix | cervical & endocervical cancer | Female | <65 | I/II | Chemotherapy | cisplatin | CR |
| PPIG | SNV | Missense_Mutation | c.65N>T | p.Gly22Val | p.G22V | Q13427 | protein_coding | deleterious(0) | probably_damaging(1) | TCGA-VS-A958-01 | Cervix | cervical & endocervical cancer | Female | <65 | I/II | Chemotherapy | cisplatin | CR |
| Page: 1 2 3 4 5 6 7 8 9 10 11 |
Top |
Related drugs of malignant transformation related genes |
| Identification of chemicals and drugs interact with genes involved in malignant transfromation |
| (DGIdb 4.0) |
| Entrez ID | Symbol | Category | Interaction Types | Drug Claim Name | Drug Name | PMIDs |
| 9360 | PPIG | DRUGGABLE GENOME | MELARSOPROL | MELARSOPROL |
| Page: 1 |

Copyright 2023-Present -The University of Texas Health Science Center at Houston |