
|
|||||
|
 | |
| |
| |
| |
| |
| |
|
Gene: PPIF |
Gene summary for PPIF |
| Gene information | Species | Human | Gene symbol | PPIF | Gene ID | 10105 |
| Gene name | peptidylprolyl isomerase F | |
| Gene Alias | CYP3 | |
| Cytomap | 10q22.3 | |
| Gene Type | protein-coding | GO ID | GO:0000302 | UniProtAcc | A0A024QZS4 |
Top |
Malignant transformation analysis |
| Identification of the aberrant gene expression in precancerous and cancerous lesions by comparing the gene expression of stem-like cells in diseased tissues with normal stem cells |
| Entrez ID | Symbol | Replicates | Species | Organ | Tissue | Adj P-value | Log2FC | Malignancy |
| 10105 | PPIF | HTA11_3410_2000001011 | Human | Colorectum | AD | 1.29e-08 | 1.85e-01 | 0.0155 |
| 10105 | PPIF | HTA11_2487_2000001011 | Human | Colorectum | SER | 1.04e-08 | 3.70e-01 | -0.1808 |
| 10105 | PPIF | HTA11_1938_2000001011 | Human | Colorectum | AD | 2.39e-12 | 3.54e-01 | -0.0811 |
| 10105 | PPIF | HTA11_78_2000001011 | Human | Colorectum | AD | 3.96e-05 | 2.58e-01 | -0.1088 |
| 10105 | PPIF | HTA11_347_2000001011 | Human | Colorectum | AD | 2.35e-24 | 6.11e-01 | -0.1954 |
| 10105 | PPIF | HTA11_411_2000001011 | Human | Colorectum | SER | 5.18e-07 | 5.53e-01 | -0.2602 |
| 10105 | PPIF | HTA11_2112_2000001011 | Human | Colorectum | SER | 2.21e-02 | 4.05e-01 | -0.2196 |
| 10105 | PPIF | HTA11_3361_2000001011 | Human | Colorectum | AD | 1.31e-07 | 4.18e-01 | -0.1207 |
| 10105 | PPIF | HTA11_83_2000001011 | Human | Colorectum | SER | 3.11e-06 | 3.72e-01 | -0.1526 |
| 10105 | PPIF | HTA11_696_2000001011 | Human | Colorectum | AD | 3.50e-14 | 4.00e-01 | -0.1464 |
| 10105 | PPIF | HTA11_866_2000001011 | Human | Colorectum | AD | 2.30e-06 | 2.12e-01 | -0.1001 |
| 10105 | PPIF | HTA11_1391_2000001011 | Human | Colorectum | AD | 3.19e-17 | 5.35e-01 | -0.059 |
| 10105 | PPIF | HTA11_5212_2000001011 | Human | Colorectum | AD | 3.90e-05 | 5.38e-01 | -0.2061 |
| 10105 | PPIF | HTA11_546_2000001011 | Human | Colorectum | AD | 1.78e-02 | 2.99e-01 | -0.0842 |
| 10105 | PPIF | HTA11_7862_2000001011 | Human | Colorectum | AD | 7.73e-05 | 3.89e-01 | -0.0179 |
| 10105 | PPIF | HTA11_866_3004761011 | Human | Colorectum | AD | 3.21e-08 | 2.93e-01 | 0.096 |
| 10105 | PPIF | HTA11_8622_2000001021 | Human | Colorectum | SER | 6.40e-03 | 2.60e-01 | 0.0528 |
| 10105 | PPIF | HTA11_7663_2000001011 | Human | Colorectum | SER | 2.57e-04 | 2.62e-01 | 0.0131 |
| 10105 | PPIF | HTA11_10623_2000001011 | Human | Colorectum | AD | 1.41e-07 | 3.40e-01 | -0.0177 |
| 10105 | PPIF | HTA11_6801_2000001011 | Human | Colorectum | SER | 3.55e-13 | 8.96e-01 | 0.0171 |
| Page: 1 2 3 4 5 6 7 8 |
| Tissue | Expression Dynamics | Abbreviation |
| Colorectum (GSE201348) |  | FAP: Familial adenomatous polyposis |
| CRC: Colorectal cancer | ||
| Colorectum (HTA11) |  | AD: Adenomas |
| SER: Sessile serrated lesions | ||
| MSI-H: Microsatellite-high colorectal cancer | ||
| MSS: Microsatellite stable colorectal cancer | ||
| Esophagus | 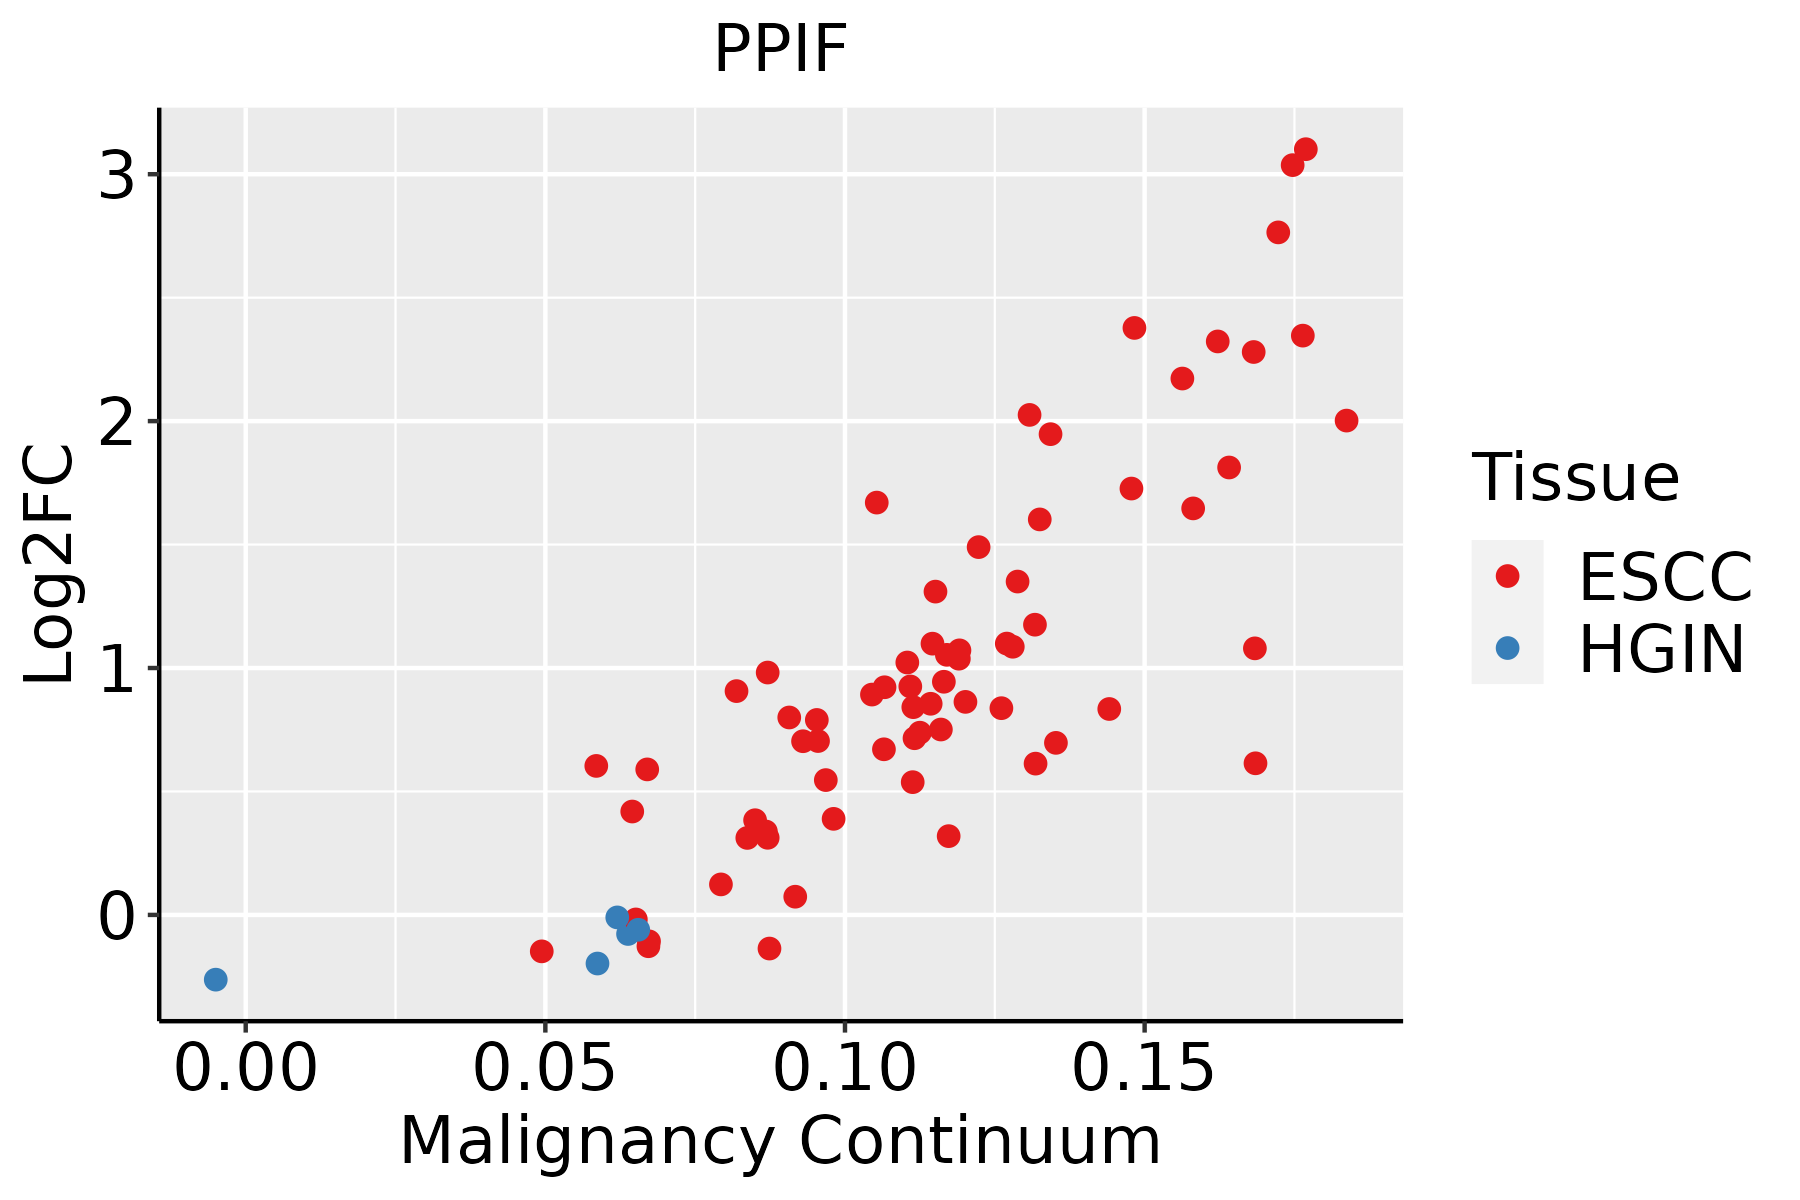 | ESCC: Esophageal squamous cell carcinoma |
| HGIN: High-grade intraepithelial neoplasias | ||
| LGIN: Low-grade intraepithelial neoplasias | ||
| Liver | 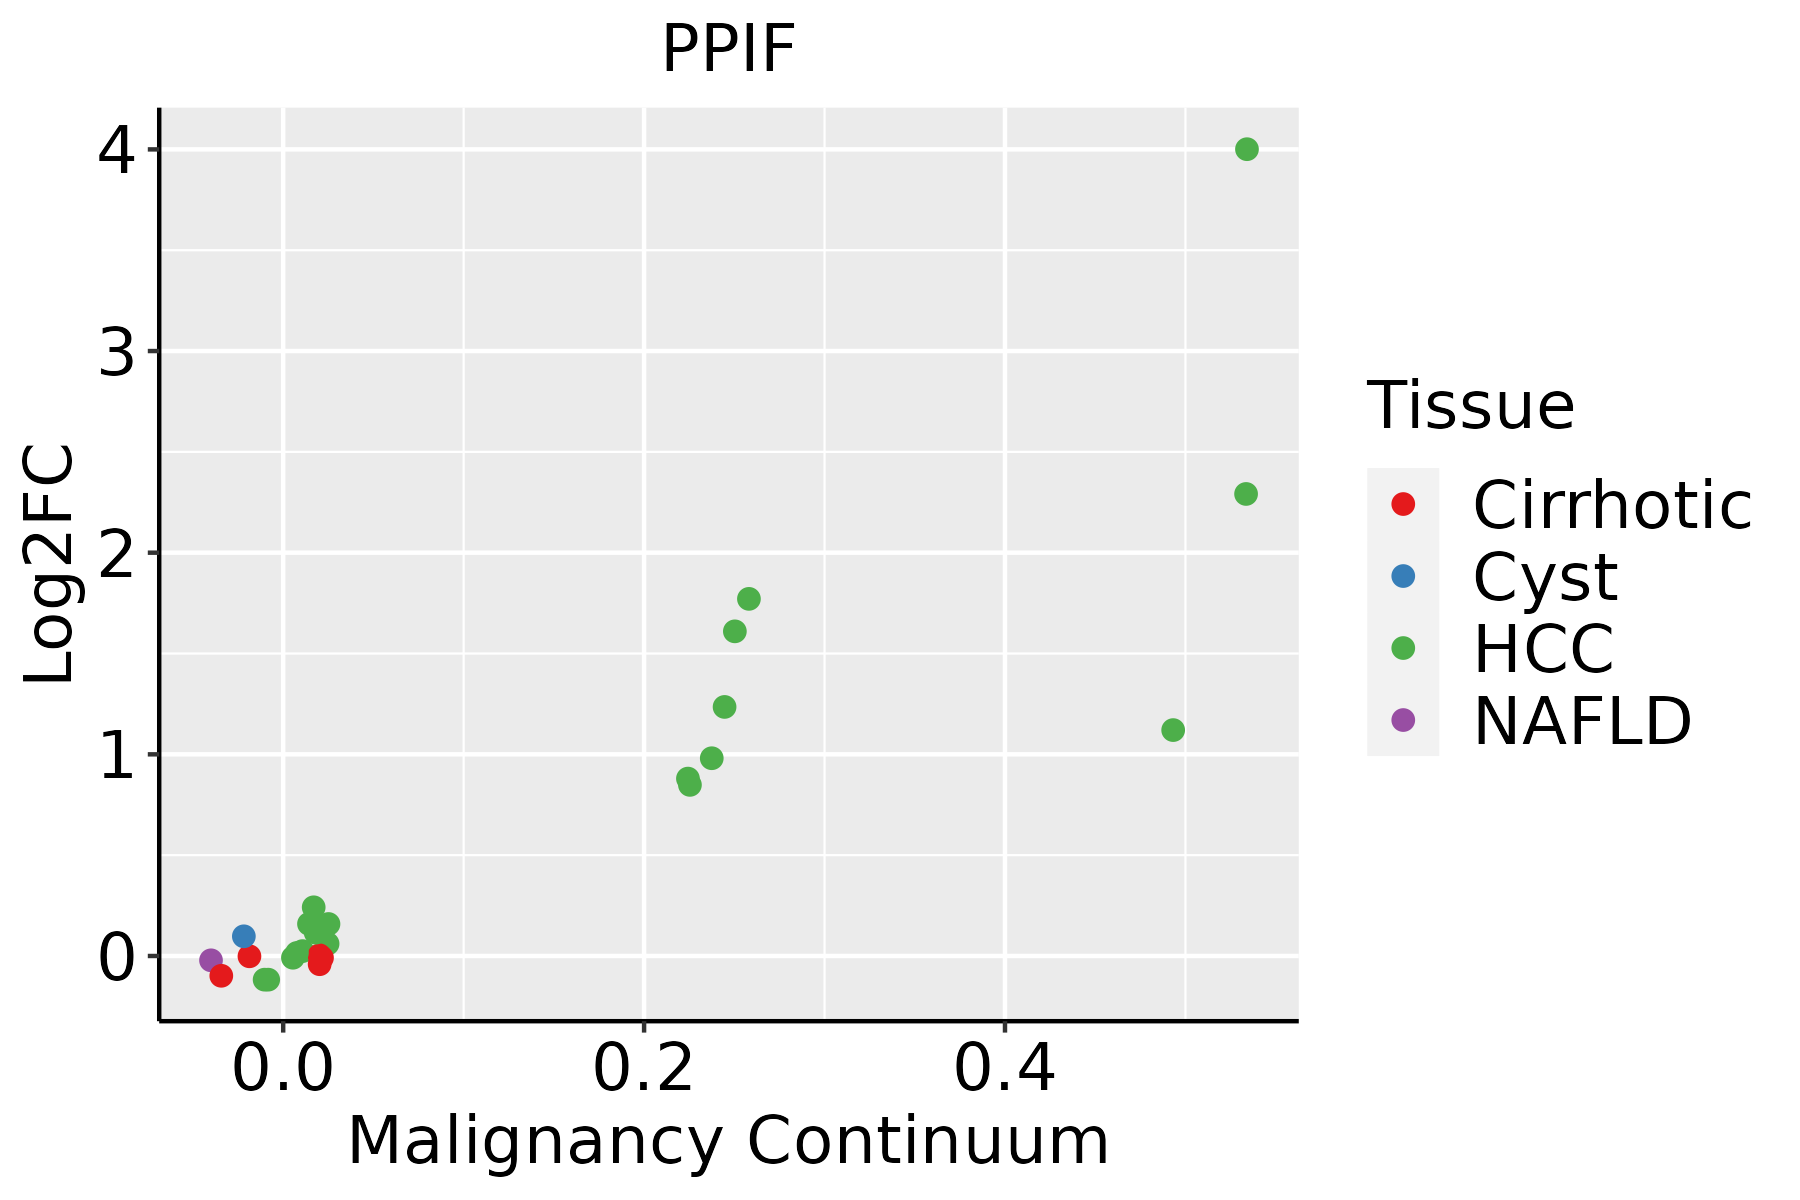 | HCC: Hepatocellular carcinoma |
| NAFLD: Non-alcoholic fatty liver disease | ||
| Oral Cavity | 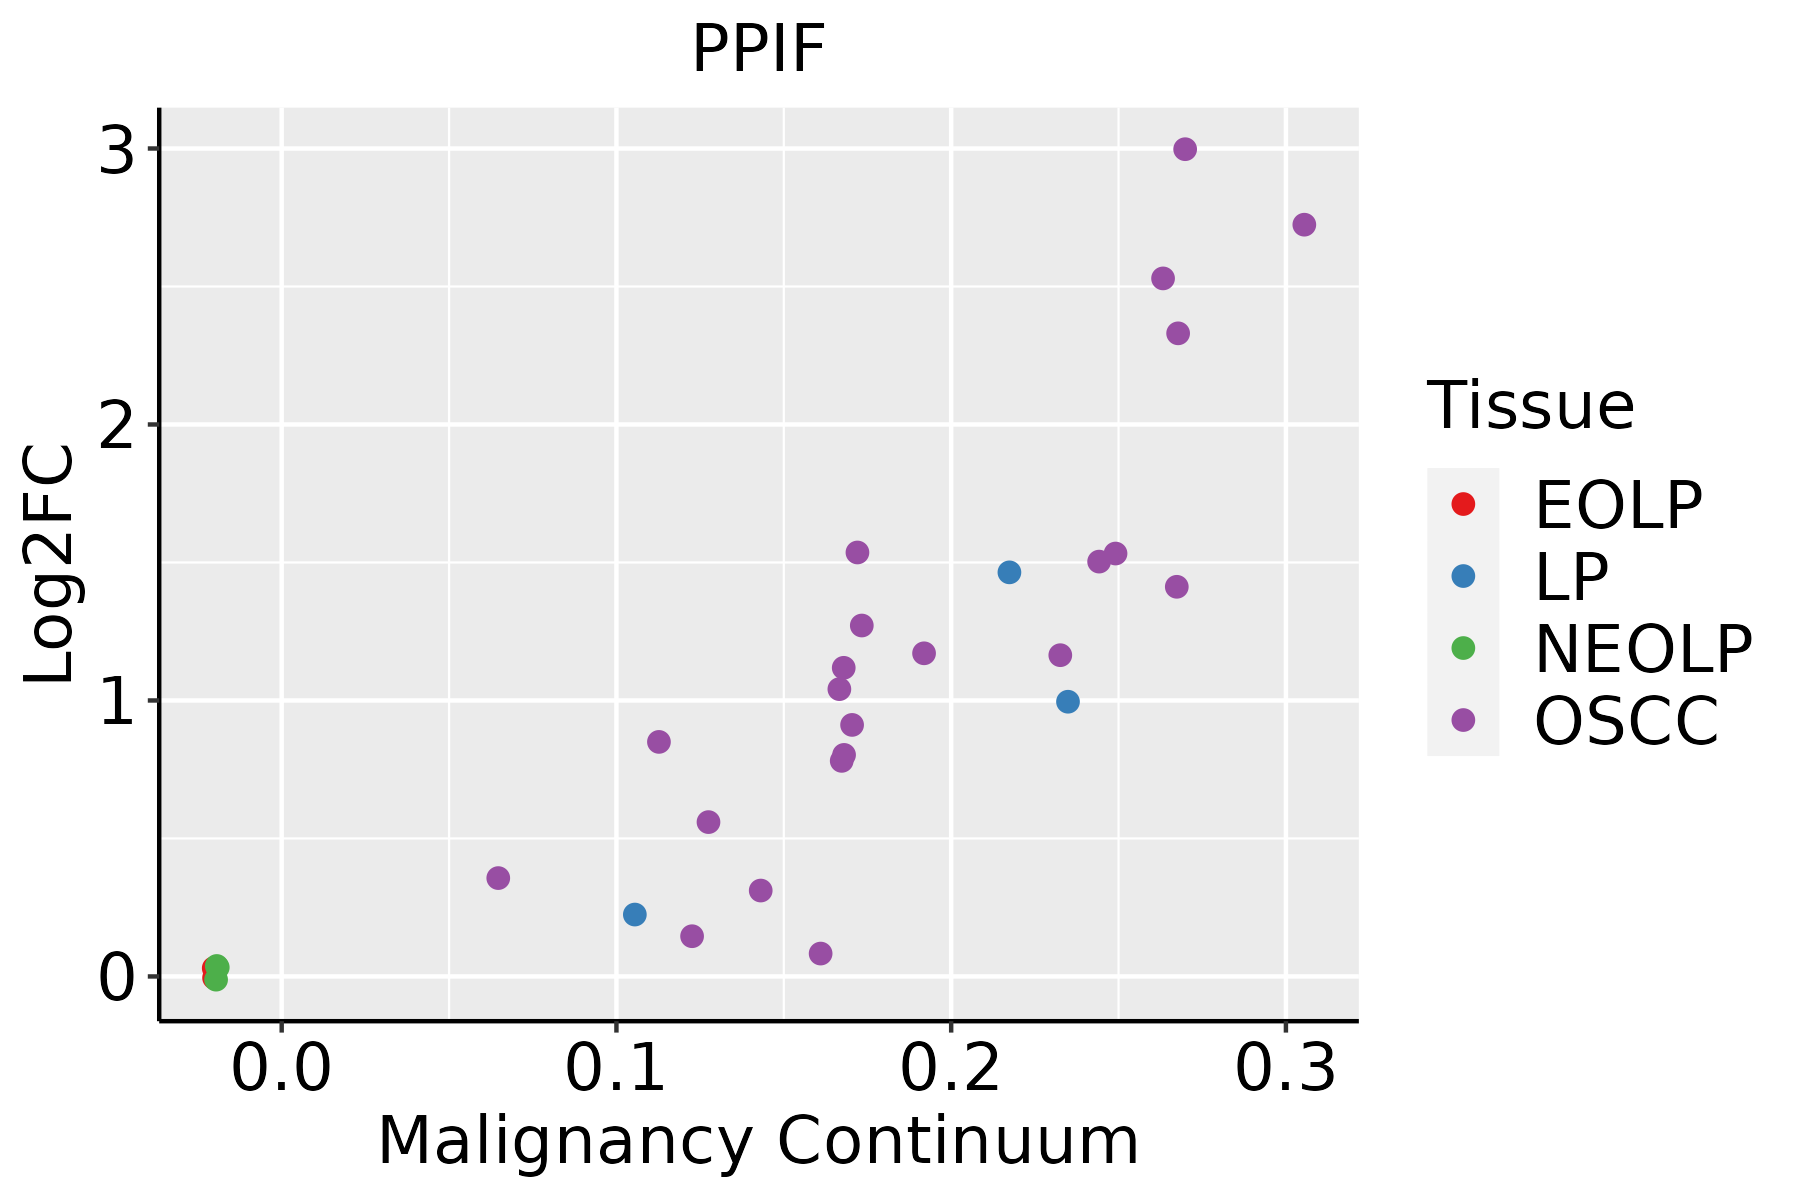 | EOLP: Erosive Oral lichen planus |
| LP: leukoplakia | ||
| NEOLP: Non-erosive oral lichen planus | ||
| OSCC: Oral squamous cell carcinoma | ||
| Skin | 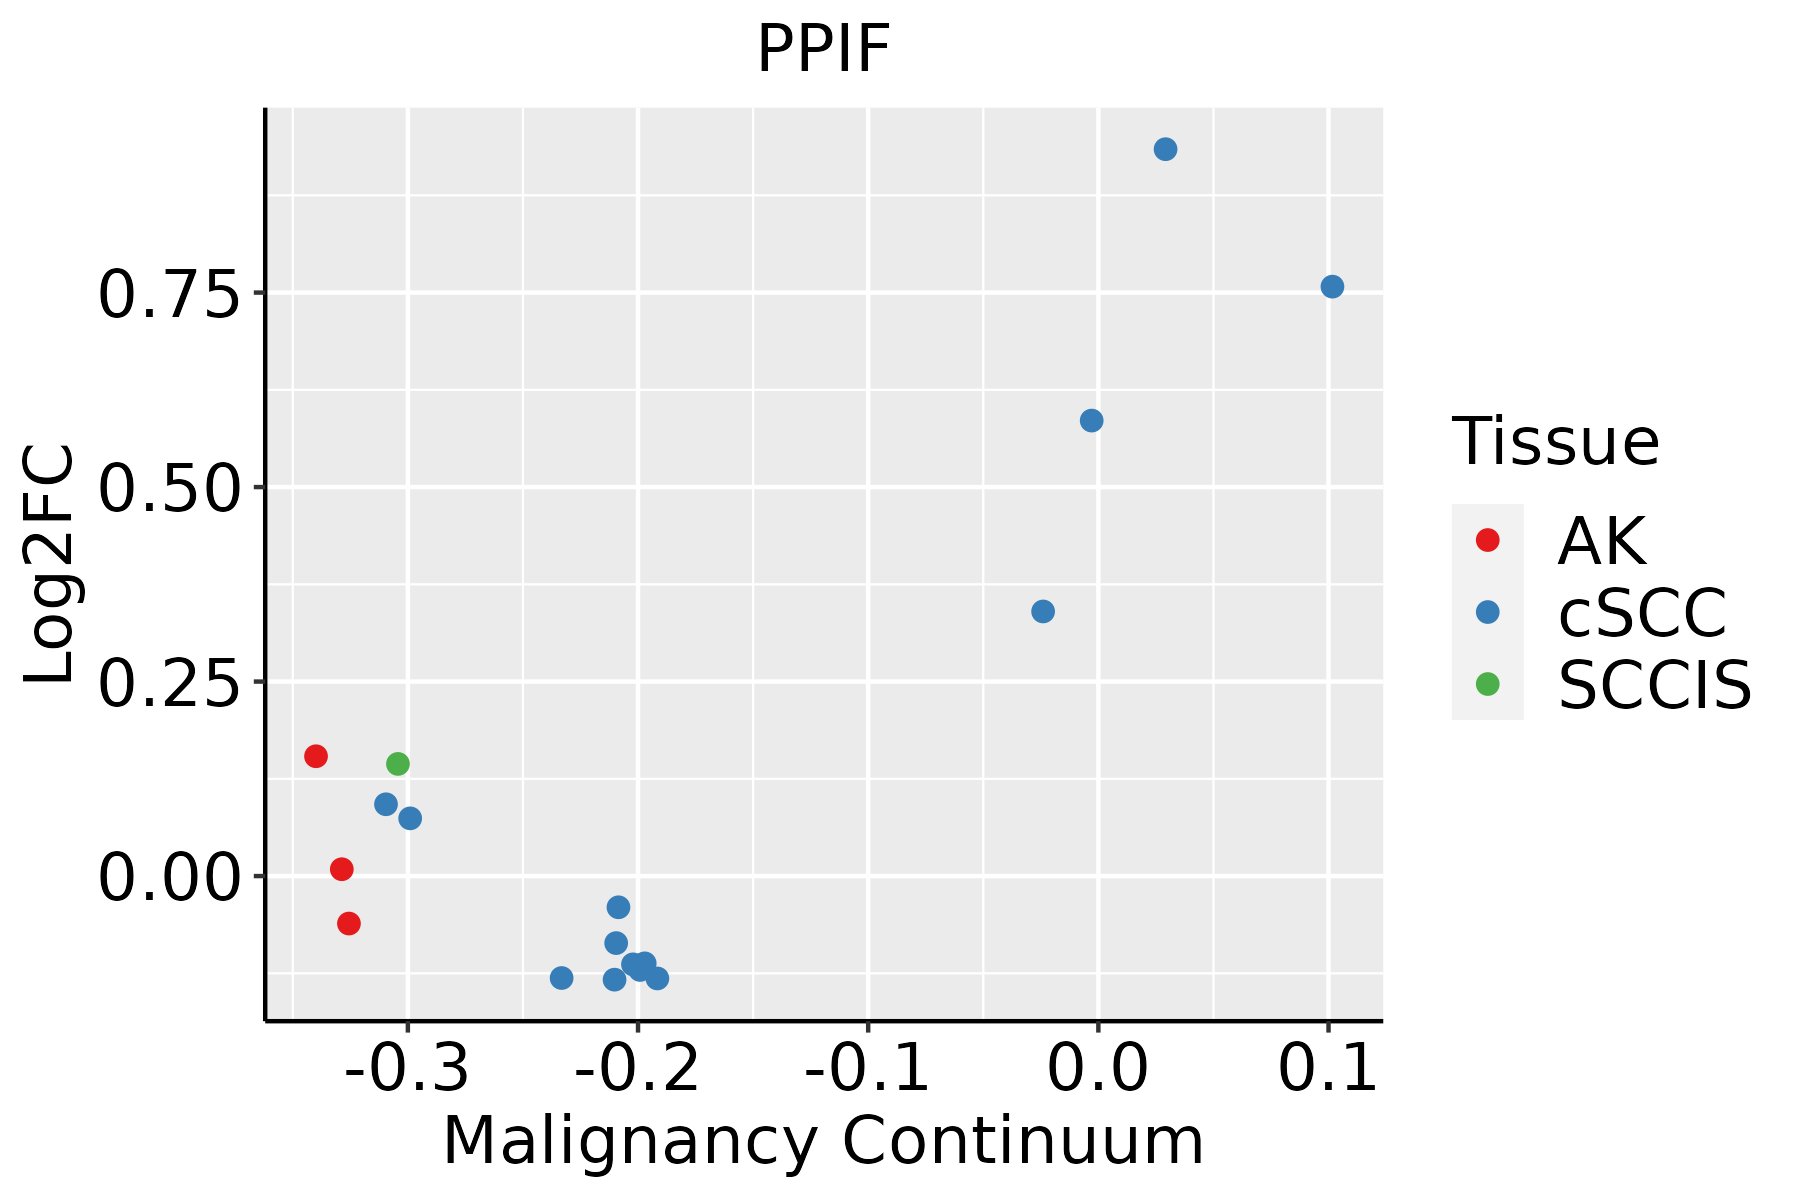 | AK: Actinic keratosis |
| cSCC: Cutaneous squamous cell carcinoma | ||
| SCCIS:squamous cell carcinoma in situ | ||
| Thyroid | 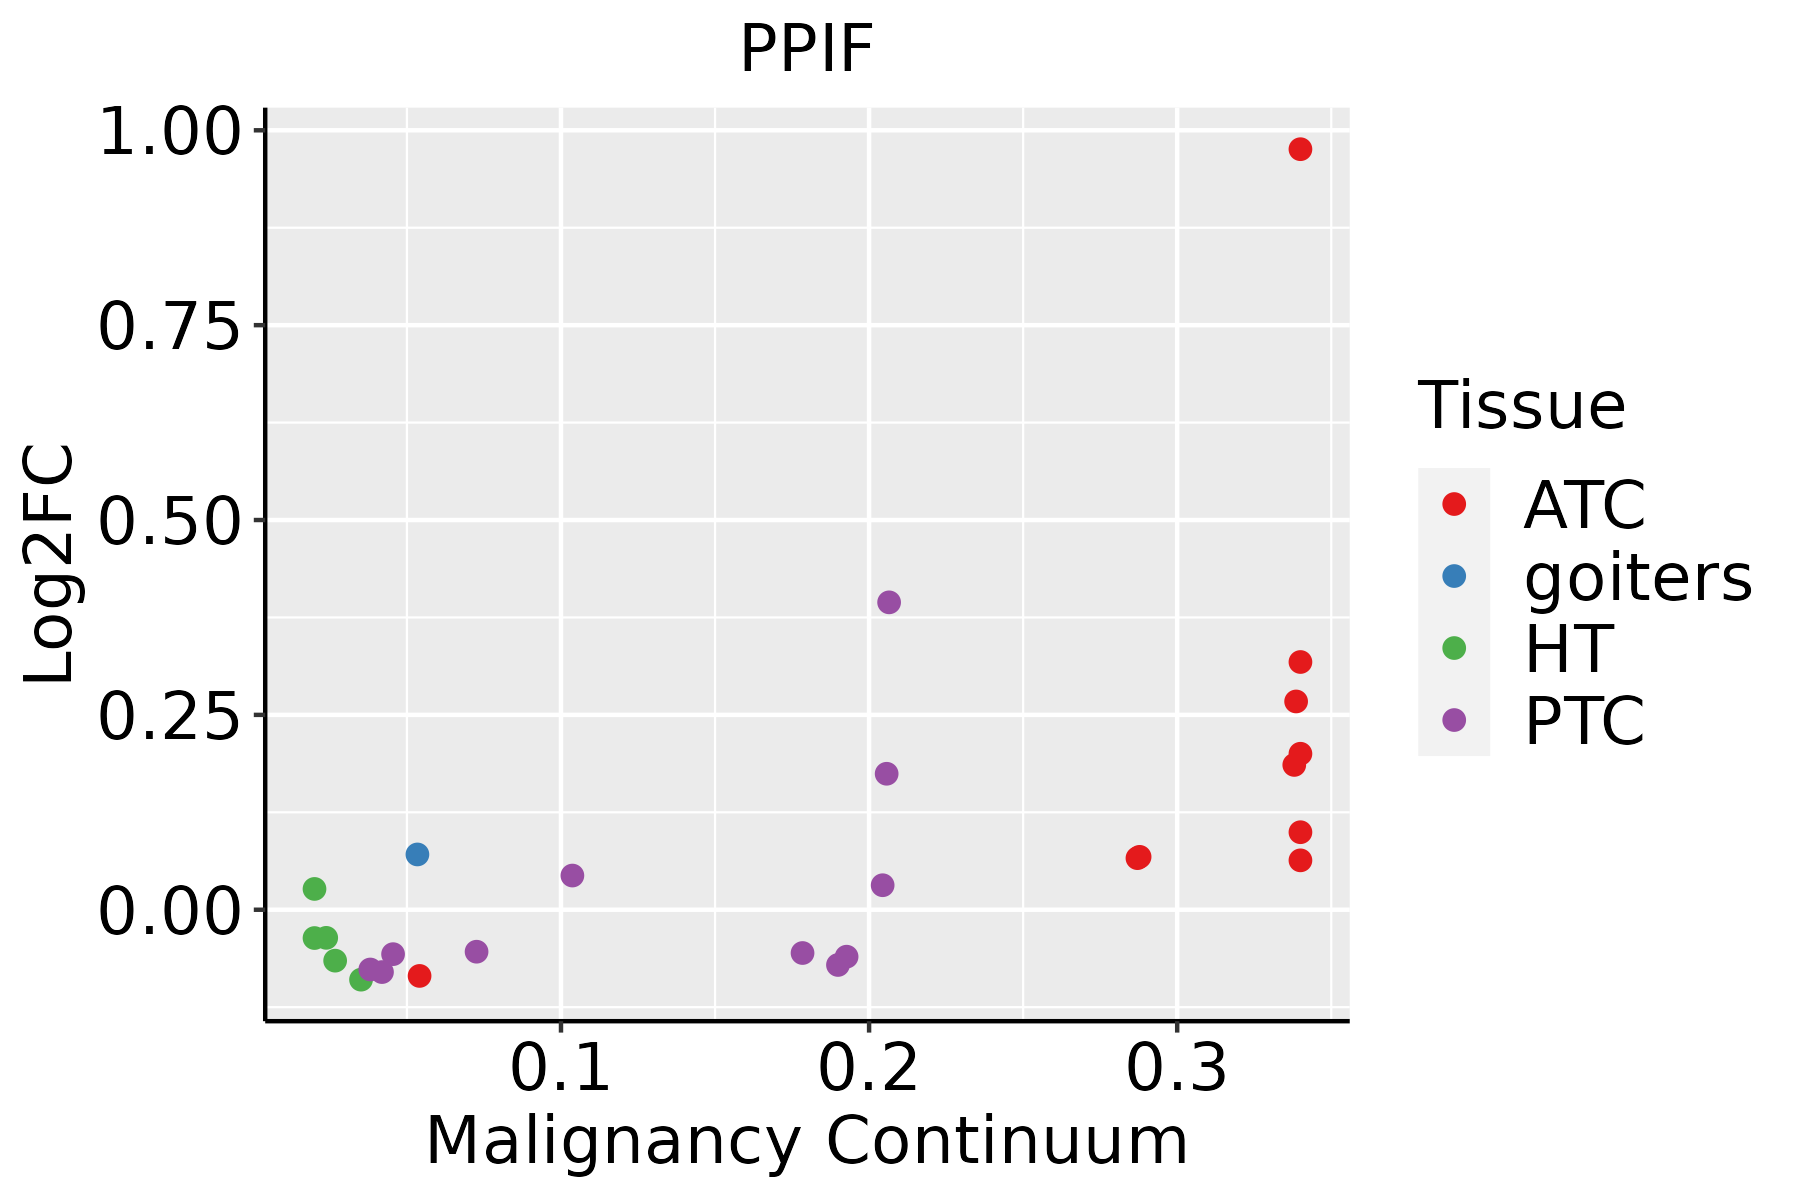 | ATC: Anaplastic thyroid cancer |
| HT: Hashimoto's thyroiditis | ||
| PTC: Papillary thyroid cancer |
| ∗log2FC in expression of this searched gene in stem-like cells from each diseased tissue sample relative to stem-like cells in normal samples in each tissue plotted against the malignancy continuum. Samples are colored based on if they are from different disease stage. |
Top |
Malignant transformation related pathway analysis |
| Find out the enriched GO biological processes and KEGG pathways involved in transition from healthy to precancer to cancer |
| Tissue | Disease Stage | Enriched GO biological Processes |
| Colorectum | AD |  |
| Colorectum | SER |  |
| Colorectum | MSS |  |
| Colorectum | MSI-H |  |
| Colorectum | FAP |  |
| ∗Top 15 enriched GO BP terms are showed in the bar plot of each disease state in each tissue. Each row represents a significant GO biological process which is colored according to the -log10(p.adjust). |
| Page: 1 2 3 4 5 6 7 8 9 |
| GO ID | Tissue | Disease Stage | Description | Gene Ratio | Bg Ratio | pvalue | p.adjust | Count |
| GO:0046034 | Colorectum | AD | ATP metabolic process | 142/3918 | 277/18723 | 2.64e-29 | 8.26e-26 | 142 |
| GO:0006091 | Colorectum | AD | generation of precursor metabolites and energy | 209/3918 | 490/18723 | 3.17e-28 | 6.61e-25 | 209 |
| GO:0009060 | Colorectum | AD | aerobic respiration | 108/3918 | 189/18723 | 9.14e-28 | 1.43e-24 | 108 |
| GO:0045333 | Colorectum | AD | cellular respiration | 119/3918 | 230/18723 | 3.21e-25 | 4.02e-22 | 119 |
| GO:0006119 | Colorectum | AD | oxidative phosphorylation | 83/3918 | 141/18723 | 7.95e-23 | 8.30e-20 | 83 |
| GO:0015980 | Colorectum | AD | energy derivation by oxidation of organic compounds | 143/3918 | 318/18723 | 2.78e-22 | 2.49e-19 | 143 |
| GO:0006839 | Colorectum | AD | mitochondrial transport | 102/3918 | 254/18723 | 1.87e-12 | 3.08e-10 | 102 |
| GO:0097193 | Colorectum | AD | intrinsic apoptotic signaling pathway | 108/3918 | 288/18723 | 6.25e-11 | 6.41e-09 | 108 |
| GO:1902600 | Colorectum | AD | proton transmembrane transport | 66/3918 | 157/18723 | 1.59e-09 | 1.17e-07 | 66 |
| GO:2001242 | Colorectum | AD | regulation of intrinsic apoptotic signaling pathway | 67/3918 | 164/18723 | 4.94e-09 | 3.16e-07 | 67 |
| GO:0006979 | Colorectum | AD | response to oxidative stress | 145/3918 | 446/18723 | 5.16e-09 | 3.23e-07 | 145 |
| GO:2001233 | Colorectum | AD | regulation of apoptotic signaling pathway | 119/3918 | 356/18723 | 2.14e-08 | 1.21e-06 | 119 |
| GO:0010639 | Colorectum | AD | negative regulation of organelle organization | 114/3918 | 348/18723 | 1.41e-07 | 6.49e-06 | 114 |
| GO:0010821 | Colorectum | AD | regulation of mitochondrion organization | 57/3918 | 144/18723 | 2.43e-07 | 9.92e-06 | 57 |
| GO:0007006 | Colorectum | AD | mitochondrial membrane organization | 48/3918 | 116/18723 | 4.53e-07 | 1.72e-05 | 48 |
| GO:0062197 | Colorectum | AD | cellular response to chemical stress | 109/3918 | 337/18723 | 5.33e-07 | 1.95e-05 | 109 |
| GO:0000302 | Colorectum | AD | response to reactive oxygen species | 78/3918 | 222/18723 | 6.17e-07 | 2.21e-05 | 78 |
| GO:0034599 | Colorectum | AD | cellular response to oxidative stress | 94/3918 | 288/18723 | 2.03e-06 | 6.02e-05 | 94 |
| GO:0006457 | Colorectum | AD | protein folding | 73/3918 | 212/18723 | 3.24e-06 | 9.10e-05 | 73 |
| GO:0043467 | Colorectum | AD | regulation of generation of precursor metabolites and energy | 49/3918 | 130/18723 | 8.33e-06 | 1.99e-04 | 49 |
| Page: 1 2 3 4 5 6 7 8 9 10 11 12 13 14 15 16 17 18 19 20 21 22 23 24 25 26 27 28 |
| Pathway ID | Tissue | Disease Stage | Description | Gene Ratio | Bg Ratio | pvalue | p.adjust | qvalue | Count |
| hsa05012 | Colorectum | AD | Parkinson disease | 147/2092 | 266/8465 | 2.53e-27 | 8.48e-25 | 5.41e-25 | 147 |
| hsa05208 | Colorectum | AD | Chemical carcinogenesis - reactive oxygen species | 126/2092 | 223/8465 | 1.01e-24 | 1.68e-22 | 1.07e-22 | 126 |
| hsa05415 | Colorectum | AD | Diabetic cardiomyopathy | 114/2092 | 203/8465 | 3.65e-22 | 3.06e-20 | 1.95e-20 | 114 |
| hsa05010 | Colorectum | AD | Alzheimer disease | 174/2092 | 384/8465 | 1.82e-19 | 9.26e-18 | 5.91e-18 | 174 |
| hsa05016 | Colorectum | AD | Huntington disease | 147/2092 | 306/8465 | 1.93e-19 | 9.26e-18 | 5.91e-18 | 147 |
| hsa05020 | Colorectum | AD | Prion disease | 133/2092 | 273/8465 | 2.47e-18 | 8.29e-17 | 5.29e-17 | 133 |
| hsa05022 | Colorectum | AD | Pathways of neurodegeneration - multiple diseases | 201/2092 | 476/8465 | 4.54e-18 | 1.27e-16 | 8.09e-17 | 201 |
| hsa05017 | Colorectum | AD | Spinocerebellar ataxia | 60/2092 | 143/8465 | 3.78e-06 | 4.35e-05 | 2.78e-05 | 60 |
| hsa050121 | Colorectum | AD | Parkinson disease | 147/2092 | 266/8465 | 2.53e-27 | 8.48e-25 | 5.41e-25 | 147 |
| hsa052081 | Colorectum | AD | Chemical carcinogenesis - reactive oxygen species | 126/2092 | 223/8465 | 1.01e-24 | 1.68e-22 | 1.07e-22 | 126 |
| hsa054151 | Colorectum | AD | Diabetic cardiomyopathy | 114/2092 | 203/8465 | 3.65e-22 | 3.06e-20 | 1.95e-20 | 114 |
| hsa050101 | Colorectum | AD | Alzheimer disease | 174/2092 | 384/8465 | 1.82e-19 | 9.26e-18 | 5.91e-18 | 174 |
| hsa050161 | Colorectum | AD | Huntington disease | 147/2092 | 306/8465 | 1.93e-19 | 9.26e-18 | 5.91e-18 | 147 |
| hsa050201 | Colorectum | AD | Prion disease | 133/2092 | 273/8465 | 2.47e-18 | 8.29e-17 | 5.29e-17 | 133 |
| hsa050221 | Colorectum | AD | Pathways of neurodegeneration - multiple diseases | 201/2092 | 476/8465 | 4.54e-18 | 1.27e-16 | 8.09e-17 | 201 |
| hsa050171 | Colorectum | AD | Spinocerebellar ataxia | 60/2092 | 143/8465 | 3.78e-06 | 4.35e-05 | 2.78e-05 | 60 |
| hsa050122 | Colorectum | SER | Parkinson disease | 132/1580 | 266/8465 | 2.72e-31 | 9.03e-29 | 6.55e-29 | 132 |
| hsa054152 | Colorectum | SER | Diabetic cardiomyopathy | 103/1580 | 203/8465 | 1.45e-25 | 1.61e-23 | 1.17e-23 | 103 |
| hsa050202 | Colorectum | SER | Prion disease | 119/1580 | 273/8465 | 4.61e-22 | 3.06e-20 | 2.22e-20 | 119 |
| hsa052082 | Colorectum | SER | Chemical carcinogenesis - reactive oxygen species | 103/1580 | 223/8465 | 1.60e-21 | 7.57e-20 | 5.50e-20 | 103 |
| Page: 1 2 3 4 5 6 7 |
Top |
Cell-cell communication analysis |
| Identification of potential cell-cell interactions between two cell types and their ligand-receptor pairs for different disease states |
| Ligand | Receptor | LRpair | Pathway | Tissue | Disease Stage |
| Page: 1 |
Top |
Single-cell gene regulatory network inference analysis |
| Find out the significant the regulons (TFs) and the target genes of each regulon across cell types for different disease states |
| TF | Cell Type | Tissue | Disease Stage | Target Gene | RSS | Regulon Activity |
| ∗The dot plots of a searched regulon are shown for all cell subpopulations in each disease state of each tissue based on the regulon specific score inferred using pySCENIC and by calculating the average expression. |
| Page: 1 |
Top |
Somatic mutation of malignant transformation related genes |
| Annotation of somatic variants for genes involved in malignant transformation |
| Hugo Symbol | Variant Class | Variant Classification | dbSNP RS | HGVSc | HGVSp | HGVSp Short | SWISSPROT | BIOTYPE | SIFT | PolyPhen | Tumor Sample Barcode | Tissue | Histology | Sex | Age | Stage | Therapy Types | Drugs | Outcome |
| PPIF | SNV | Missense_Mutation | novel | c.620N>A | p.Ser207Asn | p.S207N | P30405 | protein_coding | deleterious_low_confidence(0) | benign(0) | TCGA-A8-A08H-01 | Breast | breast invasive carcinoma | Female | >=65 | I/II | Unknown | Unknown | SD |
| PPIF | insertion | In_Frame_Ins | novel | c.618_619insCTTGTTCCTTTGACTCTTGACTCATCATTCATGACCGTT | p.Leu206_Ser207insLeuValProLeuThrLeuAspSerSerPheMetThrVal | p.L206_S207insLVPLTLDSSFMTV | P30405 | protein_coding | TCGA-A8-A08H-01 | Breast | breast invasive carcinoma | Female | >=65 | I/II | Unknown | Unknown | SD | ||
| PPIF | deletion | In_Frame_Del | novel | c.551_553delNNN | p.Ile184_Glu185delinsLys | p.I184_E185delinsK | P30405 | protein_coding | TCGA-E9-A5FK-01 | Breast | breast invasive carcinoma | Female | <65 | III/IV | Chemotherapy | cyclophosphamide | CR | ||
| PPIF | SNV | Missense_Mutation | novel | c.228N>T | p.Glu76Asp | p.E76D | P30405 | protein_coding | deleterious_low_confidence(0.01) | benign(0) | TCGA-A5-A0G1-01 | Endometrium | uterine corpus endometrioid carcinoma | Female | >=65 | I/II | Unknown | Unknown | SD |
| PPIF | SNV | Missense_Mutation | novel | c.365N>T | p.Gly122Val | p.G122V | P30405 | protein_coding | deleterious_low_confidence(0) | probably_damaging(0.995) | TCGA-A5-A1OF-01 | Endometrium | uterine corpus endometrioid carcinoma | Female | <65 | I/II | Unknown | Unknown | SD |
| PPIF | SNV | Missense_Mutation | rs145899672 | c.265N>A | p.Gly89Ser | p.G89S | P30405 | protein_coding | deleterious_low_confidence(0.02) | probably_damaging(1) | TCGA-AP-A059-01 | Endometrium | uterine corpus endometrioid carcinoma | Female | >=65 | I/II | Unknown | Unknown | SD |
| PPIF | SNV | Missense_Mutation | rs371203826 | c.211G>A | p.Val71Ile | p.V71I | P30405 | protein_coding | deleterious_low_confidence(0.02) | benign(0.404) | TCGA-AP-A1E0-01 | Endometrium | uterine corpus endometrioid carcinoma | Female | <65 | III/IV | Chemotherapy | paclitaxel | SD |
| PPIF | SNV | Missense_Mutation | c.569N>G | p.Lys190Arg | p.K190R | P30405 | protein_coding | tolerated_low_confidence(0.69) | benign(0.006) | TCGA-BS-A0TA-01 | Endometrium | uterine corpus endometrioid carcinoma | Female | <65 | III/IV | Chemotherapy | taxol | PD | |
| PPIF | SNV | Missense_Mutation | rs771871615 | c.364G>A | p.Gly122Arg | p.G122R | P30405 | protein_coding | deleterious_low_confidence(0.04) | possibly_damaging(0.654) | TCGA-BS-A0UV-01 | Endometrium | uterine corpus endometrioid carcinoma | Female | <65 | III/IV | Unknown | Unknown | SD |
| PPIF | SNV | Missense_Mutation | novel | c.280A>C | p.Thr94Pro | p.T94P | P30405 | protein_coding | tolerated_low_confidence(0.08) | possibly_damaging(0.864) | TCGA-D1-A0ZP-01 | Endometrium | uterine corpus endometrioid carcinoma | Female | <65 | III/IV | Chemotherapy | paclitaxel | PD |
| Page: 1 2 |
Top |
Related drugs of malignant transformation related genes |
| Identification of chemicals and drugs interact with genes involved in malignant transfromation |
| (DGIdb 4.0) |
| Entrez ID | Symbol | Category | Interaction Types | Drug Claim Name | Drug Name | PMIDs |
| Page: 1 |

Copyright 2023-Present -The University of Texas Health Science Center at Houston |