
|
|||||
|
 | |
| |
| |
| |
| |
| |
|
Gene: PPID |
Gene summary for PPID |
| Gene information | Species | Human | Gene symbol | PPID | Gene ID | 5481 |
| Gene name | peptidylprolyl isomerase D | |
| Gene Alias | CYP-40 | |
| Cytomap | 4q32.1 | |
| Gene Type | protein-coding | GO ID | GO:0000122 | UniProtAcc | E5KN55 |
Top |
Malignant transformation analysis |
| Identification of the aberrant gene expression in precancerous and cancerous lesions by comparing the gene expression of stem-like cells in diseased tissues with normal stem cells |
| Entrez ID | Symbol | Replicates | Species | Organ | Tissue | Adj P-value | Log2FC | Malignancy |
| 5481 | PPID | LZE4T | Human | Esophagus | ESCC | 3.47e-12 | 5.28e-01 | 0.0811 |
| 5481 | PPID | LZE7T | Human | Esophagus | ESCC | 7.00e-09 | 2.47e-01 | 0.0667 |
| 5481 | PPID | LZE8T | Human | Esophagus | ESCC | 1.77e-03 | 2.79e-01 | 0.067 |
| 5481 | PPID | LZE20T | Human | Esophagus | ESCC | 1.35e-03 | 2.93e-01 | 0.0662 |
| 5481 | PPID | LZE22T | Human | Esophagus | ESCC | 5.20e-04 | 3.27e-01 | 0.068 |
| 5481 | PPID | LZE24T | Human | Esophagus | ESCC | 1.28e-11 | 3.85e-01 | 0.0596 |
| 5481 | PPID | LZE6T | Human | Esophagus | ESCC | 7.03e-09 | 4.03e-01 | 0.0845 |
| 5481 | PPID | P2T-E | Human | Esophagus | ESCC | 2.23e-42 | 7.76e-01 | 0.1177 |
| 5481 | PPID | P4T-E | Human | Esophagus | ESCC | 2.24e-31 | 7.07e-01 | 0.1323 |
| 5481 | PPID | P5T-E | Human | Esophagus | ESCC | 3.60e-17 | 4.00e-01 | 0.1327 |
| 5481 | PPID | P8T-E | Human | Esophagus | ESCC | 1.87e-16 | 3.70e-01 | 0.0889 |
| 5481 | PPID | P9T-E | Human | Esophagus | ESCC | 6.42e-12 | 2.27e-01 | 0.1131 |
| 5481 | PPID | P10T-E | Human | Esophagus | ESCC | 6.05e-17 | 3.00e-01 | 0.116 |
| 5481 | PPID | P11T-E | Human | Esophagus | ESCC | 1.31e-22 | 9.55e-01 | 0.1426 |
| 5481 | PPID | P12T-E | Human | Esophagus | ESCC | 1.40e-52 | 9.70e-01 | 0.1122 |
| 5481 | PPID | P15T-E | Human | Esophagus | ESCC | 8.09e-19 | 5.33e-01 | 0.1149 |
| 5481 | PPID | P16T-E | Human | Esophagus | ESCC | 4.62e-39 | 7.44e-01 | 0.1153 |
| 5481 | PPID | P17T-E | Human | Esophagus | ESCC | 2.17e-15 | 7.36e-01 | 0.1278 |
| 5481 | PPID | P19T-E | Human | Esophagus | ESCC | 1.29e-12 | 1.02e+00 | 0.1662 |
| 5481 | PPID | P20T-E | Human | Esophagus | ESCC | 4.57e-18 | 4.21e-01 | 0.1124 |
| Page: 1 2 3 4 5 6 |
| Tissue | Expression Dynamics | Abbreviation |
| Esophagus |  | ESCC: Esophageal squamous cell carcinoma |
| HGIN: High-grade intraepithelial neoplasias | ||
| LGIN: Low-grade intraepithelial neoplasias | ||
| Liver | 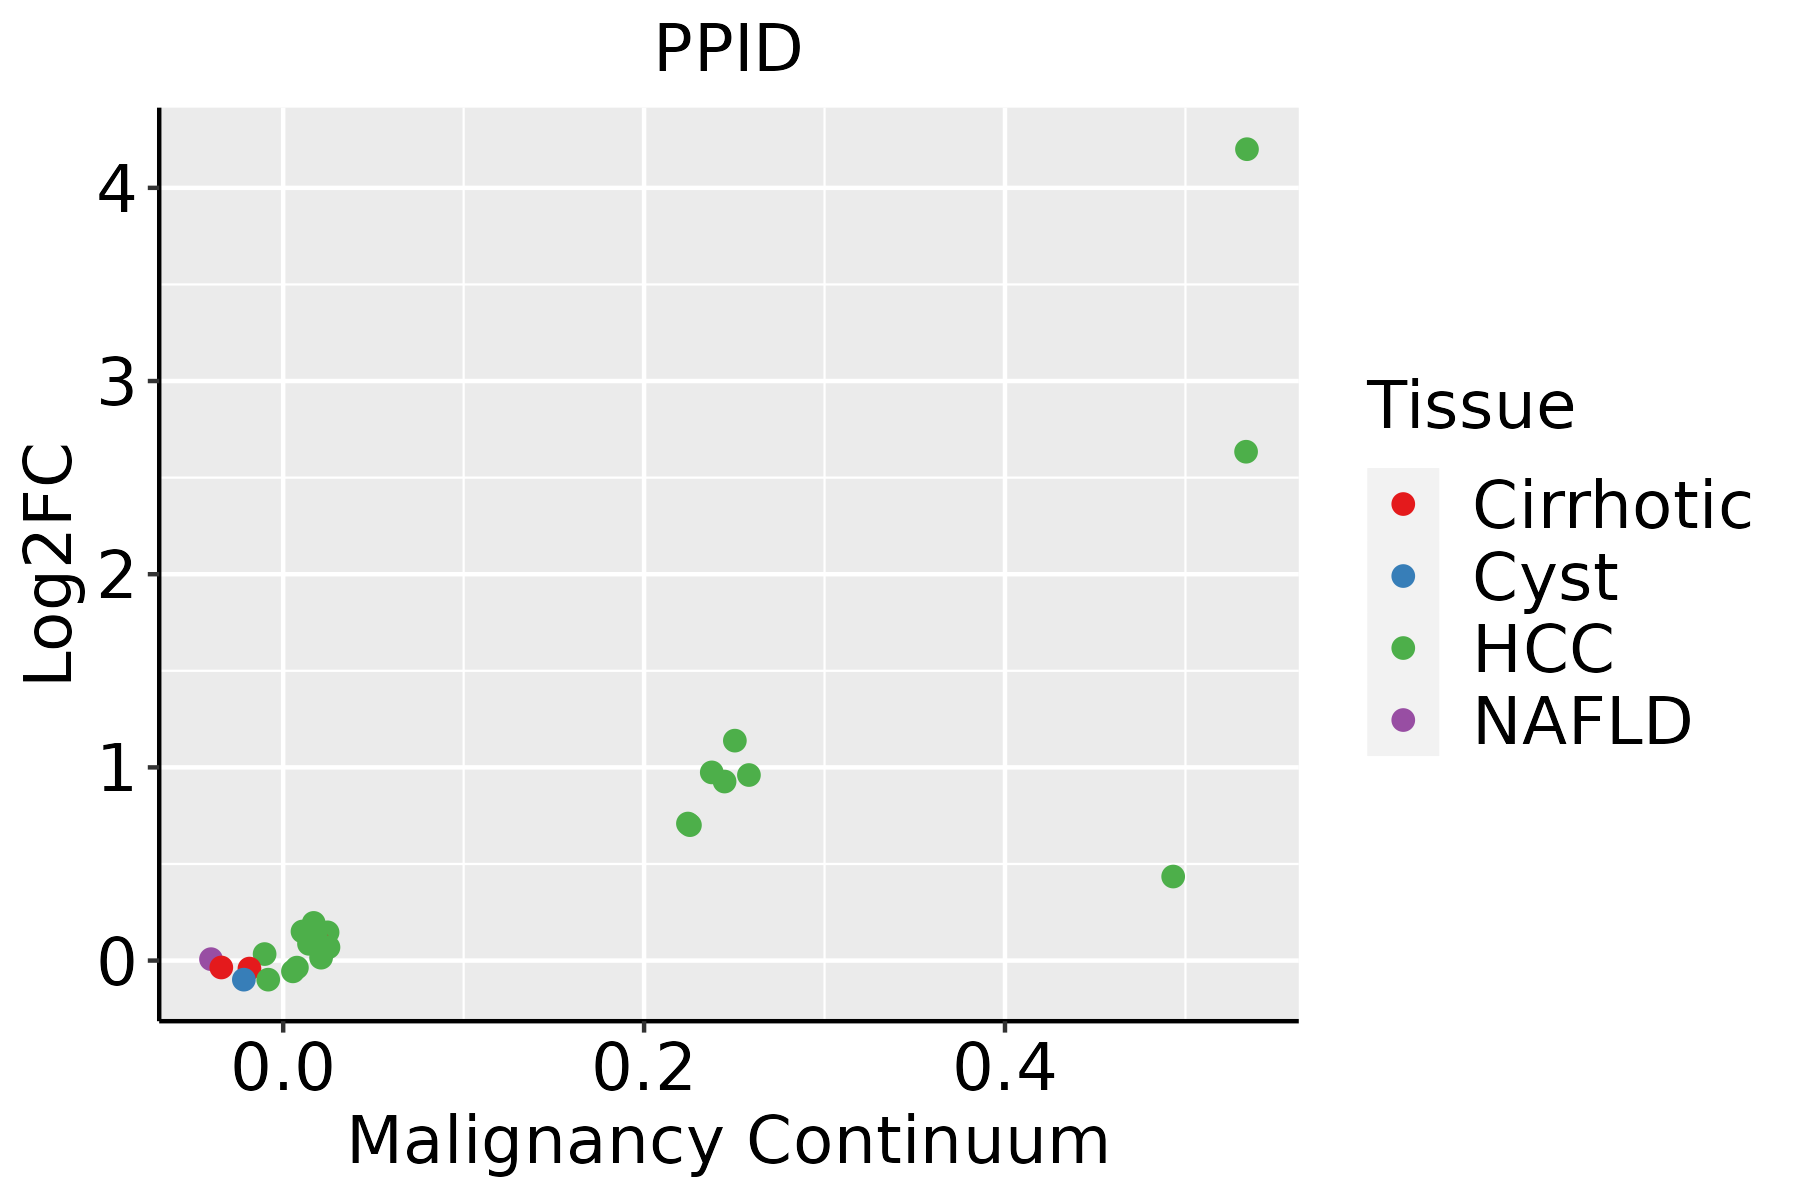 | HCC: Hepatocellular carcinoma |
| NAFLD: Non-alcoholic fatty liver disease | ||
| Oral Cavity |  | EOLP: Erosive Oral lichen planus |
| LP: leukoplakia | ||
| NEOLP: Non-erosive oral lichen planus | ||
| OSCC: Oral squamous cell carcinoma | ||
| Skin | 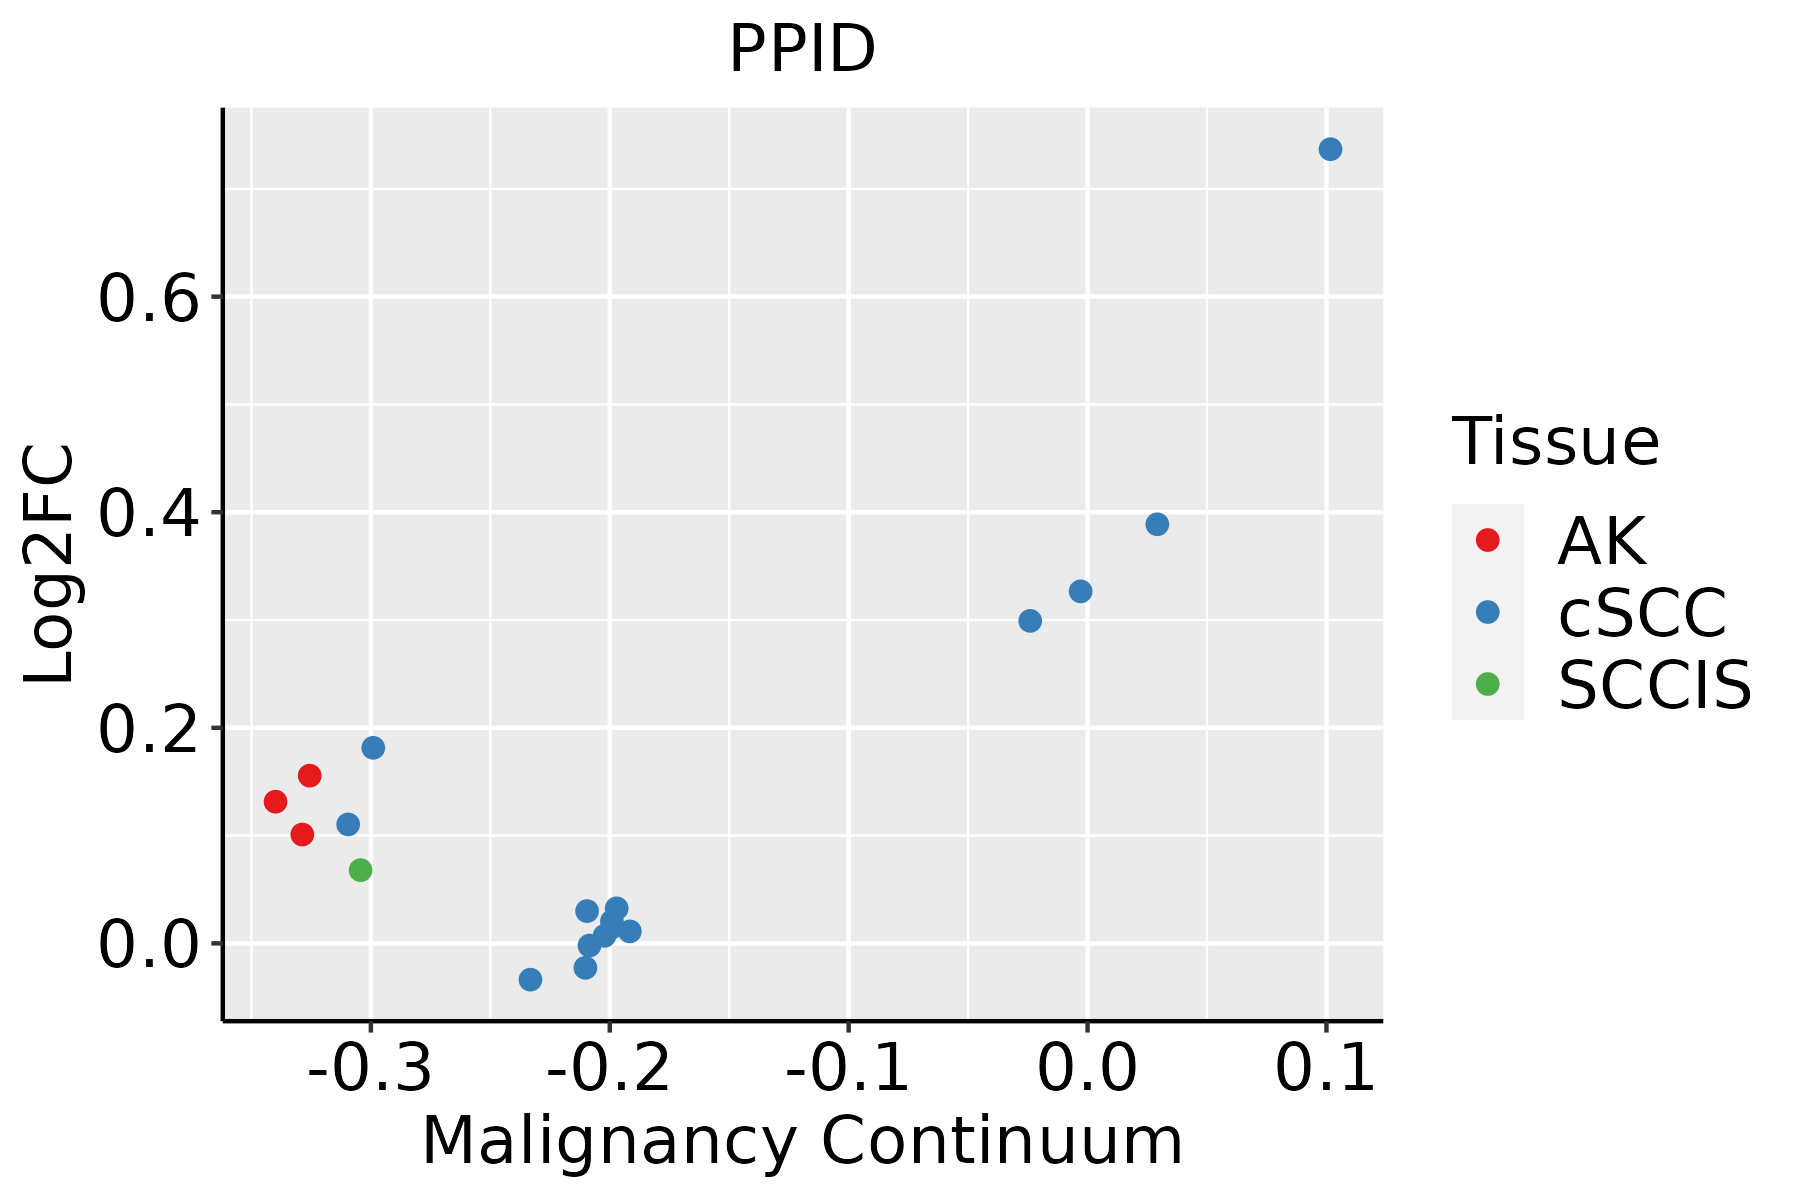 | AK: Actinic keratosis |
| cSCC: Cutaneous squamous cell carcinoma | ||
| SCCIS:squamous cell carcinoma in situ | ||
| Thyroid |  | ATC: Anaplastic thyroid cancer |
| HT: Hashimoto's thyroiditis | ||
| PTC: Papillary thyroid cancer |
| ∗log2FC in expression of this searched gene in stem-like cells from each diseased tissue sample relative to stem-like cells in normal samples in each tissue plotted against the malignancy continuum. Samples are colored based on if they are from different disease stage. |
Top |
Malignant transformation related pathway analysis |
| Find out the enriched GO biological processes and KEGG pathways involved in transition from healthy to precancer to cancer |
| Tissue | Disease Stage | Enriched GO biological Processes |
| Colorectum | AD |  |
| Colorectum | SER |  |
| Colorectum | MSS |  |
| Colorectum | MSI-H |  |
| Colorectum | FAP |  |
| ∗Top 15 enriched GO BP terms are showed in the bar plot of each disease state in each tissue. Each row represents a significant GO biological process which is colored according to the -log10(p.adjust). |
| Page: 1 2 3 4 5 6 7 8 9 |
| GO ID | Tissue | Disease Stage | Description | Gene Ratio | Bg Ratio | pvalue | p.adjust | Count |
| GO:0016032111 | Esophagus | ESCC | viral process | 301/8552 | 415/18723 | 3.34e-29 | 1.32e-26 | 301 |
| GO:0006457110 | Esophagus | ESCC | protein folding | 163/8552 | 212/18723 | 1.13e-20 | 1.74e-18 | 163 |
| GO:0019058111 | Esophagus | ESCC | viral life cycle | 226/8552 | 317/18723 | 1.17e-20 | 1.76e-18 | 226 |
| GO:1904951111 | Esophagus | ESCC | positive regulation of establishment of protein localization | 216/8552 | 319/18723 | 1.01e-15 | 6.86e-14 | 216 |
| GO:000941113 | Esophagus | ESCC | response to UV | 115/8552 | 149/18723 | 3.29e-15 | 1.93e-13 | 115 |
| GO:0051222111 | Esophagus | ESCC | positive regulation of protein transport | 204/8552 | 303/18723 | 1.56e-14 | 8.38e-13 | 204 |
| GO:0019079111 | Esophagus | ESCC | viral genome replication | 102/8552 | 131/18723 | 4.31e-14 | 2.19e-12 | 102 |
| GO:0050792111 | Esophagus | ESCC | regulation of viral process | 119/8552 | 164/18723 | 2.19e-12 | 9.03e-11 | 119 |
| GO:000931419 | Esophagus | ESCC | response to radiation | 277/8552 | 456/18723 | 4.42e-11 | 1.43e-09 | 277 |
| GO:1903900111 | Esophagus | ESCC | regulation of viral life cycle | 106/8552 | 148/18723 | 1.26e-10 | 3.72e-09 | 106 |
| GO:0044403111 | Esophagus | ESCC | biological process involved in symbiotic interaction | 186/8552 | 290/18723 | 1.43e-10 | 4.16e-09 | 186 |
| GO:0061077110 | Esophagus | ESCC | chaperone-mediated protein folding | 56/8552 | 67/18723 | 1.52e-10 | 4.36e-09 | 56 |
| GO:0045069110 | Esophagus | ESCC | regulation of viral genome replication | 67/8552 | 85/18723 | 3.81e-10 | 1.04e-08 | 67 |
| GO:003464413 | Esophagus | ESCC | cellular response to UV | 70/8552 | 90/18723 | 4.59e-10 | 1.20e-08 | 70 |
| GO:007121419 | Esophagus | ESCC | cellular response to abiotic stimulus | 206/8552 | 331/18723 | 7.52e-10 | 1.88e-08 | 206 |
| GO:010400419 | Esophagus | ESCC | cellular response to environmental stimulus | 206/8552 | 331/18723 | 7.52e-10 | 1.88e-08 | 206 |
| GO:0051701111 | Esophagus | ESCC | biological process involved in interaction with host | 135/8552 | 203/18723 | 1.49e-09 | 3.49e-08 | 135 |
| GO:0052126111 | Esophagus | ESCC | movement in host environment | 117/8552 | 175/18723 | 1.14e-08 | 2.26e-07 | 117 |
| GO:0048524110 | Esophagus | ESCC | positive regulation of viral process | 52/8552 | 65/18723 | 1.41e-08 | 2.77e-07 | 52 |
| GO:007147816 | Esophagus | ESCC | cellular response to radiation | 122/8552 | 186/18723 | 3.07e-08 | 5.73e-07 | 122 |
| Page: 1 2 3 4 5 6 7 8 9 10 11 |
| Pathway ID | Tissue | Disease Stage | Description | Gene Ratio | Bg Ratio | pvalue | p.adjust | qvalue | Count |
| hsa05022210 | Esophagus | ESCC | Pathways of neurodegeneration - multiple diseases | 318/4205 | 476/8465 | 6.10e-15 | 2.04e-13 | 1.05e-13 | 318 |
| hsa05010210 | Esophagus | ESCC | Alzheimer disease | 263/4205 | 384/8465 | 1.80e-14 | 5.47e-13 | 2.80e-13 | 263 |
| hsa05131211 | Esophagus | ESCC | Shigellosis | 176/4205 | 247/8465 | 2.27e-12 | 4.01e-11 | 2.05e-11 | 176 |
| hsa0421829 | Esophagus | ESCC | Cellular senescence | 119/4205 | 156/8465 | 5.89e-12 | 9.40e-11 | 4.81e-11 | 119 |
| hsa0502238 | Esophagus | ESCC | Pathways of neurodegeneration - multiple diseases | 318/4205 | 476/8465 | 6.10e-15 | 2.04e-13 | 1.05e-13 | 318 |
| hsa0501038 | Esophagus | ESCC | Alzheimer disease | 263/4205 | 384/8465 | 1.80e-14 | 5.47e-13 | 2.80e-13 | 263 |
| hsa05131310 | Esophagus | ESCC | Shigellosis | 176/4205 | 247/8465 | 2.27e-12 | 4.01e-11 | 2.05e-11 | 176 |
| hsa0421838 | Esophagus | ESCC | Cellular senescence | 119/4205 | 156/8465 | 5.89e-12 | 9.40e-11 | 4.81e-11 | 119 |
| hsa0501022 | Liver | HCC | Alzheimer disease | 254/4020 | 384/8465 | 3.75e-14 | 8.97e-13 | 4.99e-13 | 254 |
| hsa0502222 | Liver | HCC | Pathways of neurodegeneration - multiple diseases | 298/4020 | 476/8465 | 6.59e-12 | 1.30e-10 | 7.22e-11 | 298 |
| hsa0421822 | Liver | HCC | Cellular senescence | 102/4020 | 156/8465 | 4.18e-06 | 3.59e-05 | 2.00e-05 | 102 |
| hsa0513142 | Liver | HCC | Shigellosis | 150/4020 | 247/8465 | 1.53e-05 | 1.04e-04 | 5.81e-05 | 150 |
| hsa0501032 | Liver | HCC | Alzheimer disease | 254/4020 | 384/8465 | 3.75e-14 | 8.97e-13 | 4.99e-13 | 254 |
| hsa0502232 | Liver | HCC | Pathways of neurodegeneration - multiple diseases | 298/4020 | 476/8465 | 6.59e-12 | 1.30e-10 | 7.22e-11 | 298 |
| hsa0421832 | Liver | HCC | Cellular senescence | 102/4020 | 156/8465 | 4.18e-06 | 3.59e-05 | 2.00e-05 | 102 |
| hsa0513152 | Liver | HCC | Shigellosis | 150/4020 | 247/8465 | 1.53e-05 | 1.04e-04 | 5.81e-05 | 150 |
| hsa0501028 | Oral cavity | OSCC | Alzheimer disease | 244/3704 | 384/8465 | 1.18e-15 | 3.60e-14 | 1.83e-14 | 244 |
| hsa0502228 | Oral cavity | OSCC | Pathways of neurodegeneration - multiple diseases | 292/3704 | 476/8465 | 1.60e-15 | 4.47e-14 | 2.28e-14 | 292 |
| hsa0421820 | Oral cavity | OSCC | Cellular senescence | 112/3704 | 156/8465 | 8.04e-13 | 1.42e-11 | 7.21e-12 | 112 |
| hsa0513130 | Oral cavity | OSCC | Shigellosis | 150/3704 | 247/8465 | 3.96e-08 | 3.12e-07 | 1.59e-07 | 150 |
| Page: 1 2 |
Top |
Cell-cell communication analysis |
| Identification of potential cell-cell interactions between two cell types and their ligand-receptor pairs for different disease states |
| Ligand | Receptor | LRpair | Pathway | Tissue | Disease Stage |
| Page: 1 |
Top |
Single-cell gene regulatory network inference analysis |
| Find out the significant the regulons (TFs) and the target genes of each regulon across cell types for different disease states |
| TF | Cell Type | Tissue | Disease Stage | Target Gene | RSS | Regulon Activity |
| ∗The dot plots of a searched regulon are shown for all cell subpopulations in each disease state of each tissue based on the regulon specific score inferred using pySCENIC and by calculating the average expression. |
| Page: 1 |
Top |
Somatic mutation of malignant transformation related genes |
| Annotation of somatic variants for genes involved in malignant transformation |
| Hugo Symbol | Variant Class | Variant Classification | dbSNP RS | HGVSc | HGVSp | HGVSp Short | SWISSPROT | BIOTYPE | SIFT | PolyPhen | Tumor Sample Barcode | Tissue | Histology | Sex | Age | Stage | Therapy Types | Drugs | Outcome |
| PPID | SNV | Missense_Mutation | c.227N>G | p.Ile76Ser | p.I76S | Q08752 | protein_coding | deleterious(0) | possibly_damaging(0.806) | TCGA-A1-A0SG-01 | Breast | breast invasive carcinoma | Female | <65 | I/II | Chemotherapy | SD | ||
| PPID | SNV | Missense_Mutation | c.13N>G | p.Ser5Ala | p.S5A | Q08752 | protein_coding | tolerated_low_confidence(0.4) | benign(0.003) | TCGA-E2-A154-01 | Breast | breast invasive carcinoma | Female | >=65 | I/II | Hormone Therapy | arimidex | SD | |
| PPID | SNV | Missense_Mutation | c.901N>C | p.Glu301Gln | p.E301Q | Q08752 | protein_coding | tolerated(0.17) | benign(0.055) | TCGA-IR-A3LH-01 | Cervix | cervical & endocervical cancer | Female | <65 | I/II | Chemotherapy | cisplatin | CR | |
| PPID | SNV | Missense_Mutation | c.392A>C | p.Gln131Pro | p.Q131P | Q08752 | protein_coding | deleterious(0) | probably_damaging(0.994) | TCGA-A6-6141-01 | Colorectum | colon adenocarcinoma | Male | <65 | I/II | Chemotherapy | 5-fu | SD | |
| PPID | SNV | Missense_Mutation | c.916A>C | p.Asn306His | p.N306H | Q08752 | protein_coding | tolerated(0.1) | possibly_damaging(0.452) | TCGA-AA-3510-01 | Colorectum | colon adenocarcinoma | Male | >=65 | I/II | Unknown | Unknown | SD | |
| PPID | SNV | Missense_Mutation | rs370283252 | c.374N>A | p.Arg125His | p.R125H | Q08752 | protein_coding | deleterious(0.01) | benign(0) | TCGA-AA-A00N-01 | Colorectum | colon adenocarcinoma | Male | >=65 | I/II | Unknown | Unknown | PD |
| PPID | SNV | Missense_Mutation | c.673N>A | p.Asp225Asn | p.D225N | Q08752 | protein_coding | tolerated(0.08) | benign(0.003) | TCGA-AA-A010-01 | Colorectum | colon adenocarcinoma | Female | <65 | I/II | Chemotherapy | folinic | CR | |
| PPID | SNV | Missense_Mutation | c.265A>C | p.Asn89His | p.N89H | Q08752 | protein_coding | tolerated(0.14) | benign(0.113) | TCGA-AG-3892-01 | Colorectum | rectum adenocarcinoma | Female | <65 | I/II | Unknown | Unknown | SD | |
| PPID | SNV | Missense_Mutation | c.654A>C | p.Lys218Asn | p.K218N | Q08752 | protein_coding | tolerated(0.52) | benign(0.009) | TCGA-EI-6917-01 | Colorectum | rectum adenocarcinoma | Male | <65 | III/IV | Chemotherapy | 5fluorouracil+oxaciplatina+l-folinian | SD | |
| PPID | insertion | Frame_Shift_Ins | novel | c.399_400insT | p.Ile134TyrfsTer21 | p.I134Yfs*21 | Q08752 | protein_coding | TCGA-A6-2672-01 | Colorectum | colon adenocarcinoma | Female | >=65 | III/IV | Unknown | Unknown | SD |
| Page: 1 2 3 4 |
Top |
Related drugs of malignant transformation related genes |
| Identification of chemicals and drugs interact with genes involved in malignant transfromation |
| (DGIdb 4.0) |
| Entrez ID | Symbol | Category | Interaction Types | Drug Claim Name | Drug Name | PMIDs |
| 5481 | PPID | DRUGGABLE GENOME, TRANSCRIPTION FACTOR BINDING, KINASE | US8901295, F673 | |||
| 5481 | PPID | DRUGGABLE GENOME, TRANSCRIPTION FACTOR BINDING, KINASE | SCY-635 | SCY 635 | ||
| 5481 | PPID | DRUGGABLE GENOME, TRANSCRIPTION FACTOR BINDING, KINASE | US8901295, F609 | |||
| 5481 | PPID | DRUGGABLE GENOME, TRANSCRIPTION FACTOR BINDING, KINASE | 1313212-89-3 |
| Page: 1 |

Copyright 2023-Present -The University of Texas Health Science Center at Houston |