
|
|||||
|
 | |
| |
| |
| |
| |
| |
|
Gene: PPIC |
Gene summary for PPIC |
| Gene information | Species | Human | Gene symbol | PPIC | Gene ID | 5480 |
| Gene name | peptidylprolyl isomerase C | |
| Gene Alias | CYPC | |
| Cytomap | 5q23.2 | |
| Gene Type | protein-coding | GO ID | GO:0000413 | UniProtAcc | P45877 |
Top |
Malignant transformation analysis |
| Identification of the aberrant gene expression in precancerous and cancerous lesions by comparing the gene expression of stem-like cells in diseased tissues with normal stem cells |
| Entrez ID | Symbol | Replicates | Species | Organ | Tissue | Adj P-value | Log2FC | Malignancy |
| 5480 | PPIC | CA_HPV_1 | Human | Cervix | CC | 2.18e-05 | -1.71e-01 | 0.0264 |
| 5480 | PPIC | N_HPV_1 | Human | Cervix | N_HPV | 3.97e-02 | -1.71e-01 | 0.0079 |
| 5480 | PPIC | Tumor | Human | Cervix | CC | 3.98e-26 | 6.82e-01 | 0.1241 |
| 5480 | PPIC | sample3 | Human | Cervix | CC | 1.50e-33 | 6.50e-01 | 0.1387 |
| 5480 | PPIC | T1 | Human | Cervix | CC | 4.97e-06 | 2.83e-01 | 0.0918 |
| 5480 | PPIC | T3 | Human | Cervix | CC | 1.00e-28 | 6.71e-01 | 0.1389 |
| 5480 | PPIC | HTA11_2487_2000001011 | Human | Colorectum | SER | 5.89e-09 | 4.05e-01 | -0.1808 |
| 5480 | PPIC | HTA11_1938_2000001011 | Human | Colorectum | AD | 4.58e-09 | 3.61e-01 | -0.0811 |
| 5480 | PPIC | HTA11_78_2000001011 | Human | Colorectum | AD | 6.38e-07 | 2.95e-01 | -0.1088 |
| 5480 | PPIC | HTA11_347_2000001011 | Human | Colorectum | AD | 9.40e-17 | 4.14e-01 | -0.1954 |
| 5480 | PPIC | HTA11_83_2000001011 | Human | Colorectum | SER | 2.54e-08 | 3.92e-01 | -0.1526 |
| 5480 | PPIC | HTA11_696_2000001011 | Human | Colorectum | AD | 2.60e-10 | 4.23e-01 | -0.1464 |
| 5480 | PPIC | HTA11_1391_2000001011 | Human | Colorectum | AD | 5.19e-06 | 2.35e-01 | -0.059 |
| 5480 | PPIC | HTA11_5212_2000001011 | Human | Colorectum | AD | 3.97e-05 | 3.71e-01 | -0.2061 |
| 5480 | PPIC | HTA11_7862_2000001011 | Human | Colorectum | AD | 3.41e-03 | 3.22e-01 | -0.0179 |
| 5480 | PPIC | HTA11_866_3004761011 | Human | Colorectum | AD | 2.73e-02 | 1.78e-01 | 0.096 |
| 5480 | PPIC | HTA11_10623_2000001011 | Human | Colorectum | AD | 9.46e-04 | 2.49e-01 | -0.0177 |
| 5480 | PPIC | HTA11_6801_2000001011 | Human | Colorectum | SER | 3.53e-13 | 6.42e-01 | 0.0171 |
| 5480 | PPIC | HTA11_7469_2000001011 | Human | Colorectum | AD | 1.18e-02 | 4.43e-01 | -0.0124 |
| 5480 | PPIC | HTA11_99999970781_79442 | Human | Colorectum | MSS | 2.36e-08 | 3.25e-01 | 0.294 |
| Page: 1 2 3 4 5 6 7 8 9 10 |
| Tissue | Expression Dynamics | Abbreviation |
| Cervix |  | CC: Cervix cancer |
| HSIL_HPV: HPV-infected high-grade squamous intraepithelial lesions | ||
| N_HPV: HPV-infected normal cervix | ||
| Colorectum (GSE201348) |  | FAP: Familial adenomatous polyposis |
| CRC: Colorectal cancer | ||
| Colorectum (HTA11) |  | AD: Adenomas |
| SER: Sessile serrated lesions | ||
| MSI-H: Microsatellite-high colorectal cancer | ||
| MSS: Microsatellite stable colorectal cancer | ||
| Endometrium | 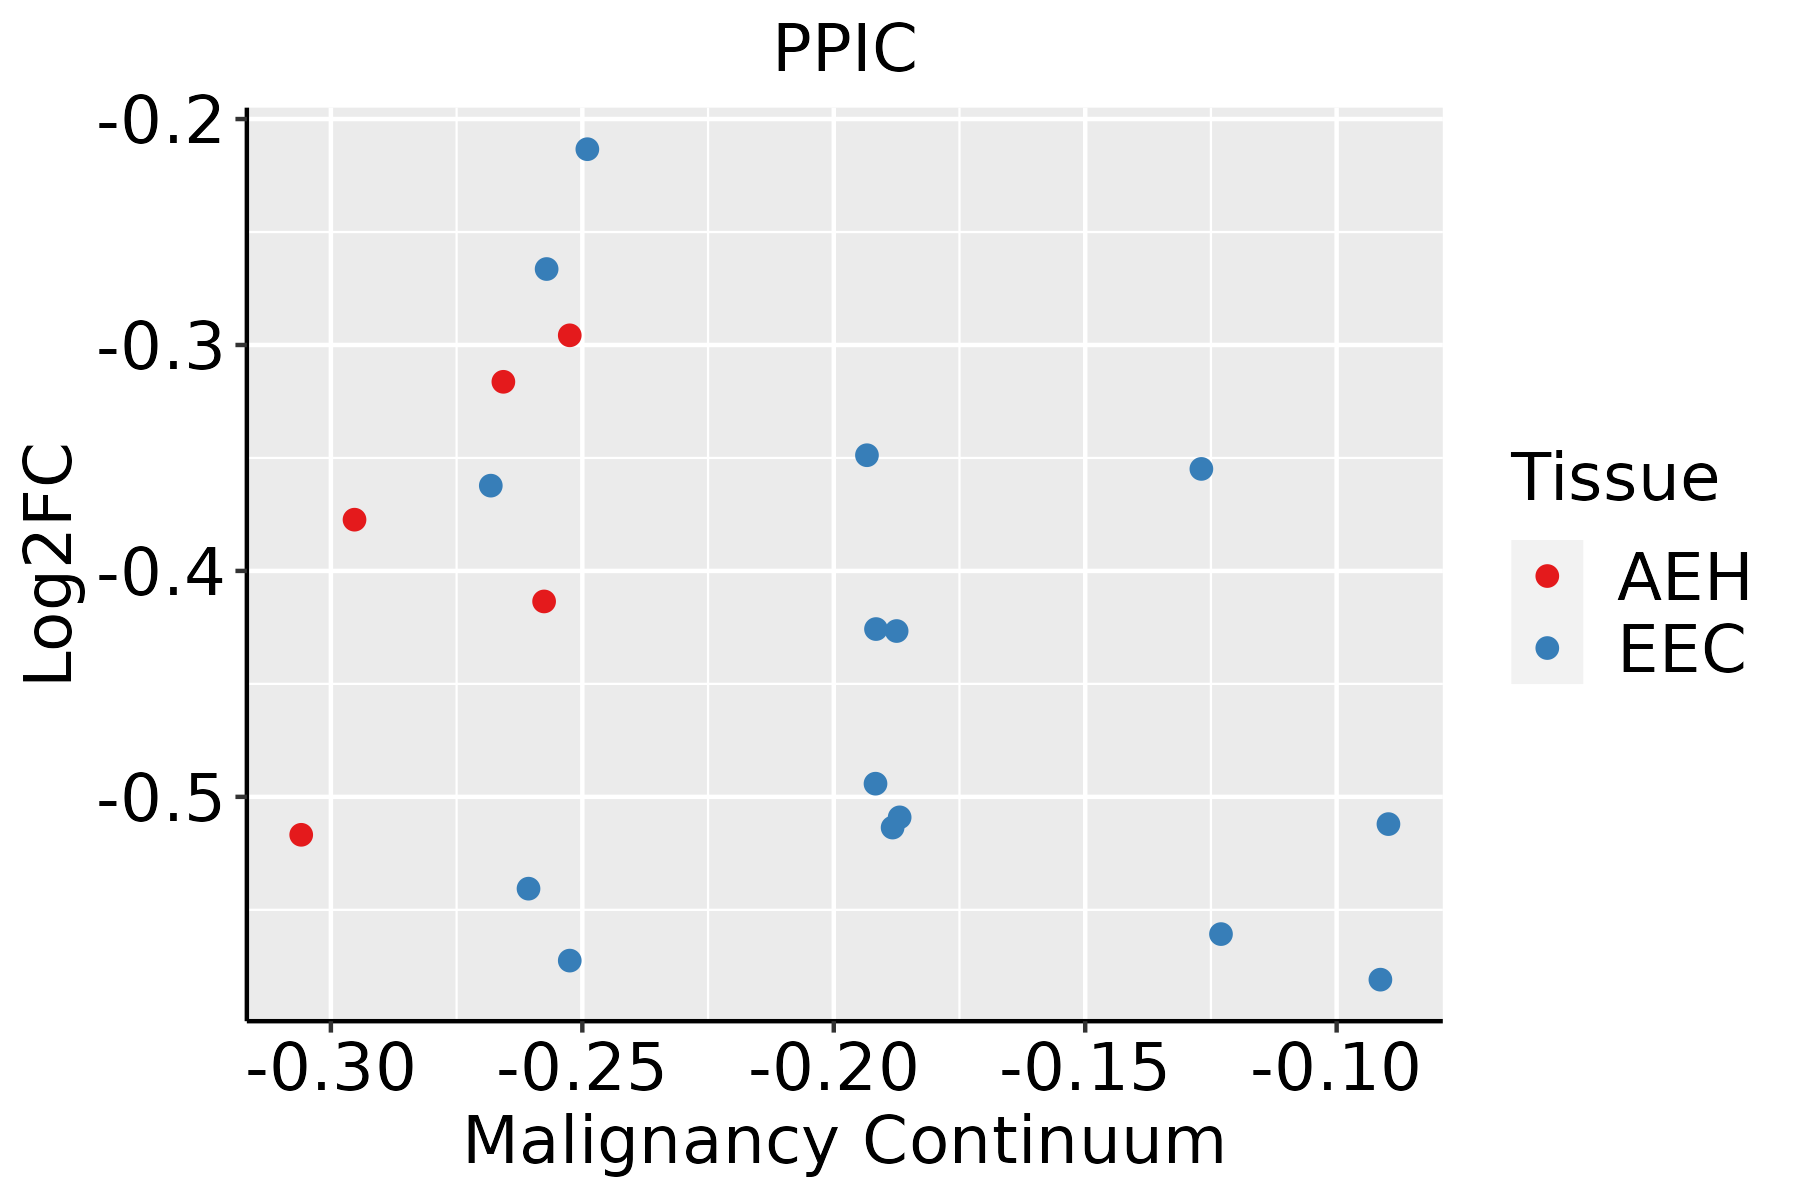 | AEH: Atypical endometrial hyperplasia |
| EEC: Endometrioid Cancer | ||
| Esophagus | 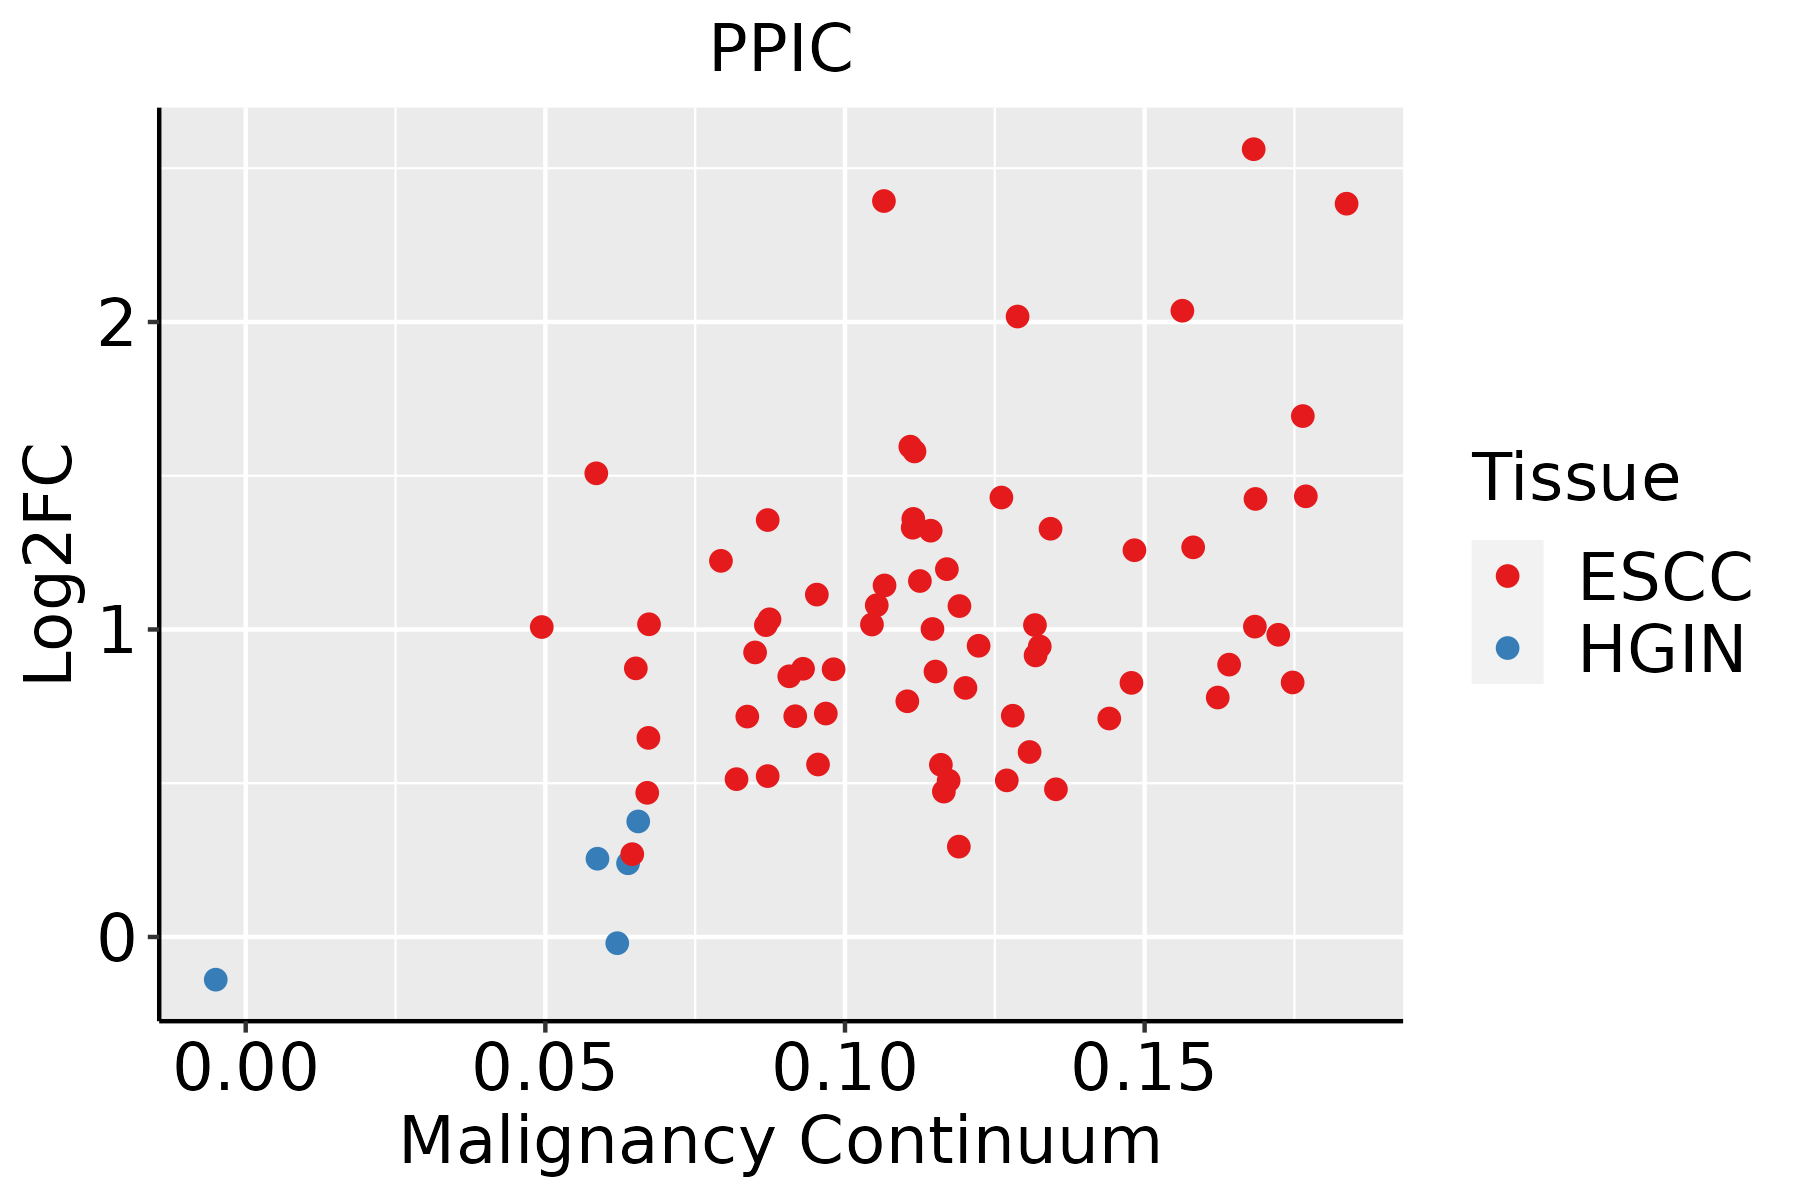 | ESCC: Esophageal squamous cell carcinoma |
| HGIN: High-grade intraepithelial neoplasias | ||
| LGIN: Low-grade intraepithelial neoplasias | ||
| GC |  | CAG: Chronic atrophic gastritis |
| CAG with IM: Chronic atrophic gastritis with intestinal metaplasia | ||
| CSG: Chronic superficial gastritis | ||
| GC: Gastric cancer | ||
| SIM: Severe intestinal metaplasia | ||
| WIM: Wild intestinal metaplasia | ||
| Liver | 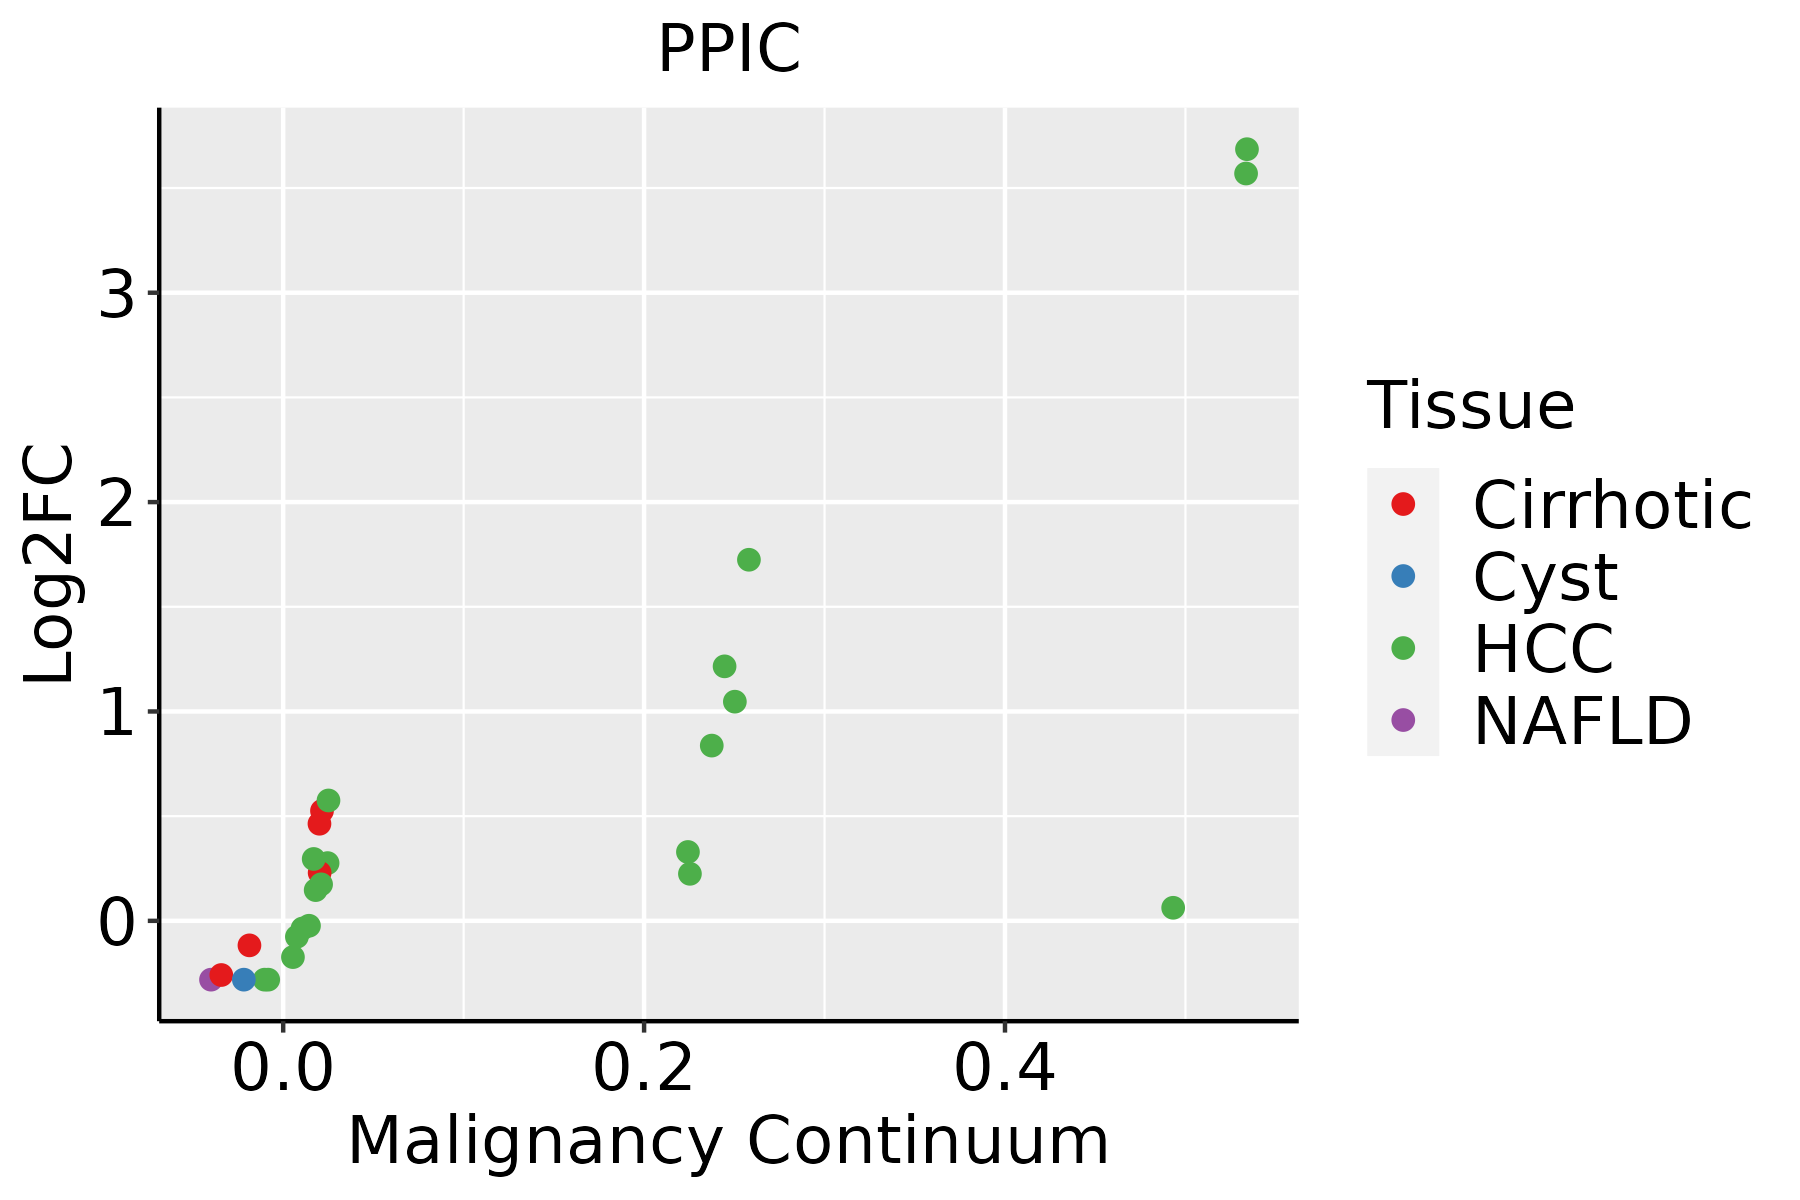 | HCC: Hepatocellular carcinoma |
| NAFLD: Non-alcoholic fatty liver disease | ||
| Oral Cavity | 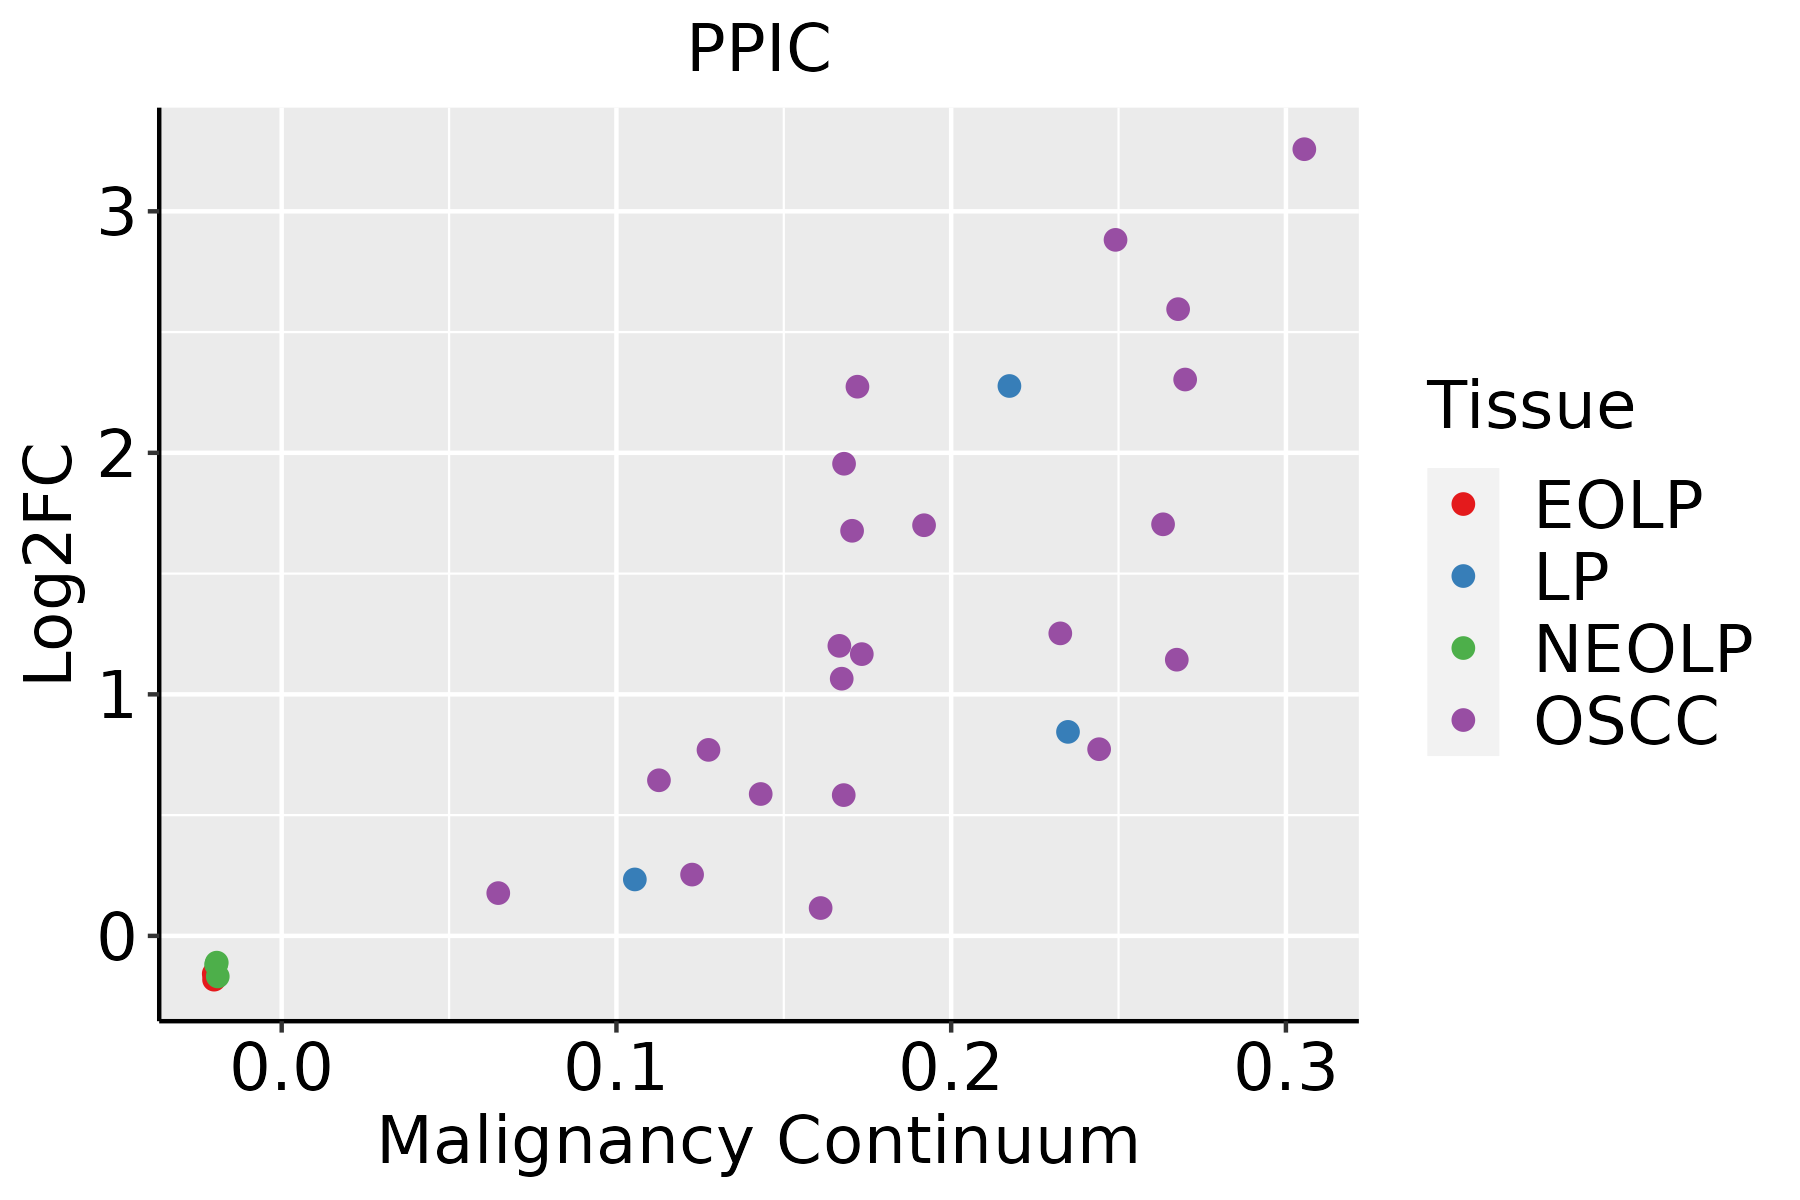 | EOLP: Erosive Oral lichen planus |
| LP: leukoplakia | ||
| NEOLP: Non-erosive oral lichen planus | ||
| OSCC: Oral squamous cell carcinoma | ||
| Skin | 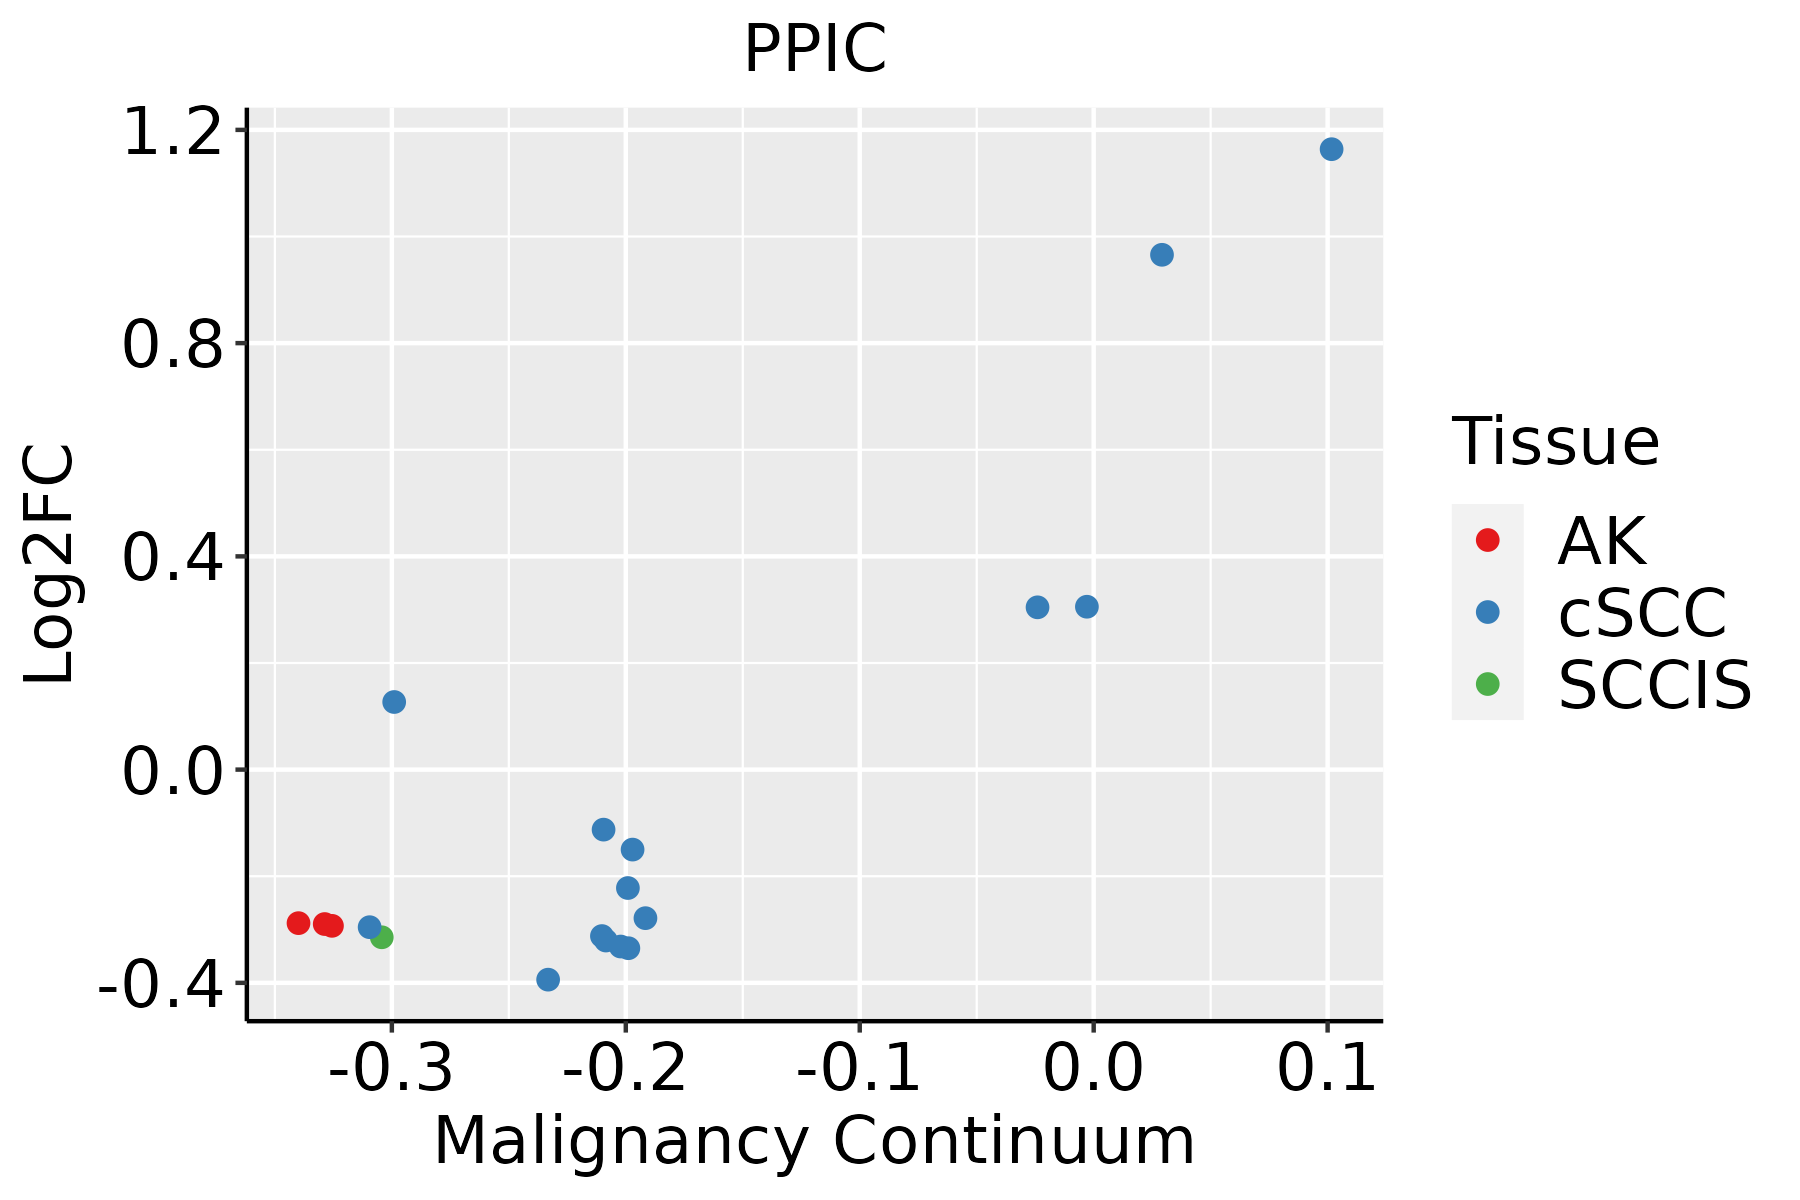 | AK: Actinic keratosis |
| cSCC: Cutaneous squamous cell carcinoma | ||
| SCCIS:squamous cell carcinoma in situ | ||
| Thyroid | 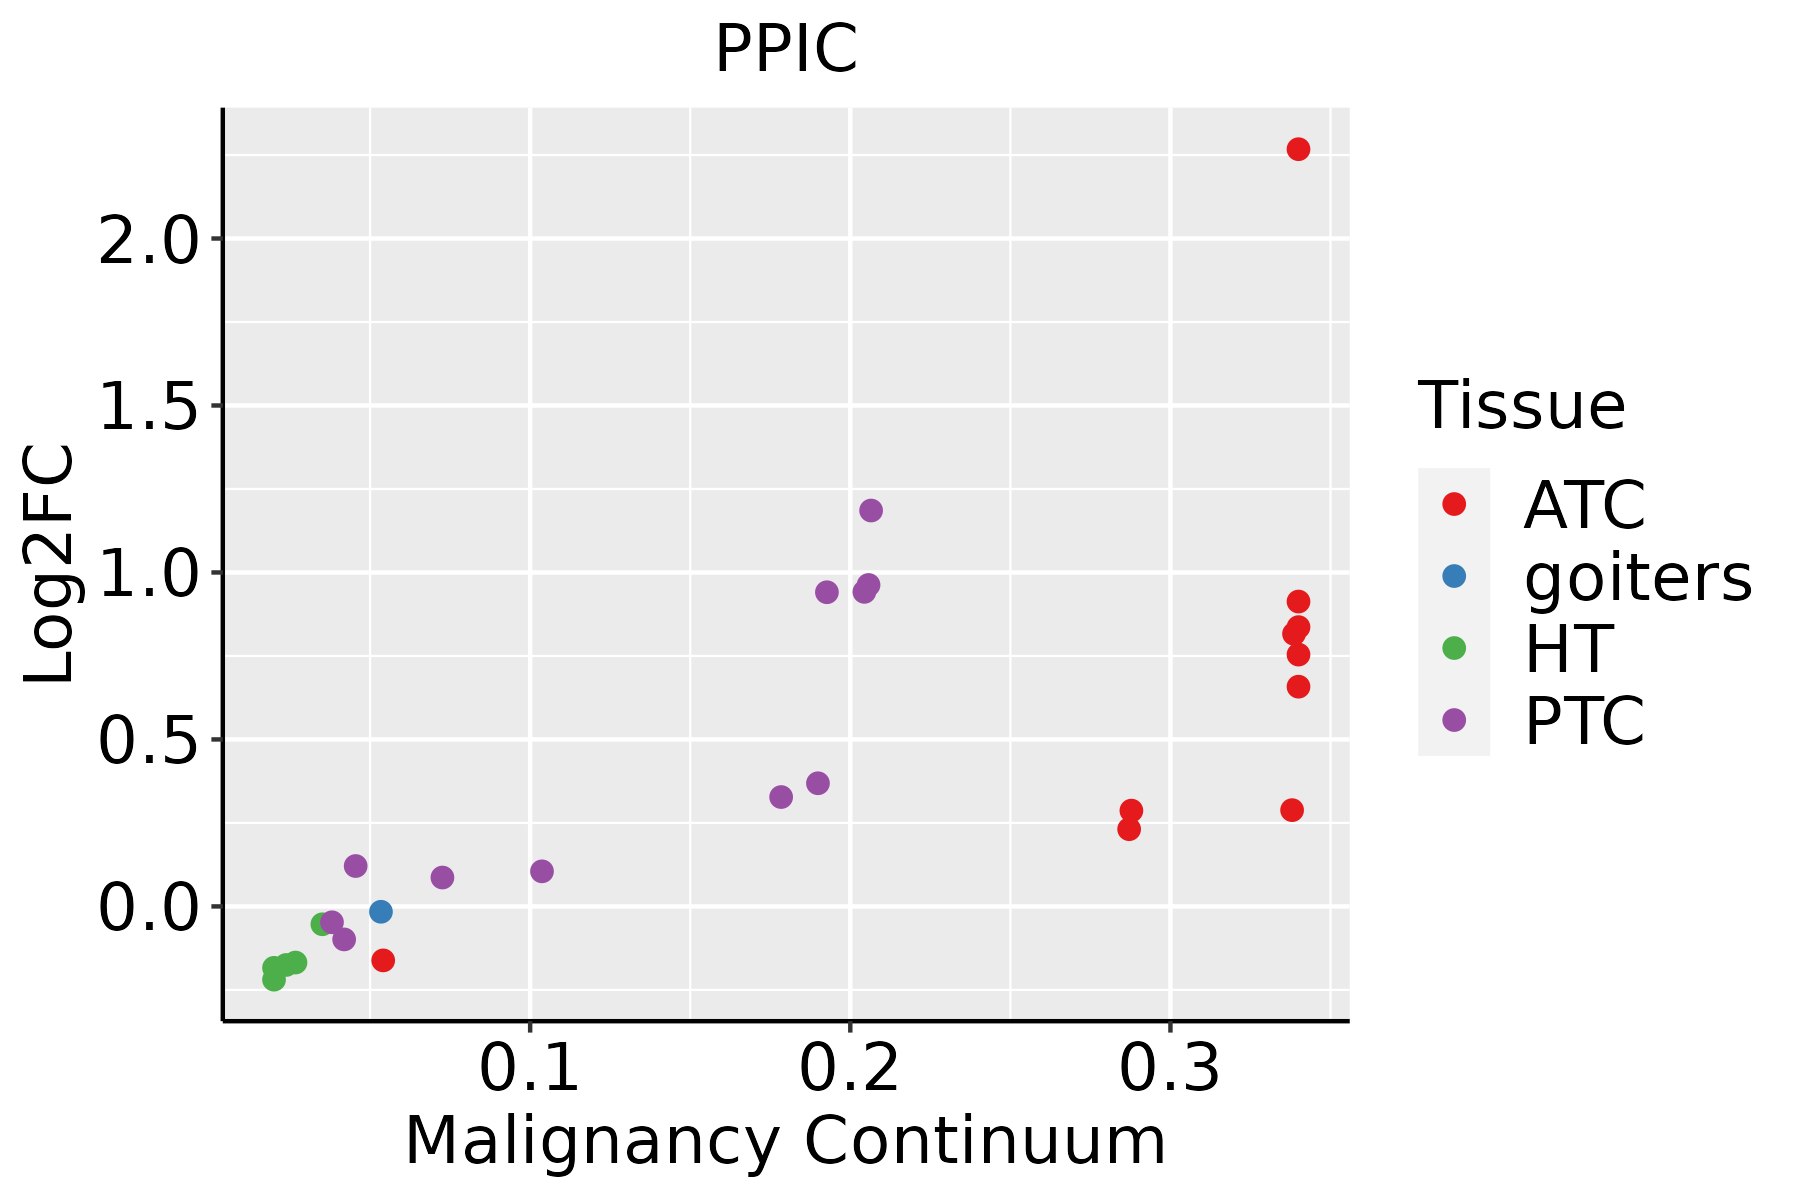 | ATC: Anaplastic thyroid cancer |
| HT: Hashimoto's thyroiditis | ||
| PTC: Papillary thyroid cancer |
| ∗log2FC in expression of this searched gene in stem-like cells from each diseased tissue sample relative to stem-like cells in normal samples in each tissue plotted against the malignancy continuum. Samples are colored based on if they are from different disease stage. |
Top |
Malignant transformation related pathway analysis |
| Find out the enriched GO biological processes and KEGG pathways involved in transition from healthy to precancer to cancer |
| Tissue | Disease Stage | Enriched GO biological Processes |
| Colorectum | AD |  |
| Colorectum | SER |  |
| Colorectum | MSS |  |
| Colorectum | MSI-H |  |
| Colorectum | FAP |  |
| ∗Top 15 enriched GO BP terms are showed in the bar plot of each disease state in each tissue. Each row represents a significant GO biological process which is colored according to the -log10(p.adjust). |
| Page: 1 2 3 4 5 6 7 8 9 |
| GO ID | Tissue | Disease Stage | Description | Gene Ratio | Bg Ratio | pvalue | p.adjust | Count |
| GO:00064579 | Cervix | CC | protein folding | 44/2311 | 212/18723 | 3.43e-04 | 3.59e-03 | 44 |
| GO:000645724 | Cervix | N_HPV | protein folding | 22/534 | 212/18723 | 1.90e-07 | 1.57e-05 | 22 |
| GO:0006457 | Colorectum | AD | protein folding | 73/3918 | 212/18723 | 3.24e-06 | 9.10e-05 | 73 |
| GO:00064571 | Colorectum | SER | protein folding | 54/2897 | 212/18723 | 1.04e-04 | 2.18e-03 | 54 |
| GO:00064572 | Colorectum | MSS | protein folding | 71/3467 | 212/18723 | 1.25e-07 | 5.91e-06 | 71 |
| GO:000645710 | Endometrium | AEH | protein folding | 61/2100 | 212/18723 | 1.86e-12 | 3.48e-10 | 61 |
| GO:00004133 | Endometrium | AEH | protein peptidyl-prolyl isomerization | 13/2100 | 42/18723 | 4.74e-04 | 4.91e-03 | 13 |
| GO:00182086 | Endometrium | AEH | peptidyl-proline modification | 16/2100 | 58/18723 | 4.75e-04 | 4.91e-03 | 16 |
| GO:000645715 | Endometrium | EEC | protein folding | 63/2168 | 212/18723 | 6.82e-13 | 1.40e-10 | 63 |
| GO:000041311 | Endometrium | EEC | protein peptidyl-prolyl isomerization | 14/2168 | 42/18723 | 1.69e-04 | 2.10e-03 | 14 |
| GO:001820813 | Endometrium | EEC | peptidyl-proline modification | 17/2168 | 58/18723 | 2.11e-04 | 2.54e-03 | 17 |
| GO:000645720 | Esophagus | HGIN | protein folding | 75/2587 | 212/18723 | 1.61e-15 | 3.86e-13 | 75 |
| GO:00182089 | Esophagus | HGIN | peptidyl-proline modification | 17/2587 | 58/18723 | 1.64e-03 | 1.82e-02 | 17 |
| GO:00004135 | Esophagus | HGIN | protein peptidyl-prolyl isomerization | 13/2587 | 42/18723 | 3.32e-03 | 3.12e-02 | 13 |
| GO:0006457110 | Esophagus | ESCC | protein folding | 163/8552 | 212/18723 | 1.13e-20 | 1.74e-18 | 163 |
| GO:001820816 | Esophagus | ESCC | peptidyl-proline modification | 46/8552 | 58/18723 | 1.59e-07 | 2.51e-06 | 46 |
| GO:000041313 | Esophagus | ESCC | protein peptidyl-prolyl isomerization | 32/8552 | 42/18723 | 5.52e-05 | 4.27e-04 | 32 |
| GO:00064577 | Liver | Cirrhotic | protein folding | 114/4634 | 212/18723 | 9.23e-20 | 2.31e-17 | 114 |
| GO:00182084 | Liver | Cirrhotic | peptidyl-proline modification | 26/4634 | 58/18723 | 6.65e-04 | 5.04e-03 | 26 |
| GO:00004132 | Liver | Cirrhotic | protein peptidyl-prolyl isomerization | 19/4634 | 42/18723 | 3.00e-03 | 1.71e-02 | 19 |
| Page: 1 2 3 |
| Pathway ID | Tissue | Disease Stage | Description | Gene Ratio | Bg Ratio | pvalue | p.adjust | qvalue | Count |
| Page: 1 |
Top |
Cell-cell communication analysis |
| Identification of potential cell-cell interactions between two cell types and their ligand-receptor pairs for different disease states |
| Ligand | Receptor | LRpair | Pathway | Tissue | Disease Stage |
| Page: 1 |
Top |
Single-cell gene regulatory network inference analysis |
| Find out the significant the regulons (TFs) and the target genes of each regulon across cell types for different disease states |
| TF | Cell Type | Tissue | Disease Stage | Target Gene | RSS | Regulon Activity |
| ∗The dot plots of a searched regulon are shown for all cell subpopulations in each disease state of each tissue based on the regulon specific score inferred using pySCENIC and by calculating the average expression. |
| Page: 1 |
Top |
Somatic mutation of malignant transformation related genes |
| Annotation of somatic variants for genes involved in malignant transformation |
| Hugo Symbol | Variant Class | Variant Classification | dbSNP RS | HGVSc | HGVSp | HGVSp Short | SWISSPROT | BIOTYPE | SIFT | PolyPhen | Tumor Sample Barcode | Tissue | Histology | Sex | Age | Stage | Therapy Types | Drugs | Outcome |
| PPIC | SNV | Missense_Mutation | rs748851398 | c.211G>T | p.Val71Phe | p.V71F | P45877 | protein_coding | tolerated(0.7) | possibly_damaging(0.566) | TCGA-A8-A08L-01 | Breast | breast invasive carcinoma | Female | >=65 | III/IV | Unknown | Unknown | SD |
| PPIC | SNV | Missense_Mutation | novel | c.428G>A | p.Gly143Asp | p.G143D | P45877 | protein_coding | deleterious(0) | probably_damaging(1) | TCGA-AA-3845-01 | Colorectum | colon adenocarcinoma | Female | >=65 | I/II | Unknown | Unknown | PD |
| PPIC | SNV | Missense_Mutation | novel | c.119T>C | p.Val40Ala | p.V40A | P45877 | protein_coding | deleterious(0.01) | probably_damaging(0.988) | TCGA-D5-6535-01 | Colorectum | colon adenocarcinoma | Female | >=65 | III/IV | Unknown | Unknown | SD |
| PPIC | SNV | Missense_Mutation | novel | c.345N>T | p.Glu115Asp | p.E115D | P45877 | protein_coding | tolerated(0.52) | benign(0) | TCGA-F5-6814-01 | Colorectum | rectum adenocarcinoma | Male | <65 | I/II | Unknown | Unknown | SD |
| PPIC | SNV | Missense_Mutation | novel | c.276G>T | p.Lys92Asn | p.K92N | P45877 | protein_coding | deleterious(0.01) | probably_damaging(0.968) | TCGA-A5-A1OF-01 | Endometrium | uterine corpus endometrioid carcinoma | Female | <65 | I/II | Unknown | Unknown | SD |
| PPIC | SNV | Missense_Mutation | novel | c.353N>A | p.Pro118Gln | p.P118Q | P45877 | protein_coding | deleterious(0.02) | possibly_damaging(0.788) | TCGA-A5-A2K5-01 | Endometrium | uterine corpus endometrioid carcinoma | Female | >=65 | I/II | Unknown | Unknown | SD |
| PPIC | SNV | Missense_Mutation | c.557N>A | p.Arg186His | p.R186H | P45877 | protein_coding | deleterious(0) | possibly_damaging(0.829) | TCGA-D1-A0ZO-01 | Endometrium | uterine corpus endometrioid carcinoma | Female | >=65 | I/II | Unknown | Unknown | SD | |
| PPIC | SNV | Missense_Mutation | novel | c.207N>G | p.Asn69Lys | p.N69K | P45877 | protein_coding | deleterious(0.02) | probably_damaging(0.999) | TCGA-E6-A1LX-01 | Endometrium | uterine corpus endometrioid carcinoma | Female | <65 | I/II | Unknown | Unknown | SD |
| PPIC | SNV | Missense_Mutation | rs755709937 | c.409N>A | p.Ala137Thr | p.A137T | P45877 | protein_coding | deleterious(0) | benign(0.237) | TCGA-EY-A1GD-01 | Endometrium | uterine corpus endometrioid carcinoma | Female | <65 | I/II | Unknown | Unknown | SD |
| PPIC | SNV | Missense_Mutation | c.360G>T | p.Glu120Asp | p.E120D | P45877 | protein_coding | deleterious(0) | possibly_damaging(0.454) | TCGA-EY-A1GI-01 | Endometrium | uterine corpus endometrioid carcinoma | Female | <65 | I/II | Unknown | Unknown | SD |
| Page: 1 2 |
Top |
Related drugs of malignant transformation related genes |
| Identification of chemicals and drugs interact with genes involved in malignant transfromation |
| (DGIdb 4.0) |
| Entrez ID | Symbol | Category | Interaction Types | Drug Claim Name | Drug Name | PMIDs |
| Page: 1 |

Copyright 2023-Present -The University of Texas Health Science Center at Houston |