
|
|||||
|
 | |
| |
| |
| |
| |
| |
|
Gene: PPIA |
Gene summary for PPIA |
| Gene information | Species | Human | Gene symbol | PPIA | Gene ID | 5478 |
| Gene name | peptidylprolyl isomerase A | |
| Gene Alias | CYPA | |
| Cytomap | 7p13 | |
| Gene Type | protein-coding | GO ID | GO:0000165 | UniProtAcc | P62937 |
Top |
Malignant transformation analysis |
| Identification of the aberrant gene expression in precancerous and cancerous lesions by comparing the gene expression of stem-like cells in diseased tissues with normal stem cells |
| Entrez ID | Symbol | Replicates | Species | Organ | Tissue | Adj P-value | Log2FC | Malignancy |
| 5478 | PPIA | GSM4909282 | Human | Breast | IDC | 3.23e-81 | 5.00e-01 | -0.0288 |
| 5478 | PPIA | GSM4909285 | Human | Breast | IDC | 7.88e-11 | -2.07e-01 | 0.21 |
| 5478 | PPIA | GSM4909286 | Human | Breast | IDC | 3.39e-13 | -1.67e-01 | 0.1081 |
| 5478 | PPIA | GSM4909287 | Human | Breast | IDC | 2.03e-08 | 3.64e-02 | 0.2057 |
| 5478 | PPIA | GSM4909288 | Human | Breast | IDC | 4.95e-03 | -1.31e-01 | 0.0988 |
| 5478 | PPIA | GSM4909293 | Human | Breast | IDC | 2.24e-07 | -1.81e-01 | 0.1581 |
| 5478 | PPIA | GSM4909294 | Human | Breast | IDC | 2.77e-08 | -8.52e-02 | 0.2022 |
| 5478 | PPIA | GSM4909295 | Human | Breast | IDC | 7.34e-03 | -2.88e-01 | 0.0898 |
| 5478 | PPIA | GSM4909296 | Human | Breast | IDC | 2.25e-37 | 3.00e-01 | 0.1524 |
| 5478 | PPIA | GSM4909297 | Human | Breast | IDC | 1.75e-30 | -2.45e-01 | 0.1517 |
| 5478 | PPIA | GSM4909301 | Human | Breast | IDC | 7.41e-07 | 1.12e-01 | 0.1577 |
| 5478 | PPIA | GSM4909302 | Human | Breast | IDC | 7.30e-13 | -4.16e-01 | 0.1545 |
| 5478 | PPIA | GSM4909311 | Human | Breast | IDC | 3.10e-47 | -5.07e-01 | 0.1534 |
| 5478 | PPIA | GSM4909312 | Human | Breast | IDC | 1.84e-07 | -2.21e-01 | 0.1552 |
| 5478 | PPIA | GSM4909313 | Human | Breast | IDC | 1.45e-05 | -2.97e-01 | 0.0391 |
| 5478 | PPIA | GSM4909315 | Human | Breast | IDC | 8.16e-28 | 2.57e-01 | 0.21 |
| 5478 | PPIA | GSM4909316 | Human | Breast | IDC | 2.46e-18 | 3.58e-01 | 0.21 |
| 5478 | PPIA | GSM4909319 | Human | Breast | IDC | 2.00e-83 | -3.71e-02 | 0.1563 |
| 5478 | PPIA | GSM4909320 | Human | Breast | IDC | 3.69e-10 | -2.46e-01 | 0.1575 |
| 5478 | PPIA | GSM4909321 | Human | Breast | IDC | 2.10e-11 | -2.35e-01 | 0.1559 |
| Page: 1 2 3 4 5 6 7 8 9 10 11 12 13 14 15 16 17 18 19 |
| Tissue | Expression Dynamics | Abbreviation |
| Breast |  | IDC: Invasive ductal carcinoma |
| DCIS: Ductal carcinoma in situ | ||
| Precancer(BRCA1-mut): Precancerous lesion from BRCA1 mutation carriers | ||
| Cervix |  | CC: Cervix cancer |
| HSIL_HPV: HPV-infected high-grade squamous intraepithelial lesions | ||
| N_HPV: HPV-infected normal cervix | ||
| Colorectum (GSE201348) |  | FAP: Familial adenomatous polyposis |
| CRC: Colorectal cancer | ||
| Colorectum (HTA11) |  | AD: Adenomas |
| SER: Sessile serrated lesions | ||
| MSI-H: Microsatellite-high colorectal cancer | ||
| MSS: Microsatellite stable colorectal cancer | ||
| Endometrium | 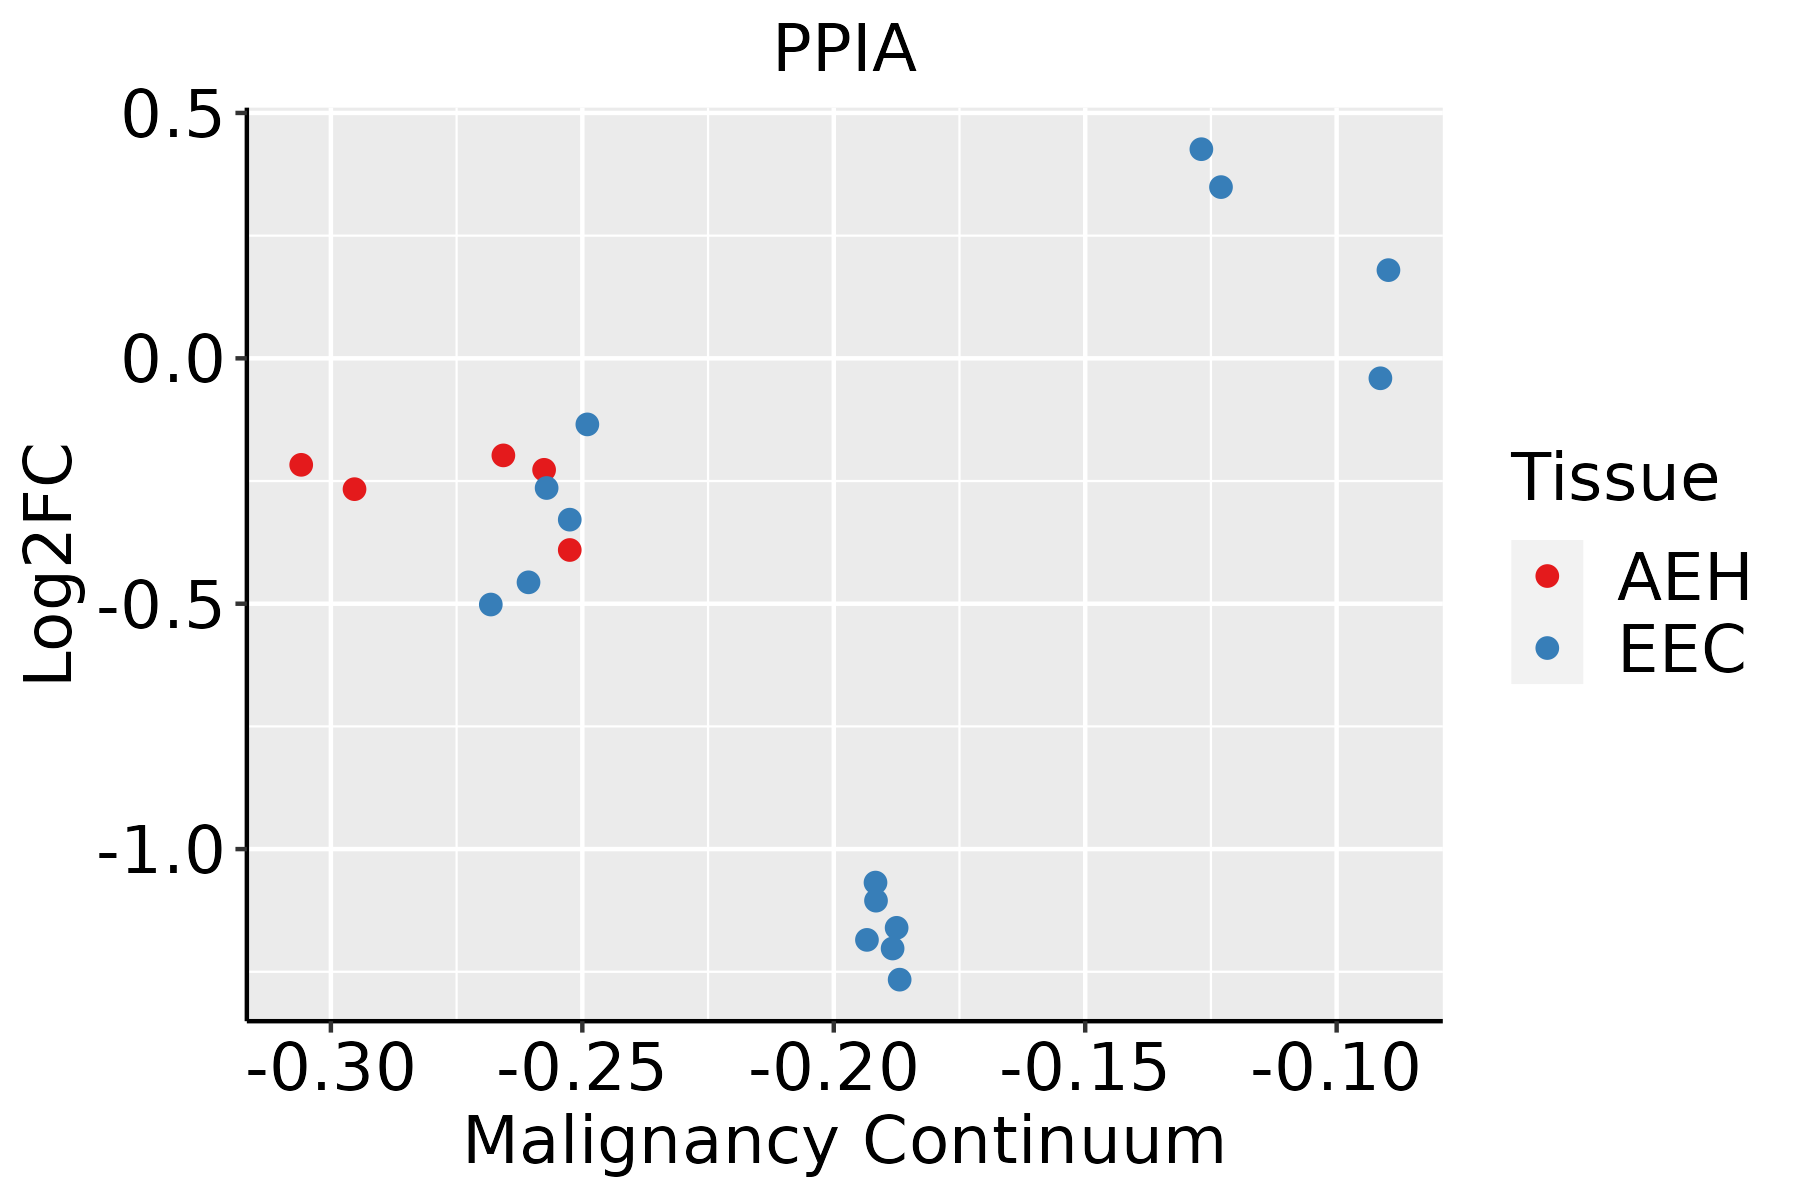 | AEH: Atypical endometrial hyperplasia |
| EEC: Endometrioid Cancer | ||
| Esophagus | 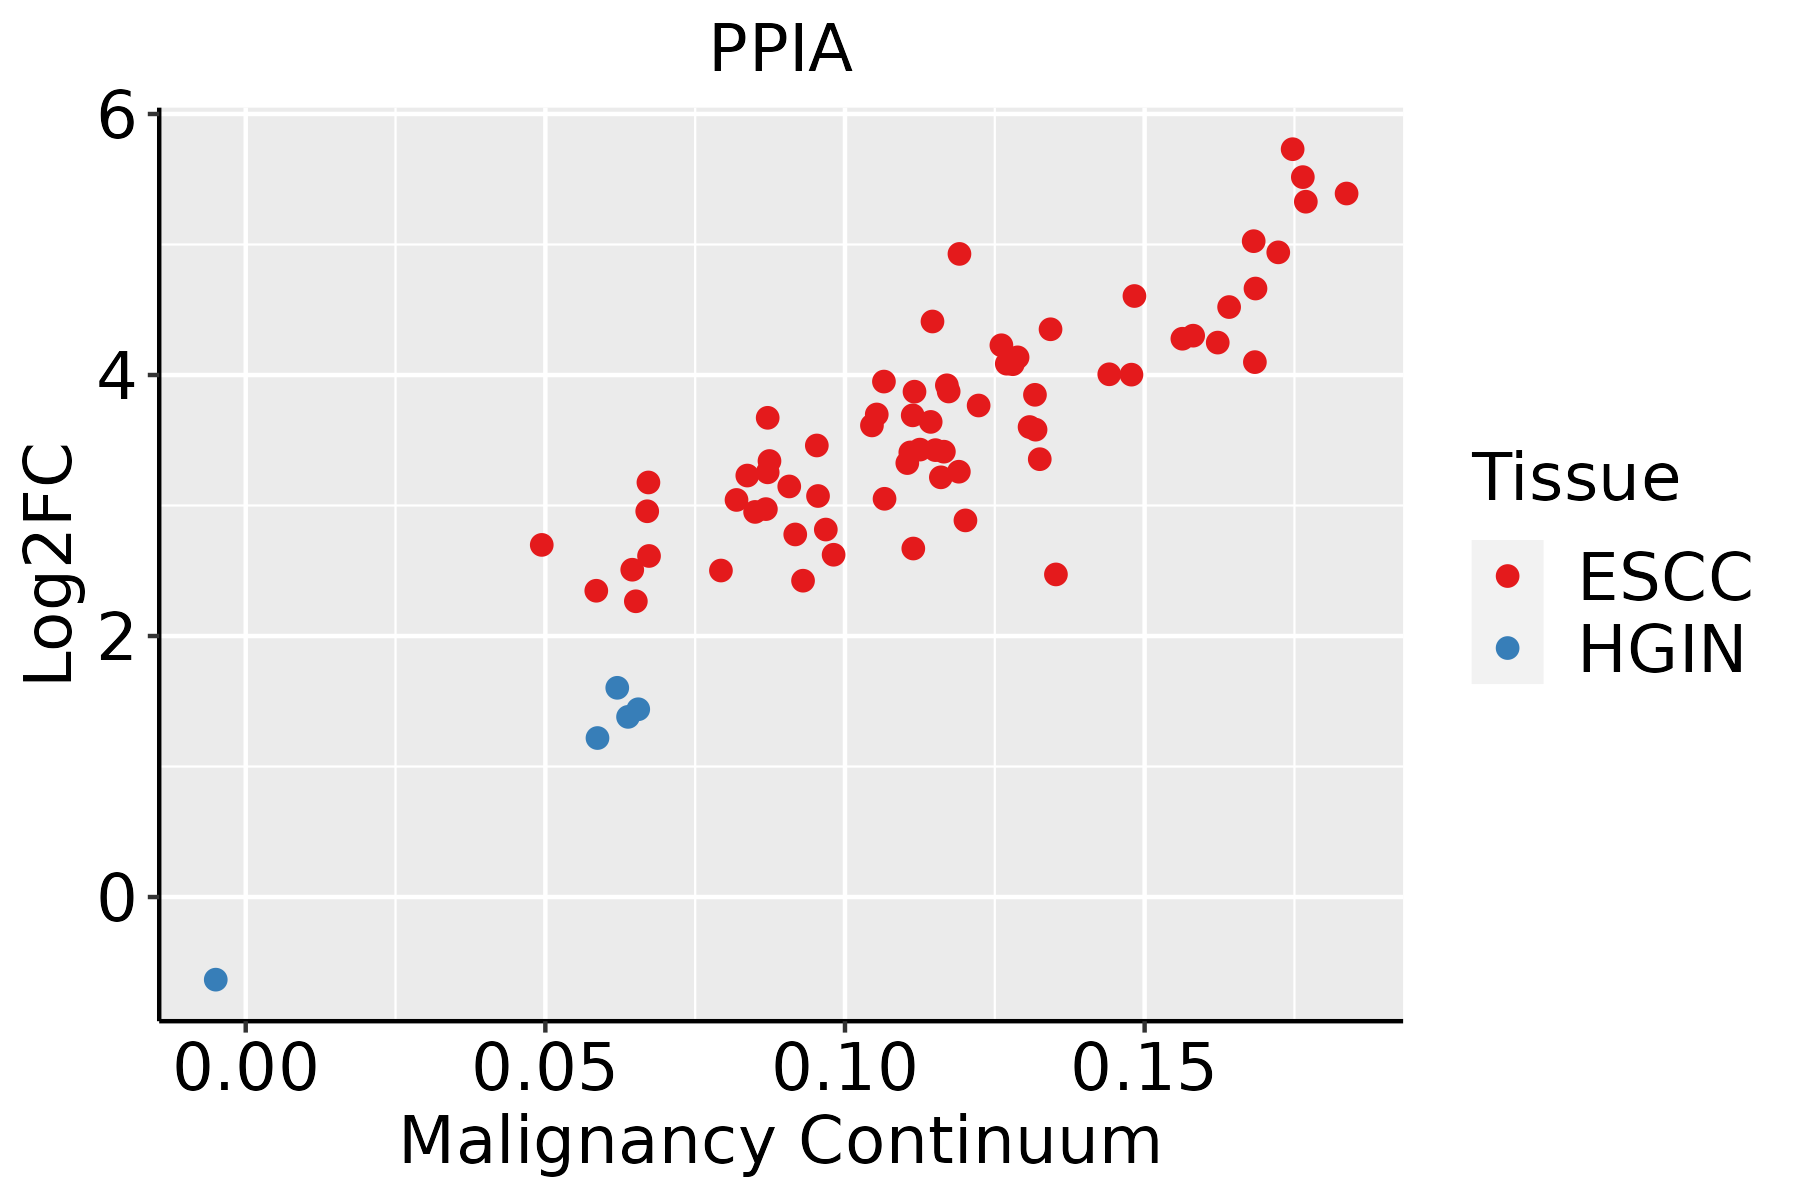 | ESCC: Esophageal squamous cell carcinoma |
| HGIN: High-grade intraepithelial neoplasias | ||
| LGIN: Low-grade intraepithelial neoplasias | ||
| GC | 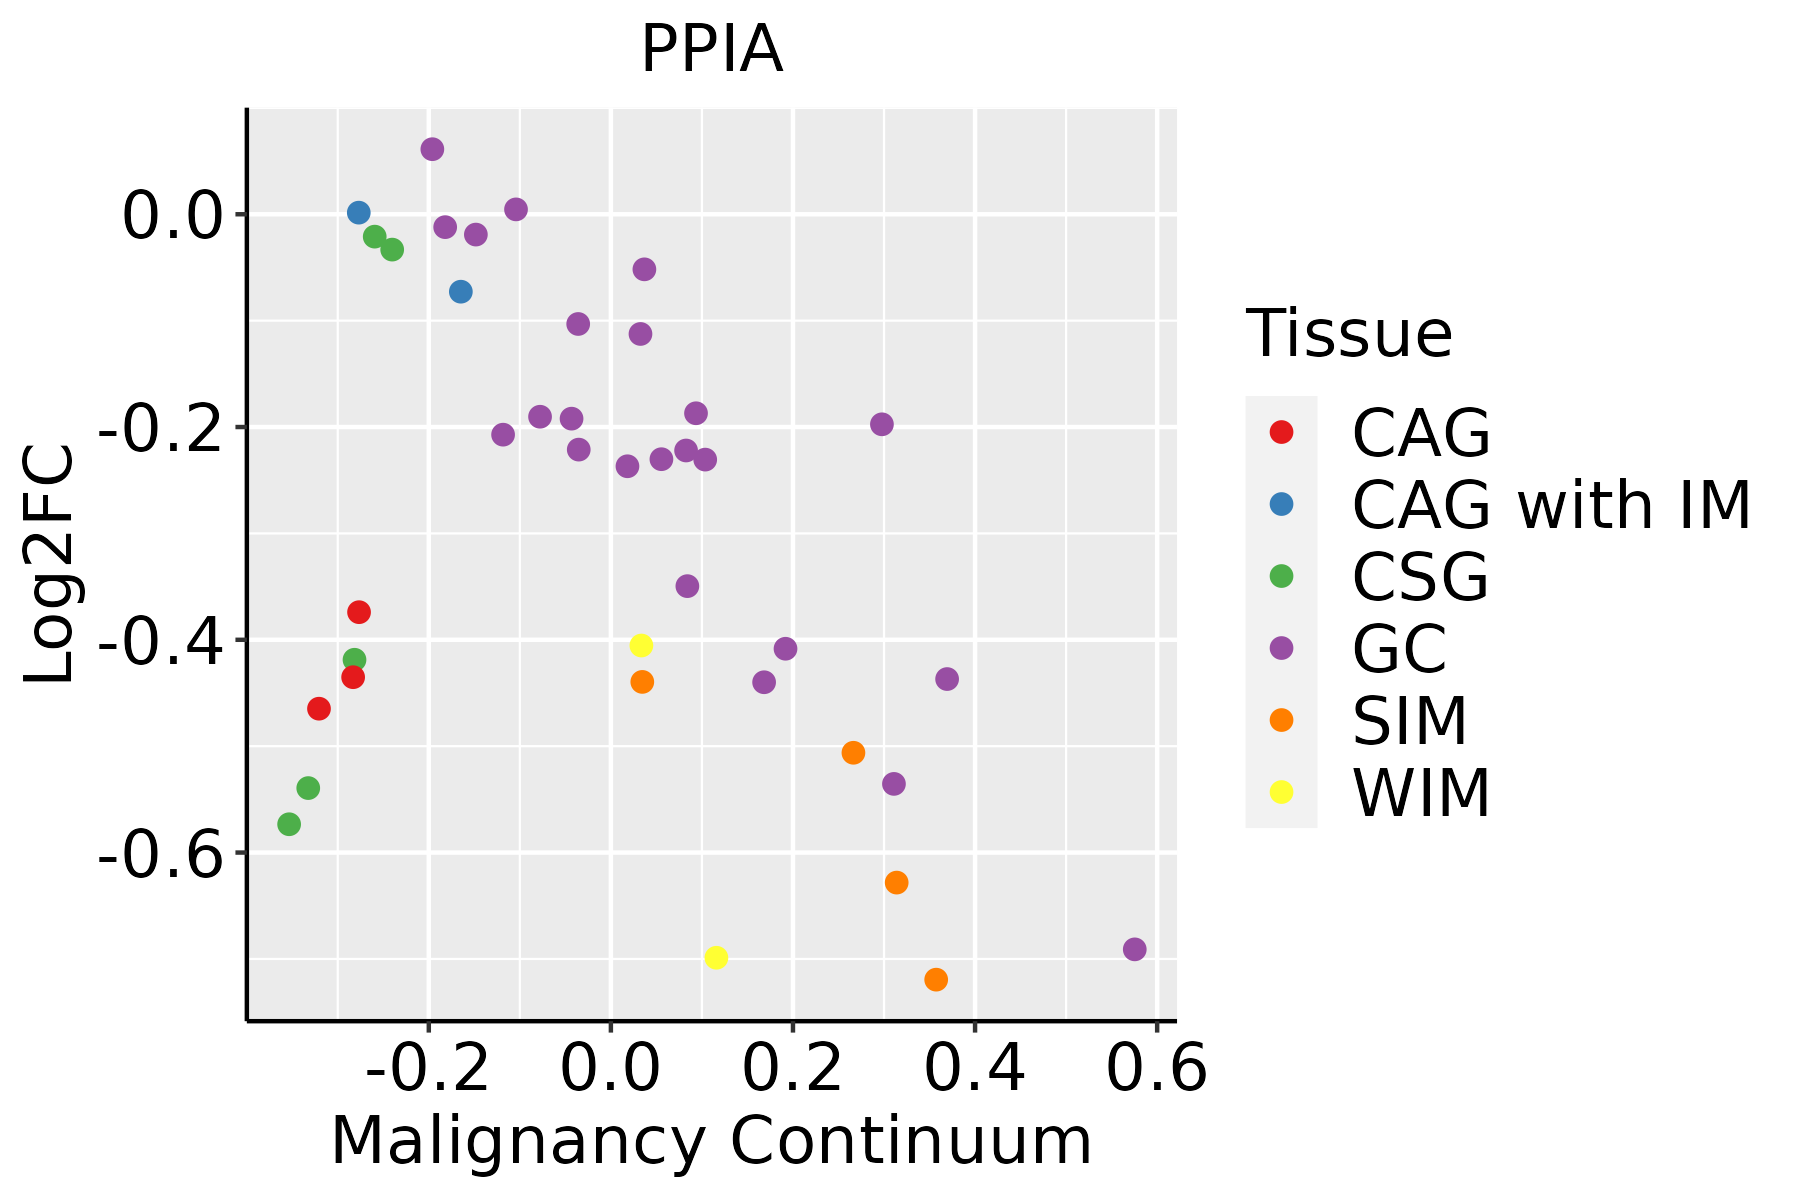 | CAG: Chronic atrophic gastritis |
| CAG with IM: Chronic atrophic gastritis with intestinal metaplasia | ||
| CSG: Chronic superficial gastritis | ||
| GC: Gastric cancer | ||
| SIM: Severe intestinal metaplasia | ||
| WIM: Wild intestinal metaplasia | ||
| Liver |  | HCC: Hepatocellular carcinoma |
| NAFLD: Non-alcoholic fatty liver disease | ||
| Oral Cavity | 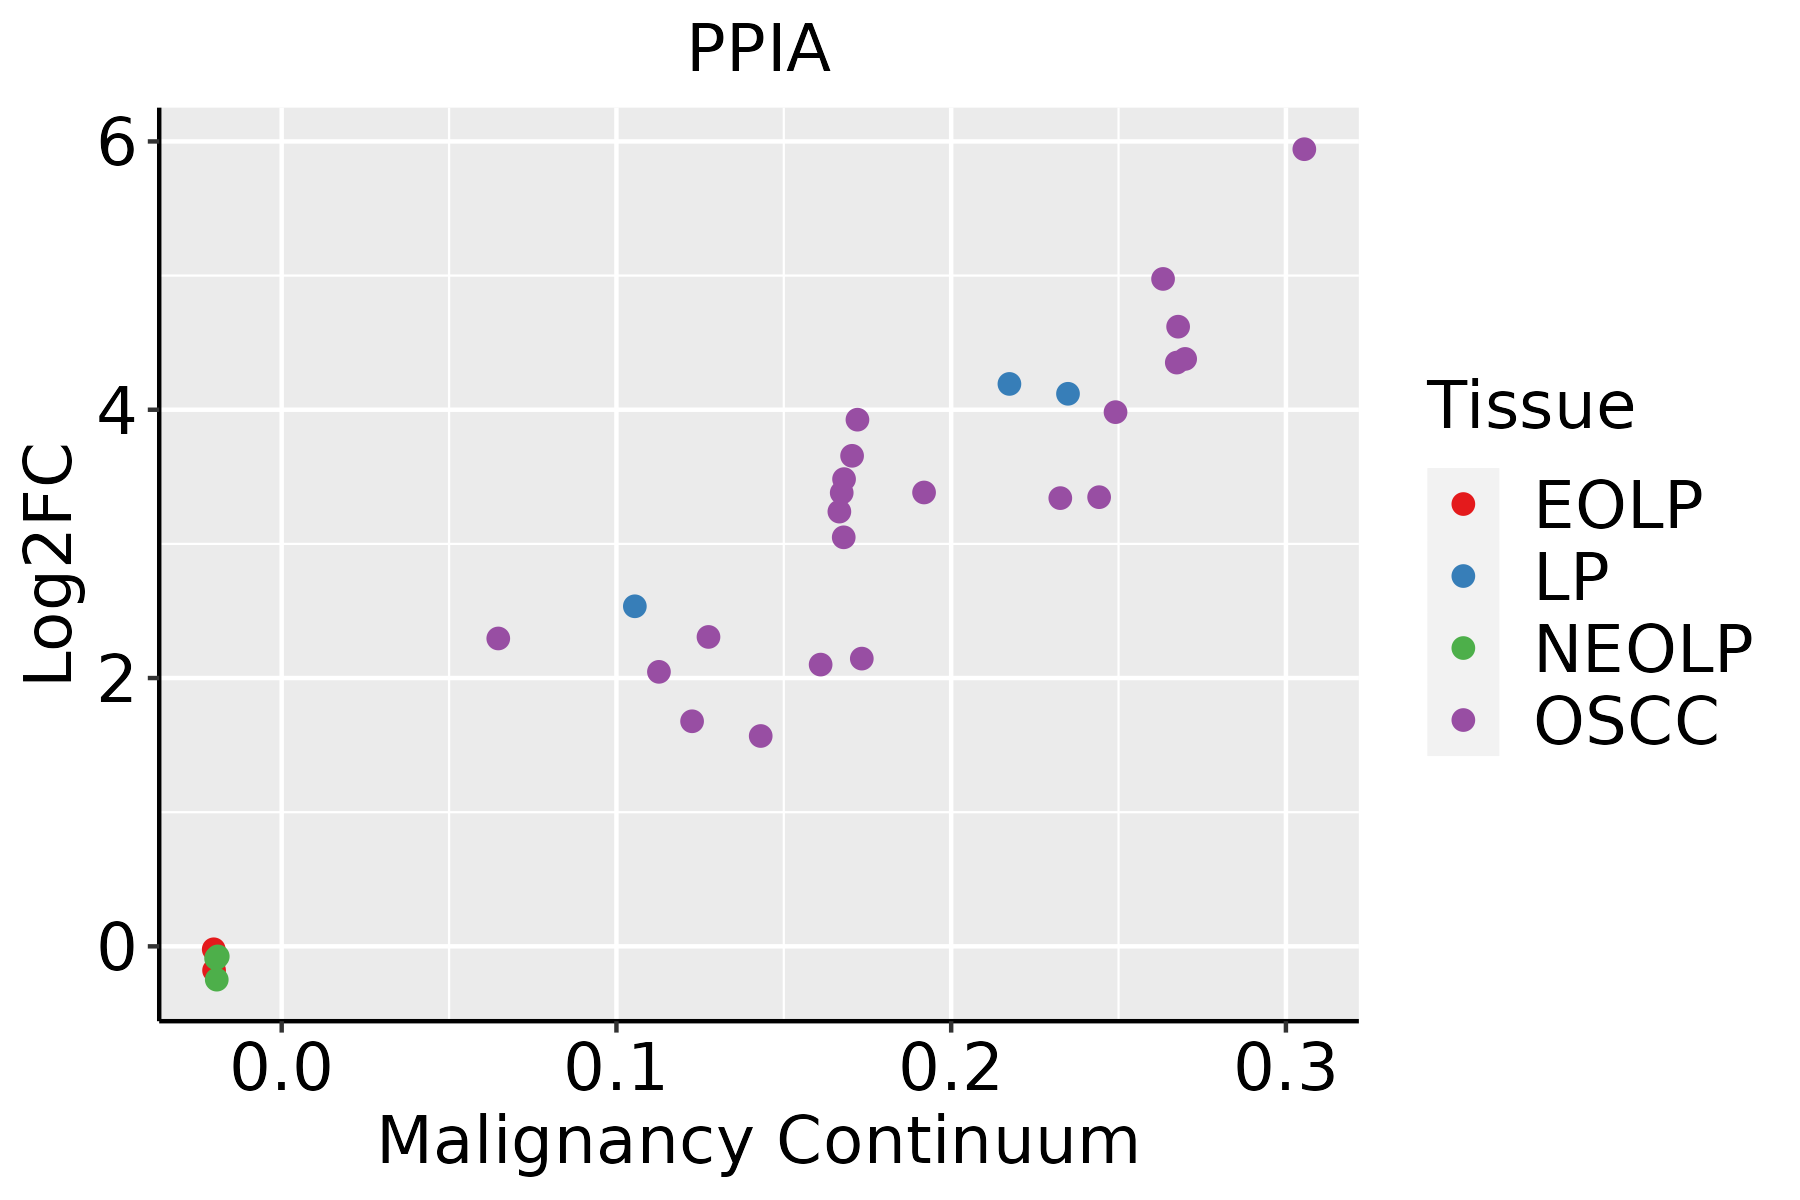 | EOLP: Erosive Oral lichen planus |
| LP: leukoplakia | ||
| NEOLP: Non-erosive oral lichen planus | ||
| OSCC: Oral squamous cell carcinoma | ||
| Prostate | 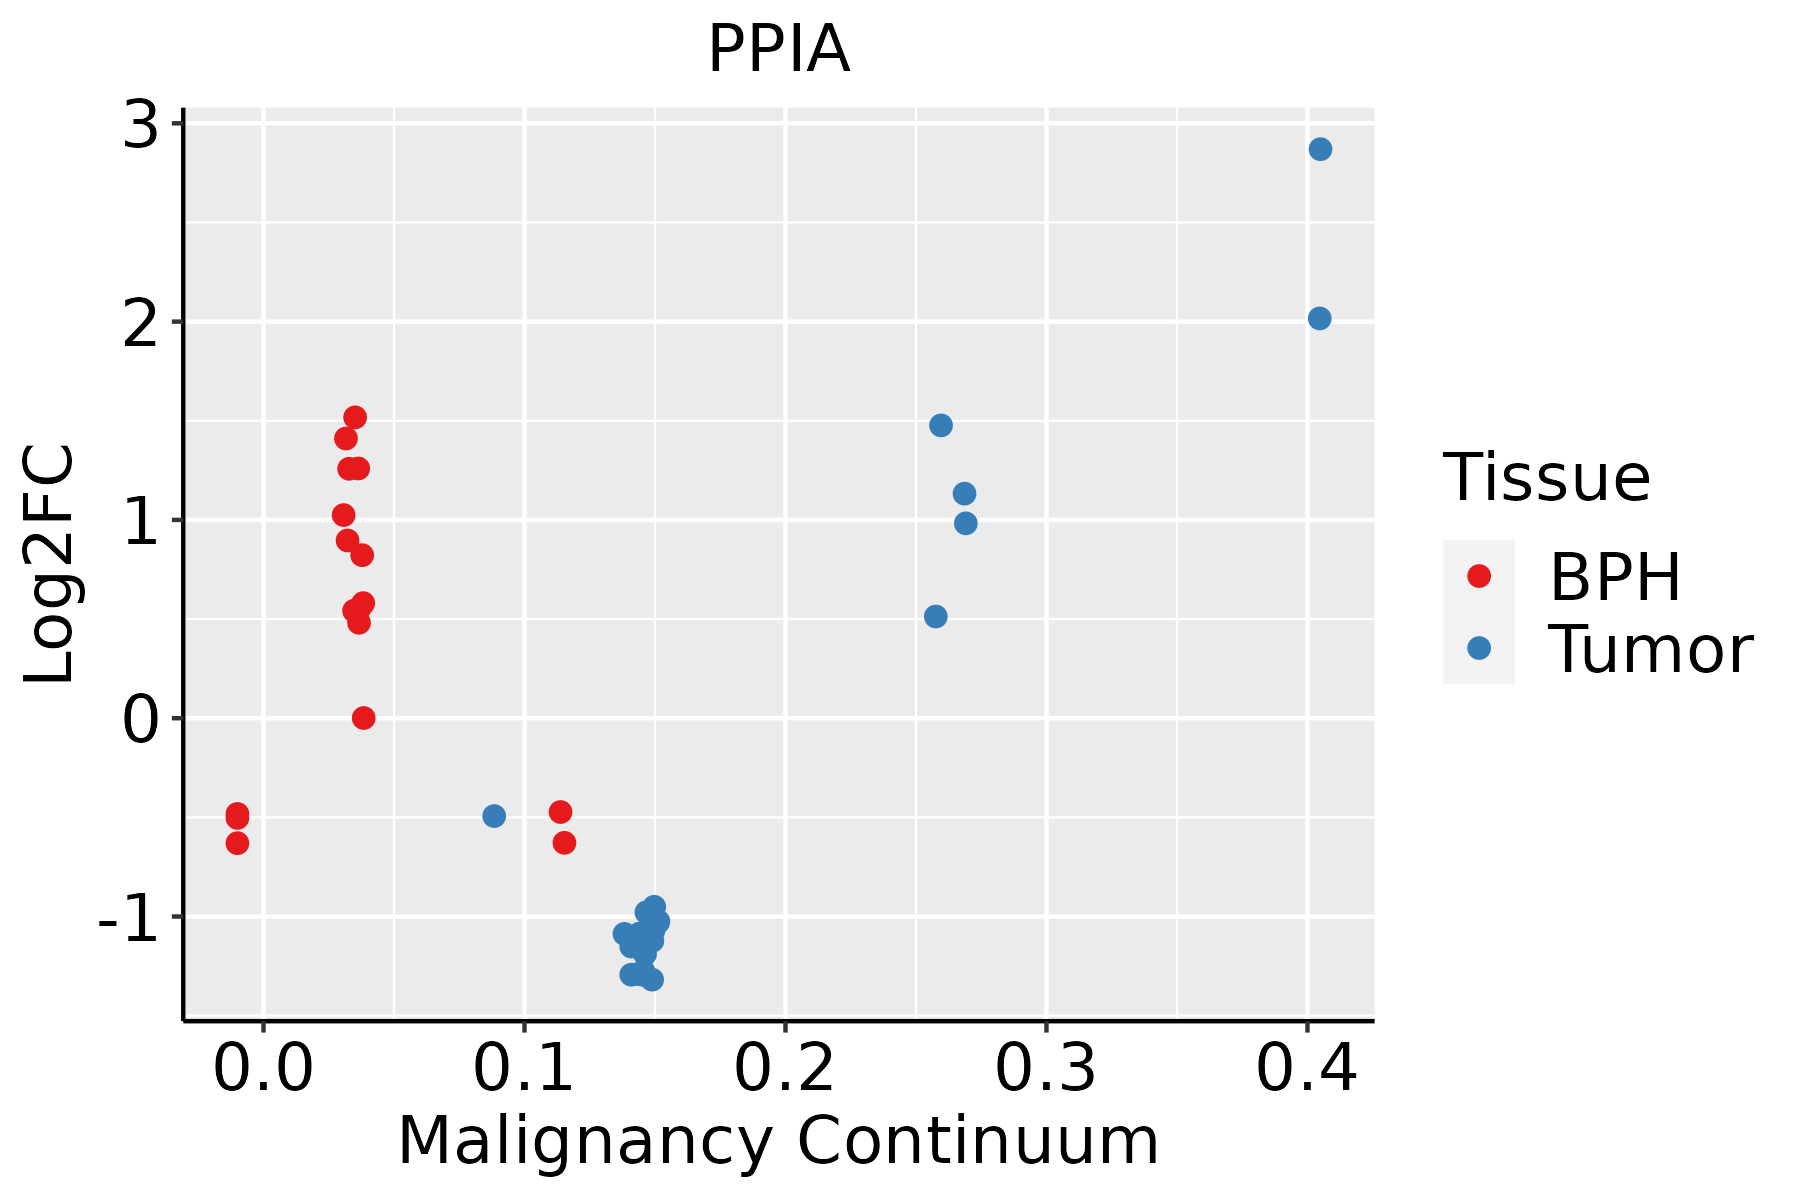 | BPH: Benign Prostatic Hyperplasia |
| Skin |  | AK: Actinic keratosis |
| cSCC: Cutaneous squamous cell carcinoma | ||
| SCCIS:squamous cell carcinoma in situ | ||
| Thyroid |  | ATC: Anaplastic thyroid cancer |
| HT: Hashimoto's thyroiditis | ||
| PTC: Papillary thyroid cancer |
| ∗log2FC in expression of this searched gene in stem-like cells from each diseased tissue sample relative to stem-like cells in normal samples in each tissue plotted against the malignancy continuum. Samples are colored based on if they are from different disease stage. |
Top |
Malignant transformation related pathway analysis |
| Find out the enriched GO biological processes and KEGG pathways involved in transition from healthy to precancer to cancer |
| Tissue | Disease Stage | Enriched GO biological Processes |
| Colorectum | AD |  |
| Colorectum | SER |  |
| Colorectum | MSS |  |
| Colorectum | MSI-H |  |
| Colorectum | FAP |  |
| ∗Top 15 enriched GO BP terms are showed in the bar plot of each disease state in each tissue. Each row represents a significant GO biological process which is colored according to the -log10(p.adjust). |
| Page: 1 2 3 4 5 6 7 8 9 |
| GO ID | Tissue | Disease Stage | Description | Gene Ratio | Bg Ratio | pvalue | p.adjust | Count |
| GO:00971939 | Breast | Precancer | intrinsic apoptotic signaling pathway | 59/1080 | 288/18723 | 8.07e-18 | 3.60e-15 | 59 |
| GO:20012339 | Breast | Precancer | regulation of apoptotic signaling pathway | 65/1080 | 356/18723 | 7.70e-17 | 3.17e-14 | 65 |
| GO:20012429 | Breast | Precancer | regulation of intrinsic apoptotic signaling pathway | 41/1080 | 164/18723 | 6.48e-16 | 2.31e-13 | 41 |
| GO:00069799 | Breast | Precancer | response to oxidative stress | 70/1080 | 446/18723 | 1.59e-14 | 4.26e-12 | 70 |
| GO:00064578 | Breast | Precancer | protein folding | 43/1080 | 212/18723 | 3.48e-13 | 7.45e-11 | 43 |
| GO:00621979 | Breast | Precancer | cellular response to chemical stress | 51/1080 | 337/18723 | 2.40e-10 | 2.34e-08 | 51 |
| GO:00160329 | Breast | Precancer | viral process | 58/1080 | 415/18723 | 3.42e-10 | 3.16e-08 | 58 |
| GO:20012349 | Breast | Precancer | negative regulation of apoptotic signaling pathway | 39/1080 | 224/18723 | 5.35e-10 | 4.77e-08 | 39 |
| GO:00190589 | Breast | Precancer | viral life cycle | 47/1080 | 317/18723 | 2.42e-09 | 1.99e-07 | 47 |
| GO:20012439 | Breast | Precancer | negative regulation of intrinsic apoptotic signaling pathway | 23/1080 | 98/18723 | 5.82e-09 | 4.45e-07 | 23 |
| GO:19033209 | Breast | Precancer | regulation of protein modification by small protein conjugation or removal | 38/1080 | 242/18723 | 1.71e-08 | 1.17e-06 | 38 |
| GO:00345999 | Breast | Precancer | cellular response to oxidative stress | 42/1080 | 288/18723 | 2.78e-08 | 1.79e-06 | 42 |
| GO:00444039 | Breast | Precancer | biological process involved in symbiotic interaction | 42/1080 | 290/18723 | 3.40e-08 | 2.11e-06 | 42 |
| GO:19033219 | Breast | Precancer | negative regulation of protein modification by small protein conjugation or removal | 21/1080 | 95/18723 | 8.09e-08 | 4.61e-06 | 21 |
| GO:00975297 | Breast | Precancer | myeloid leukocyte migration | 34/1080 | 220/18723 | 1.42e-07 | 7.82e-06 | 34 |
| GO:00313969 | Breast | Precancer | regulation of protein ubiquitination | 33/1080 | 210/18723 | 1.45e-07 | 7.82e-06 | 33 |
| GO:00313979 | Breast | Precancer | negative regulation of protein ubiquitination | 19/1080 | 83/18723 | 1.85e-07 | 9.54e-06 | 19 |
| GO:00521269 | Breast | Precancer | movement in host environment | 29/1080 | 175/18723 | 2.59e-07 | 1.28e-05 | 29 |
| GO:00509006 | Breast | Precancer | leukocyte migration | 47/1080 | 369/18723 | 2.82e-07 | 1.39e-05 | 47 |
| GO:19021758 | Breast | Precancer | regulation of oxidative stress-induced intrinsic apoptotic signaling pathway | 11/1080 | 29/18723 | 2.95e-07 | 1.44e-05 | 11 |
| Page: 1 2 3 4 5 6 7 8 9 10 11 12 13 14 15 16 17 18 19 20 21 22 23 24 25 26 27 28 29 30 31 32 33 34 35 36 37 38 39 40 41 42 43 44 45 46 47 48 49 50 51 52 53 54 55 56 57 58 59 60 61 62 63 64 65 66 67 68 69 70 71 72 73 74 75 76 77 78 79 80 81 82 83 84 85 86 87 88 89 90 91 92 93 94 95 96 97 98 99 100 101 102 103 104 105 106 107 108 109 110 111 112 113 114 115 116 117 118 119 120 121 122 |
| Pathway ID | Tissue | Disease Stage | Description | Gene Ratio | Bg Ratio | pvalue | p.adjust | qvalue | Count |
| hsa04217 | Colorectum | SER | Necroptosis | 47/1580 | 159/8465 | 5.21e-04 | 4.44e-03 | 3.22e-03 | 47 |
| hsa042171 | Colorectum | SER | Necroptosis | 47/1580 | 159/8465 | 5.21e-04 | 4.44e-03 | 3.22e-03 | 47 |
| hsa03250 | Colorectum | MSS | Viral life cycle - HIV-1 | 23/1875 | 63/8465 | 6.55e-03 | 2.64e-02 | 1.62e-02 | 23 |
| hsa032501 | Colorectum | MSS | Viral life cycle - HIV-1 | 23/1875 | 63/8465 | 6.55e-03 | 2.64e-02 | 1.62e-02 | 23 |
| hsa032509 | Esophagus | ESCC | Viral life cycle - HIV-1 | 54/4205 | 63/8465 | 2.01e-09 | 2.17e-08 | 1.11e-08 | 54 |
| hsa0325014 | Esophagus | ESCC | Viral life cycle - HIV-1 | 54/4205 | 63/8465 | 2.01e-09 | 2.17e-08 | 1.11e-08 | 54 |
| hsa032508 | Oral cavity | OSCC | Viral life cycle - HIV-1 | 45/3704 | 63/8465 | 7.62e-06 | 3.59e-05 | 1.83e-05 | 45 |
| hsa0325013 | Oral cavity | OSCC | Viral life cycle - HIV-1 | 45/3704 | 63/8465 | 7.62e-06 | 3.59e-05 | 1.83e-05 | 45 |
| hsa0325022 | Oral cavity | LP | Viral life cycle - HIV-1 | 32/2418 | 63/8465 | 1.55e-04 | 9.08e-04 | 5.86e-04 | 32 |
| hsa0421714 | Oral cavity | LP | Necroptosis | 59/2418 | 159/8465 | 1.15e-02 | 3.91e-02 | 2.52e-02 | 59 |
| hsa0325031 | Oral cavity | LP | Viral life cycle - HIV-1 | 32/2418 | 63/8465 | 1.55e-04 | 9.08e-04 | 5.86e-04 | 32 |
| hsa0421715 | Oral cavity | LP | Necroptosis | 59/2418 | 159/8465 | 1.15e-02 | 3.91e-02 | 2.52e-02 | 59 |
| hsa0421722 | Oral cavity | EOLP | Necroptosis | 37/1218 | 159/8465 | 1.70e-03 | 5.83e-03 | 3.44e-03 | 37 |
| hsa0325041 | Oral cavity | EOLP | Viral life cycle - HIV-1 | 16/1218 | 63/8465 | 1.46e-02 | 3.77e-02 | 2.22e-02 | 16 |
| hsa0421732 | Oral cavity | EOLP | Necroptosis | 37/1218 | 159/8465 | 1.70e-03 | 5.83e-03 | 3.44e-03 | 37 |
| hsa032505 | Oral cavity | EOLP | Viral life cycle - HIV-1 | 16/1218 | 63/8465 | 1.46e-02 | 3.77e-02 | 2.22e-02 | 16 |
| hsa032506 | Oral cavity | NEOLP | Viral life cycle - HIV-1 | 16/1112 | 63/8465 | 6.21e-03 | 2.33e-02 | 1.46e-02 | 16 |
| hsa032507 | Oral cavity | NEOLP | Viral life cycle - HIV-1 | 16/1112 | 63/8465 | 6.21e-03 | 2.33e-02 | 1.46e-02 | 16 |
| hsa032504 | Prostate | BPH | Viral life cycle - HIV-1 | 24/1718 | 63/8465 | 8.32e-04 | 3.98e-03 | 2.46e-03 | 24 |
| hsa0421712 | Prostate | BPH | Necroptosis | 45/1718 | 159/8465 | 9.23e-03 | 2.85e-02 | 1.76e-02 | 45 |
| Page: 1 2 |
Top |
Cell-cell communication analysis |
| Identification of potential cell-cell interactions between two cell types and their ligand-receptor pairs for different disease states |
| Ligand | Receptor | LRpair | Pathway | Tissue | Disease Stage |
| Page: 1 |
Top |
Single-cell gene regulatory network inference analysis |
| Find out the significant the regulons (TFs) and the target genes of each regulon across cell types for different disease states |
| TF | Cell Type | Tissue | Disease Stage | Target Gene | RSS | Regulon Activity |
| ∗The dot plots of a searched regulon are shown for all cell subpopulations in each disease state of each tissue based on the regulon specific score inferred using pySCENIC and by calculating the average expression. |
| Page: 1 |
Top |
Somatic mutation of malignant transformation related genes |
| Annotation of somatic variants for genes involved in malignant transformation |
| Hugo Symbol | Variant Class | Variant Classification | dbSNP RS | HGVSc | HGVSp | HGVSp Short | SWISSPROT | BIOTYPE | SIFT | PolyPhen | Tumor Sample Barcode | Tissue | Histology | Sex | Age | Stage | Therapy Types | Drugs | Outcome |
| PPIA | SNV | Missense_Mutation | novel | c.332A>G | p.Gln111Arg | p.Q111R | P62937 | protein_coding | deleterious_low_confidence(0.03) | possibly_damaging(0.798) | TCGA-AA-3950-01 | Colorectum | colon adenocarcinoma | Female | >=65 | I/II | Unknown | Unknown | SD |
| PPIA | SNV | Missense_Mutation | novel | c.295N>G | p.Ser99Ala | p.S99A | P62937 | protein_coding | deleterious_low_confidence(0) | possibly_damaging(0.754) | TCGA-AG-3892-01 | Colorectum | rectum adenocarcinoma | Female | <65 | I/II | Unknown | Unknown | SD |
| PPIA | SNV | Missense_Mutation | novel | c.434N>A | p.Phe145Tyr | p.F145Y | P62937 | protein_coding | tolerated_low_confidence(0.19) | benign(0.097) | TCGA-AP-A059-01 | Endometrium | uterine corpus endometrioid carcinoma | Female | >=65 | I/II | Unknown | Unknown | SD |
| PPIA | SNV | Missense_Mutation | novel | c.446N>C | p.Asn149Thr | p.N149T | P62937 | protein_coding | deleterious_low_confidence(0.02) | benign(0.073) | TCGA-AP-A1E0-01 | Endometrium | uterine corpus endometrioid carcinoma | Female | <65 | III/IV | Chemotherapy | paclitaxel | SD |
| PPIA | SNV | Missense_Mutation | novel | c.406N>G | p.Met136Val | p.M136V | P62937 | protein_coding | deleterious_low_confidence(0.03) | benign(0.034) | TCGA-B5-A3FA-01 | Endometrium | uterine corpus endometrioid carcinoma | Female | >=65 | I/II | Unknown | Unknown | SD |
| PPIA | SNV | Missense_Mutation | c.440N>T | p.Ser147Phe | p.S147F | P62937 | protein_coding | deleterious_low_confidence(0.04) | benign(0.305) | TCGA-BG-A0MO-01 | Endometrium | uterine corpus endometrioid carcinoma | Female | <65 | I/II | Unknown | Unknown | SD | |
| PPIA | SNV | Missense_Mutation | novel | c.16N>A | p.Val6Met | p.V6M | P62937 | protein_coding | tolerated_low_confidence(0.23) | benign(0.01) | TCGA-EO-A22U-01 | Endometrium | uterine corpus endometrioid carcinoma | Female | >=65 | I/II | Unknown | Unknown | SD |
| PPIA | SNV | Missense_Mutation | rs748726244 | c.493N>A | p.Glu165Lys | p.E165K | P62937 | protein_coding | tolerated_low_confidence(0.51) | benign(0) | TCGA-EO-A22X-01 | Endometrium | uterine corpus endometrioid carcinoma | Female | <65 | III/IV | Unspecific | Carboplatin | Complete Response |
| PPIA | SNV | Missense_Mutation | rs748726244 | c.493N>A | p.Glu165Lys | p.E165K | P62937 | protein_coding | tolerated_low_confidence(0.51) | benign(0) | TCGA-QF-A5YS-01 | Endometrium | uterine corpus endometrioid carcinoma | Female | <65 | I/II | Chemotherapy | carboplatin | CR |
| PPIA | SNV | Missense_Mutation | novel | c.331N>A | p.Gln111Lys | p.Q111K | P62937 | protein_coding | deleterious_low_confidence(0.01) | possibly_damaging(0.719) | TCGA-05-4396-01 | Lung | lung adenocarcinoma | Male | >=65 | III/IV | Unknown | Unknown | SD |
| Page: 1 2 |
Top |
Related drugs of malignant transformation related genes |
| Identification of chemicals and drugs interact with genes involved in malignant transfromation |
| (DGIdb 4.0) |
| Entrez ID | Symbol | Category | Interaction Types | Drug Claim Name | Drug Name | PMIDs |
| 5478 | PPIA | DRUGGABLE GENOME, ENZYME | inhibitor | 135652074 | ||
| 5478 | PPIA | DRUGGABLE GENOME, ENZYME | L-Proline | PROLINE | ||
| 5478 | PPIA | DRUGGABLE GENOME, ENZYME | CSA | CYCLOSPORINE | 12207006 | |
| 5478 | PPIA | DRUGGABLE GENOME, ENZYME | VOCLOSPORIN | VOCLOSPORIN | ||
| 5478 | PPIA | DRUGGABLE GENOME, ENZYME | CYCLOSPORINE | CYCLOSPORINE | 19933795 | |
| 5478 | PPIA | DRUGGABLE GENOME, ENZYME | modulator | CHEMBL160 | CYCLOSPORINE | |
| 5478 | PPIA | DRUGGABLE GENOME, ENZYME | IMMUNOSUPPRESSIVE | 7680683 | ||
| 5478 | PPIA | DRUGGABLE GENOME, ENZYME | SCY-635 | SCY 635 |
| Page: 1 |

Copyright 2023-Present -The University of Texas Health Science Center at Houston |