
|
|||||
|
 | |
| |
| |
| |
| |
| |
|
Gene: PPCS |
Gene summary for PPCS |
| Gene information | Species | Human | Gene symbol | PPCS | Gene ID | 79717 |
| Gene name | phosphopantothenoylcysteine synthetase | |
| Gene Alias | CMD2C | |
| Cytomap | 1p34.2 | |
| Gene Type | protein-coding | GO ID | GO:0003008 | UniProtAcc | Q9HAB8 |
Top |
Malignant transformation analysis |
| Identification of the aberrant gene expression in precancerous and cancerous lesions by comparing the gene expression of stem-like cells in diseased tissues with normal stem cells |
| Entrez ID | Symbol | Replicates | Species | Organ | Tissue | Adj P-value | Log2FC | Malignancy |
| 79717 | PPCS | GSM4909281 | Human | Breast | IDC | 5.07e-09 | 3.64e-01 | 0.21 |
| 79717 | PPCS | GSM4909293 | Human | Breast | IDC | 3.09e-03 | 2.07e-01 | 0.1581 |
| 79717 | PPCS | GSM4909294 | Human | Breast | IDC | 6.55e-04 | 2.94e-01 | 0.2022 |
| 79717 | PPCS | GSM4909296 | Human | Breast | IDC | 7.50e-05 | -5.47e-02 | 0.1524 |
| 79717 | PPCS | GSM4909297 | Human | Breast | IDC | 1.24e-04 | 3.00e-02 | 0.1517 |
| 79717 | PPCS | GSM4909305 | Human | Breast | IDC | 2.16e-02 | 2.11e-01 | 0.0436 |
| 79717 | PPCS | GSM4909311 | Human | Breast | IDC | 3.45e-13 | -8.67e-02 | 0.1534 |
| 79717 | PPCS | GSM4909312 | Human | Breast | IDC | 2.00e-06 | 2.13e-01 | 0.1552 |
| 79717 | PPCS | GSM4909316 | Human | Breast | IDC | 1.62e-03 | 2.80e-01 | 0.21 |
| 79717 | PPCS | GSM4909317 | Human | Breast | IDC | 1.36e-10 | 3.41e-01 | 0.1355 |
| 79717 | PPCS | GSM4909318 | Human | Breast | IDC | 5.51e-03 | 3.45e-01 | 0.2031 |
| 79717 | PPCS | GSM4909319 | Human | Breast | IDC | 2.30e-21 | -4.72e-02 | 0.1563 |
| 79717 | PPCS | GSM4909321 | Human | Breast | IDC | 1.35e-05 | -1.15e-01 | 0.1559 |
| 79717 | PPCS | brca1 | Human | Breast | Precancer | 1.08e-02 | 2.07e-01 | -0.0338 |
| 79717 | PPCS | M5 | Human | Breast | IDC | 3.98e-02 | 4.17e-01 | 0.1598 |
| 79717 | PPCS | NCCBC14 | Human | Breast | DCIS | 3.32e-06 | 1.89e-01 | 0.2021 |
| 79717 | PPCS | NCCBC2 | Human | Breast | DCIS | 3.69e-02 | 2.04e-01 | 0.1554 |
| 79717 | PPCS | NCCBC5 | Human | Breast | DCIS | 9.19e-17 | 4.28e-01 | 0.2046 |
| 79717 | PPCS | P1 | Human | Breast | IDC | 5.21e-07 | -1.20e-01 | 0.1527 |
| 79717 | PPCS | DCIS2 | Human | Breast | DCIS | 1.12e-54 | 2.16e-01 | 0.0085 |
| Page: 1 2 3 4 5 6 7 8 9 |
| Tissue | Expression Dynamics | Abbreviation |
| Breast | 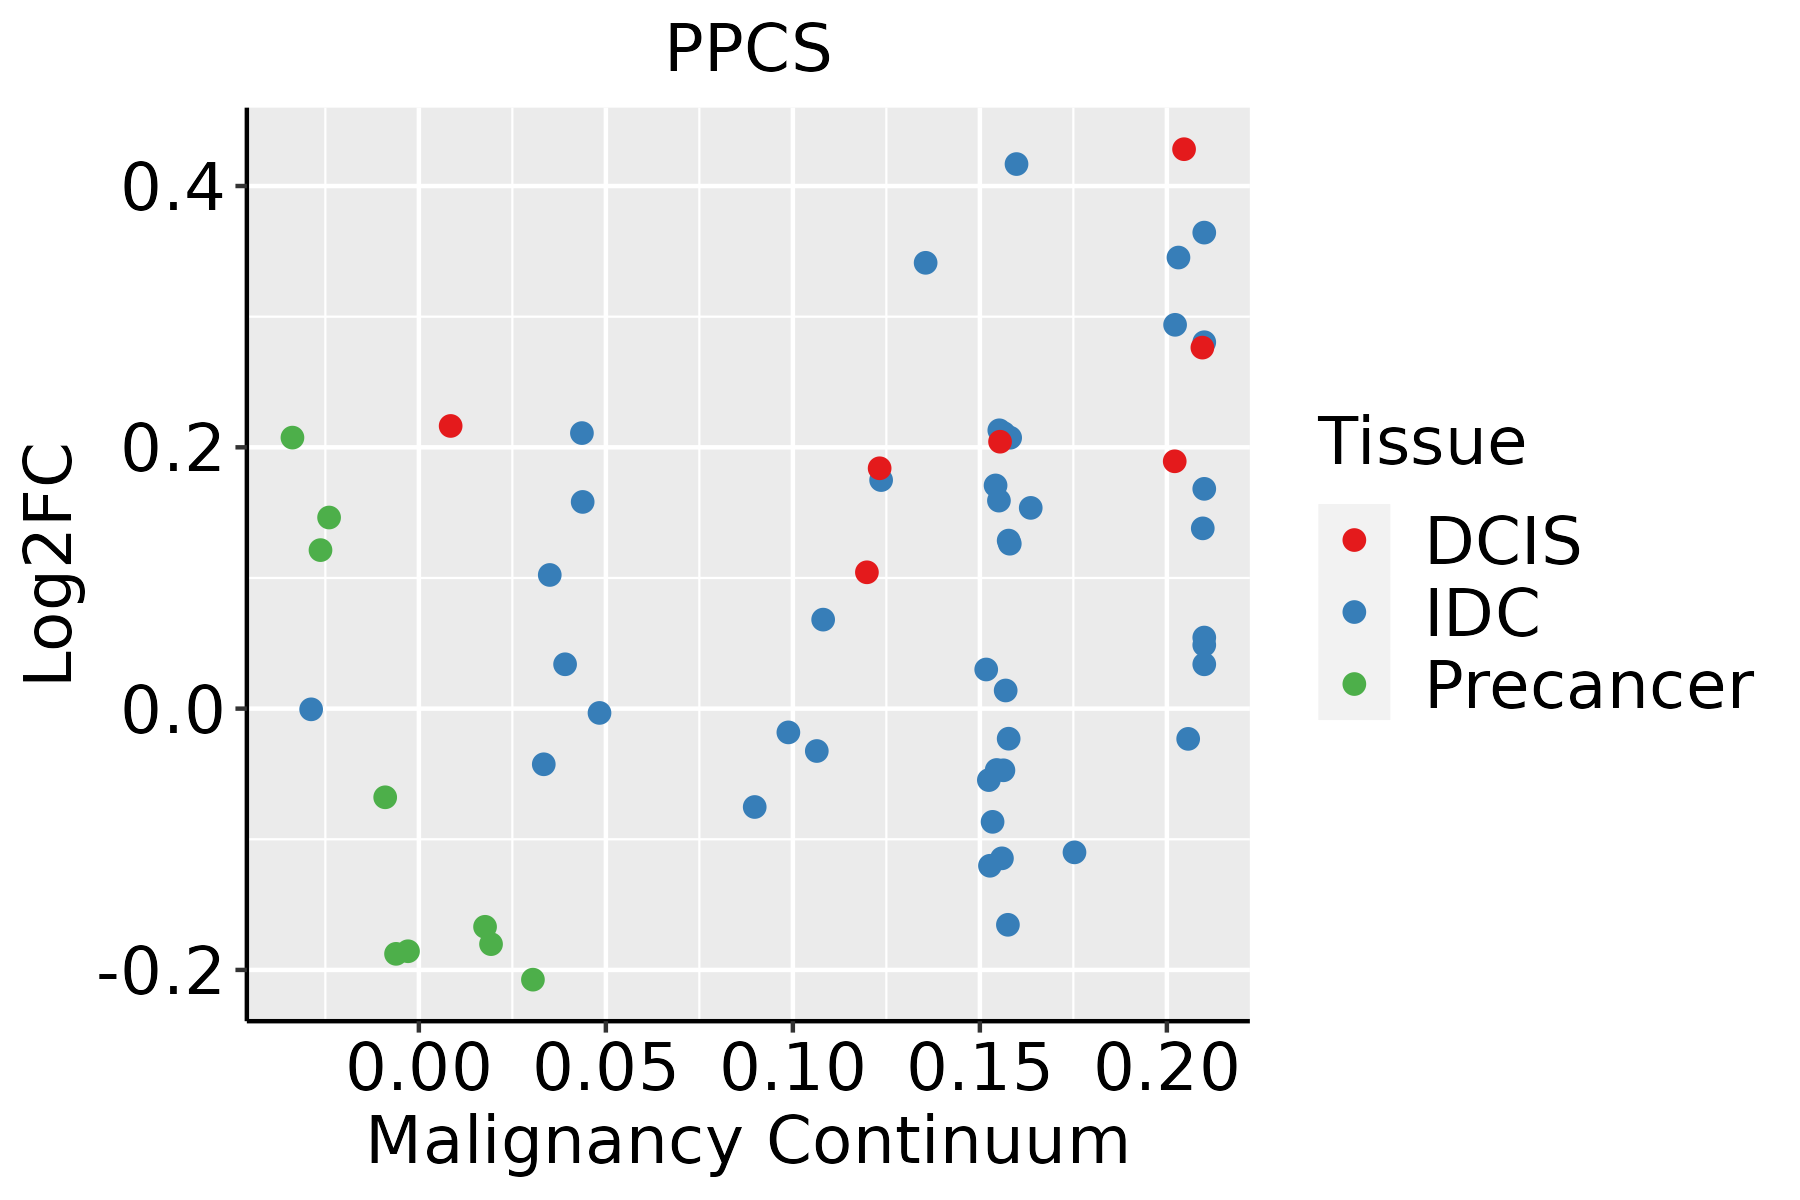 | IDC: Invasive ductal carcinoma |
| DCIS: Ductal carcinoma in situ | ||
| Precancer(BRCA1-mut): Precancerous lesion from BRCA1 mutation carriers | ||
| Endometrium | 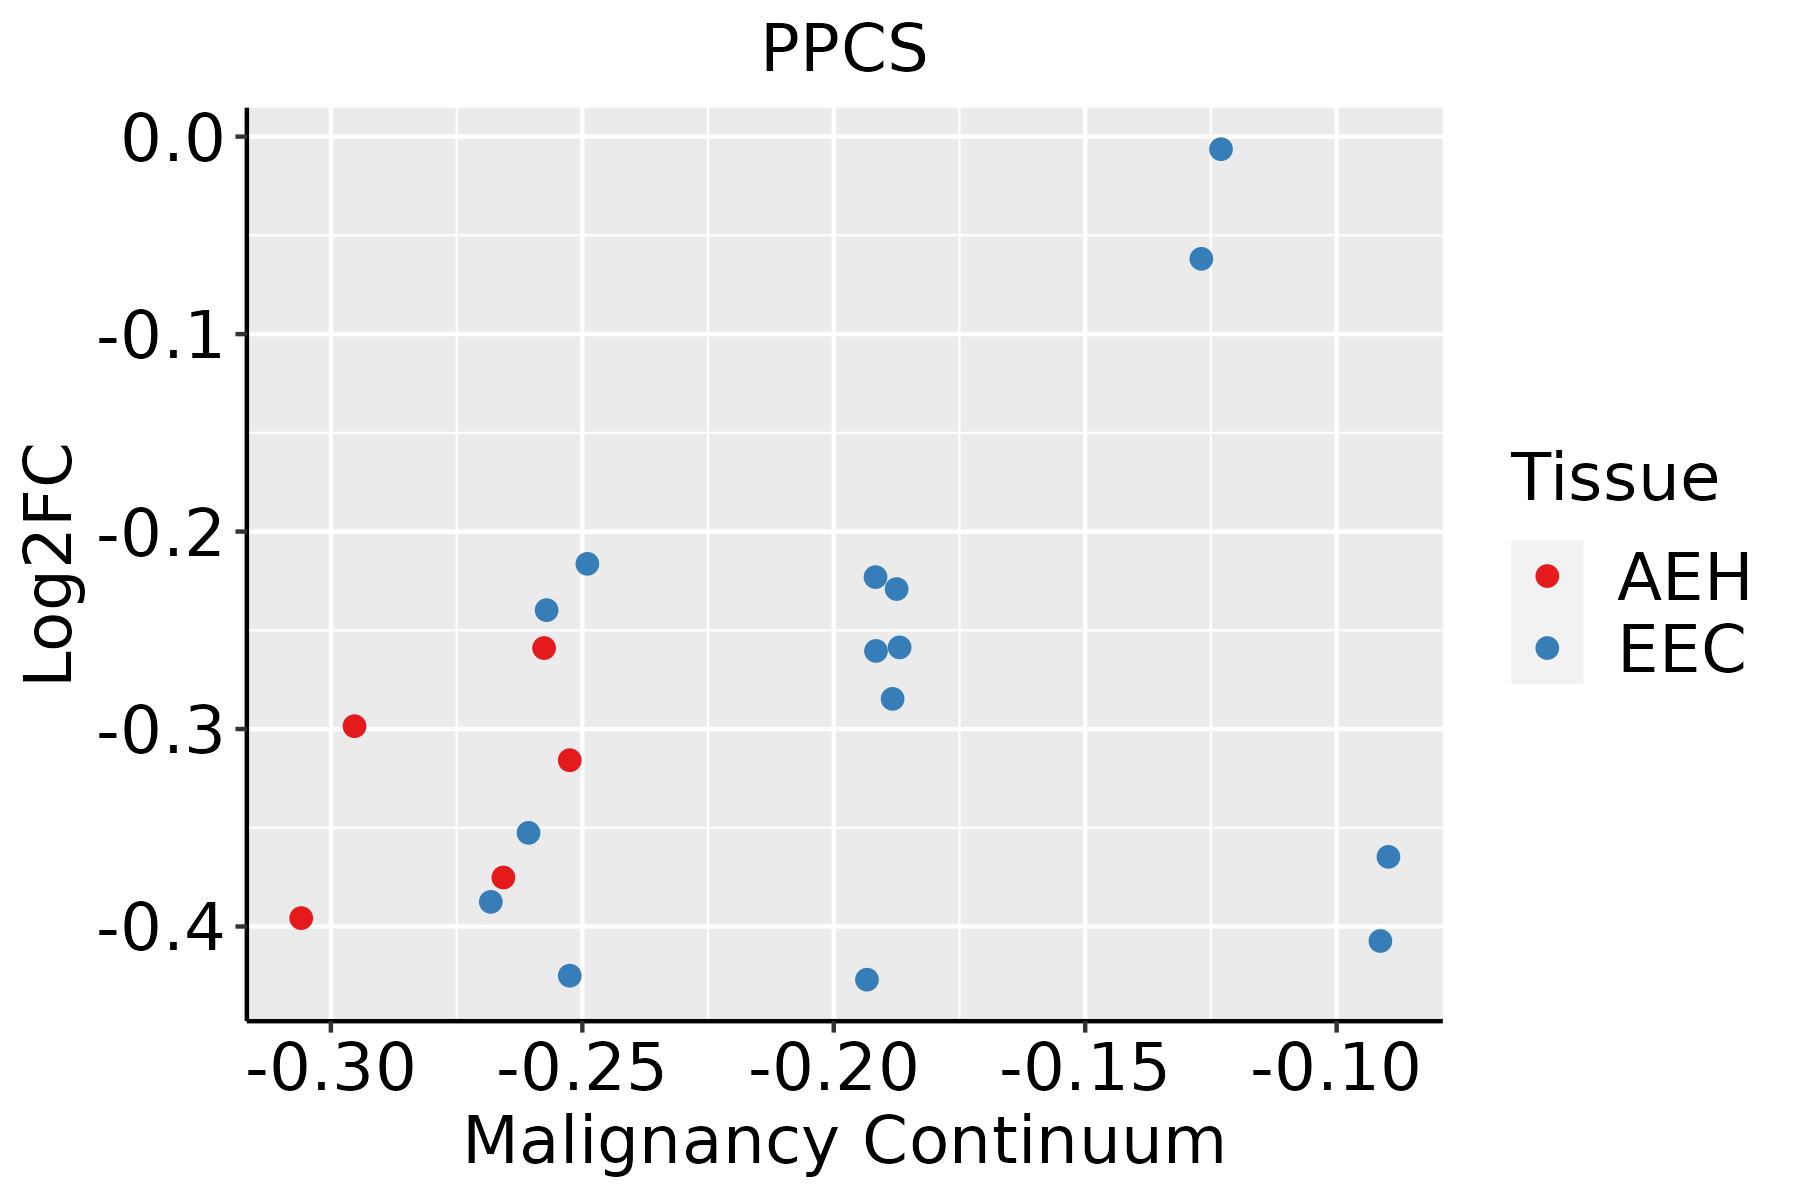 | AEH: Atypical endometrial hyperplasia |
| EEC: Endometrioid Cancer | ||
| Esophagus |  | ESCC: Esophageal squamous cell carcinoma |
| HGIN: High-grade intraepithelial neoplasias | ||
| LGIN: Low-grade intraepithelial neoplasias | ||
| Liver | 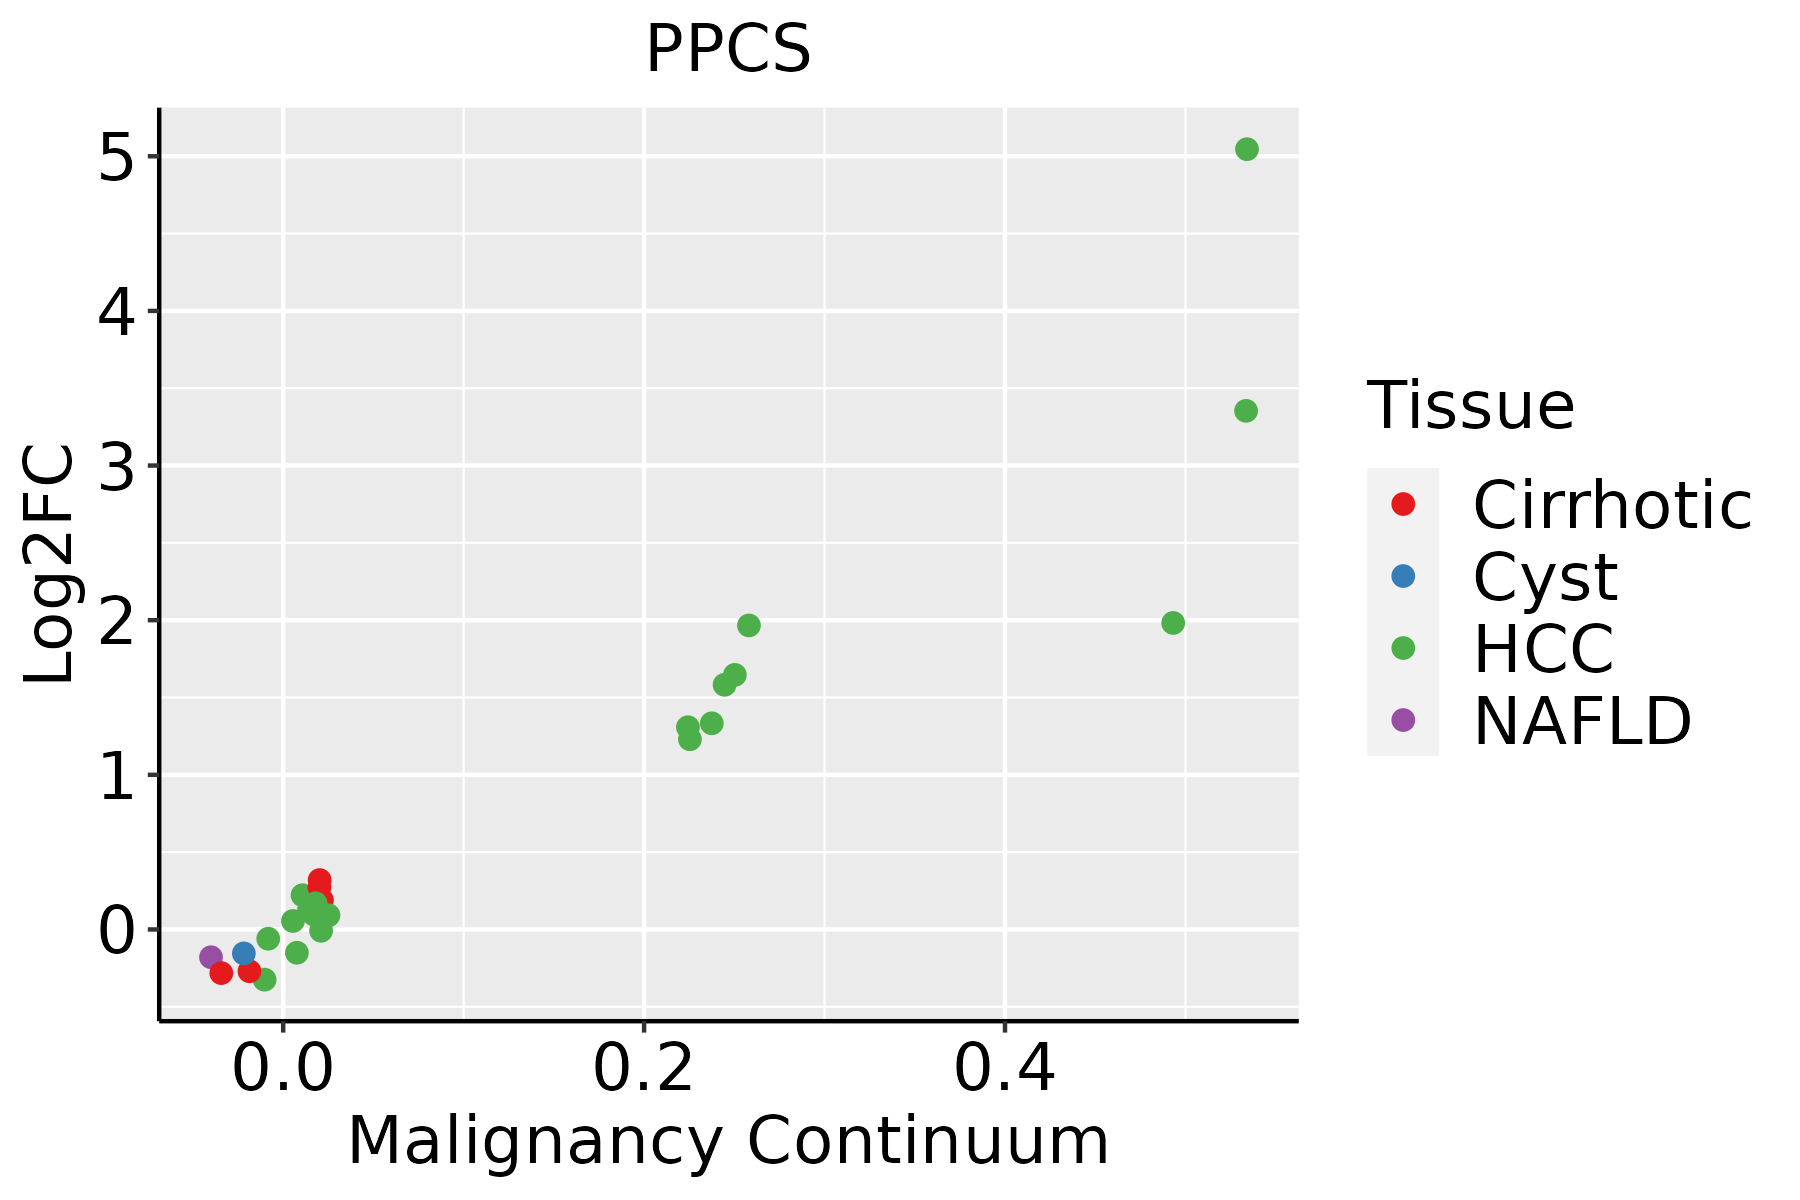 | HCC: Hepatocellular carcinoma |
| NAFLD: Non-alcoholic fatty liver disease | ||
| Oral Cavity | 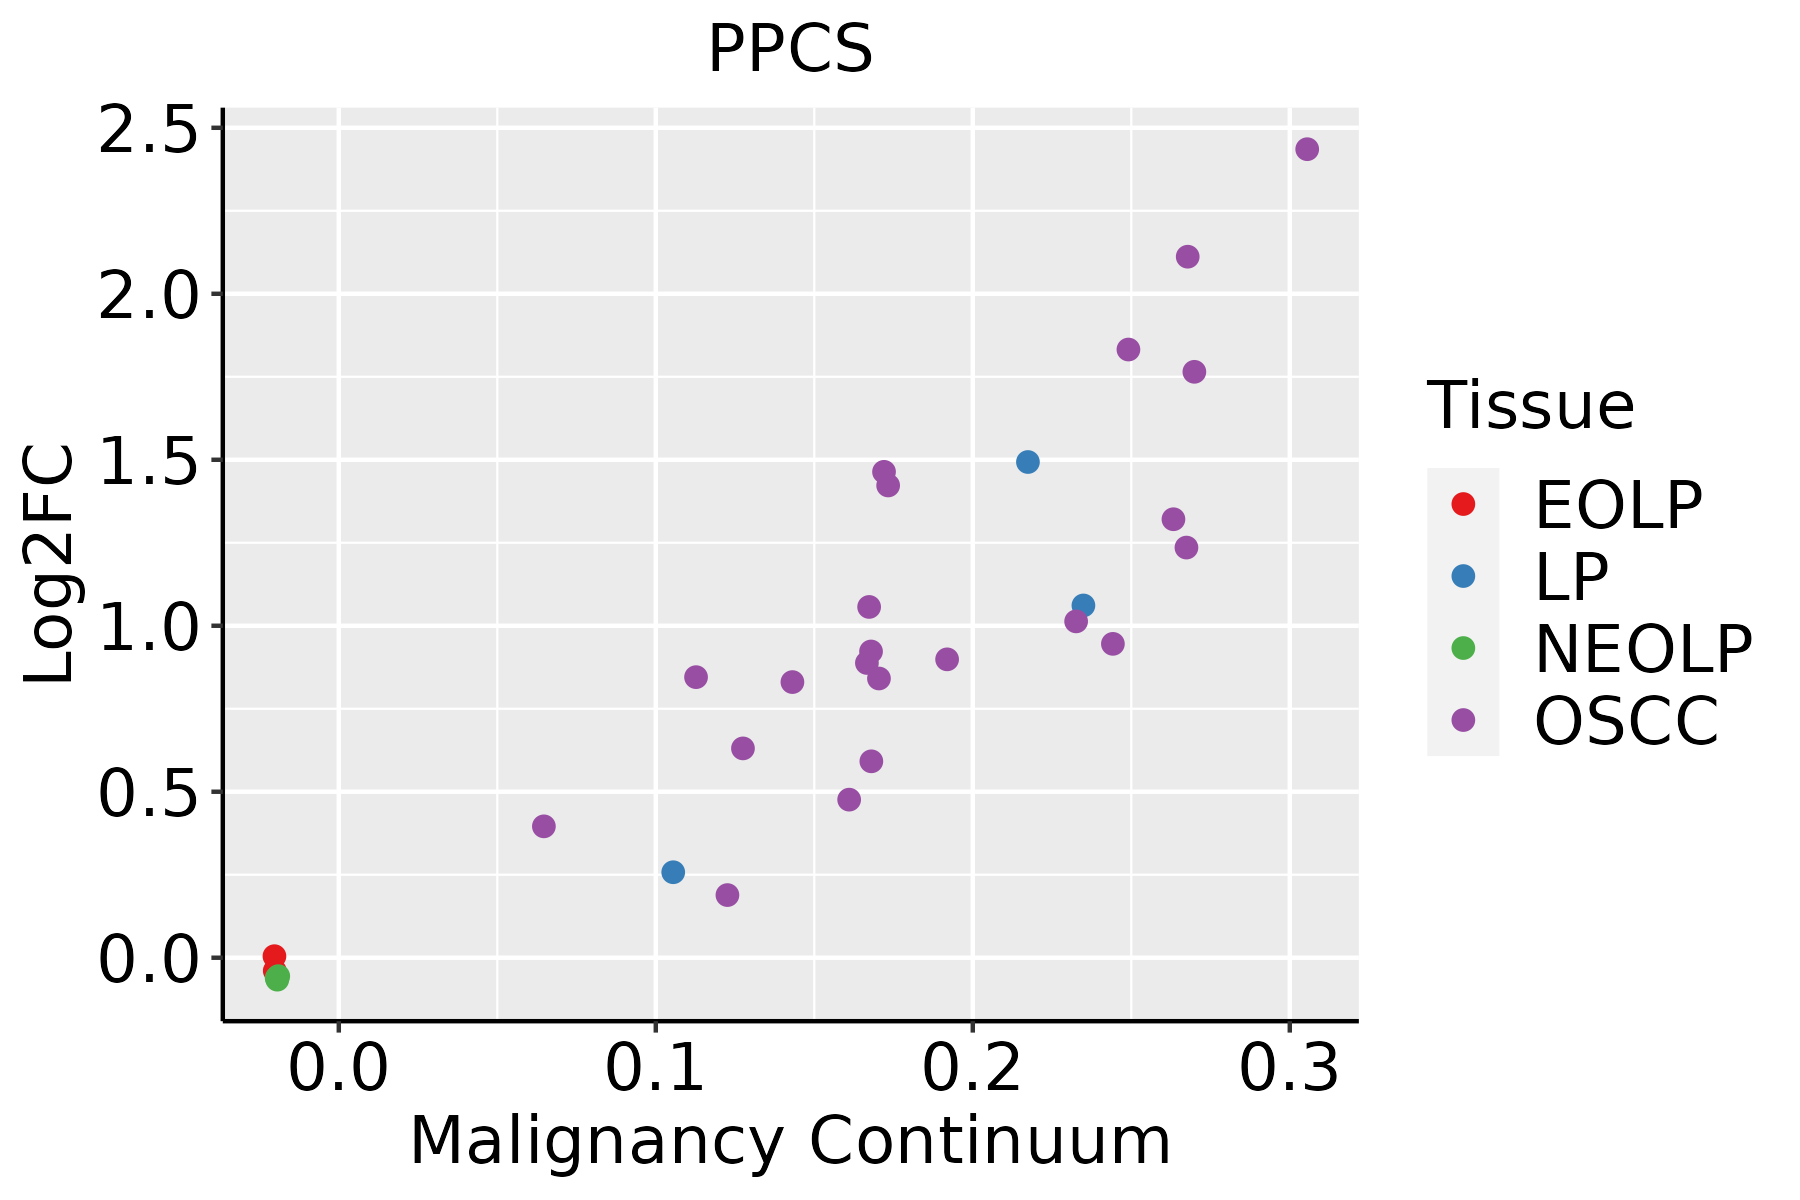 | EOLP: Erosive Oral lichen planus |
| LP: leukoplakia | ||
| NEOLP: Non-erosive oral lichen planus | ||
| OSCC: Oral squamous cell carcinoma | ||
| Prostate | 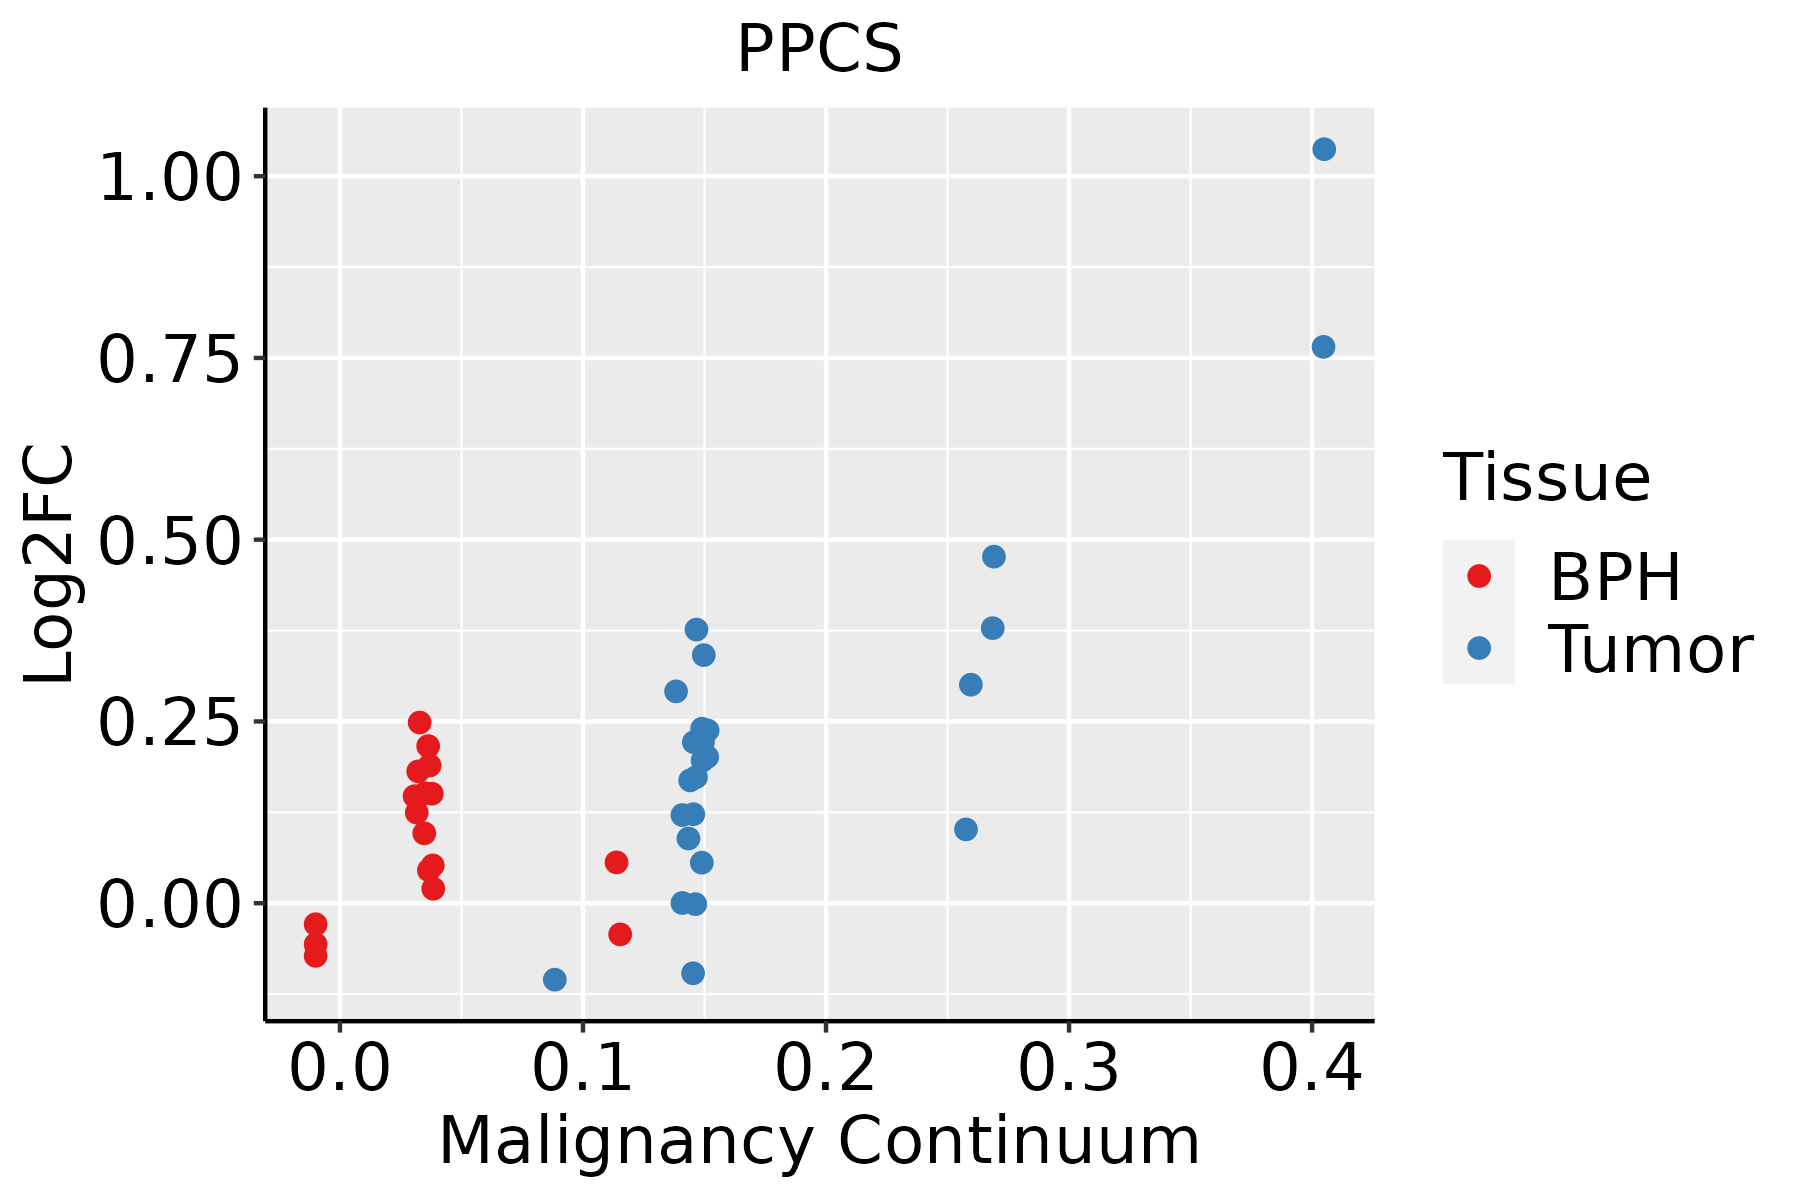 | BPH: Benign Prostatic Hyperplasia |
| Skin | 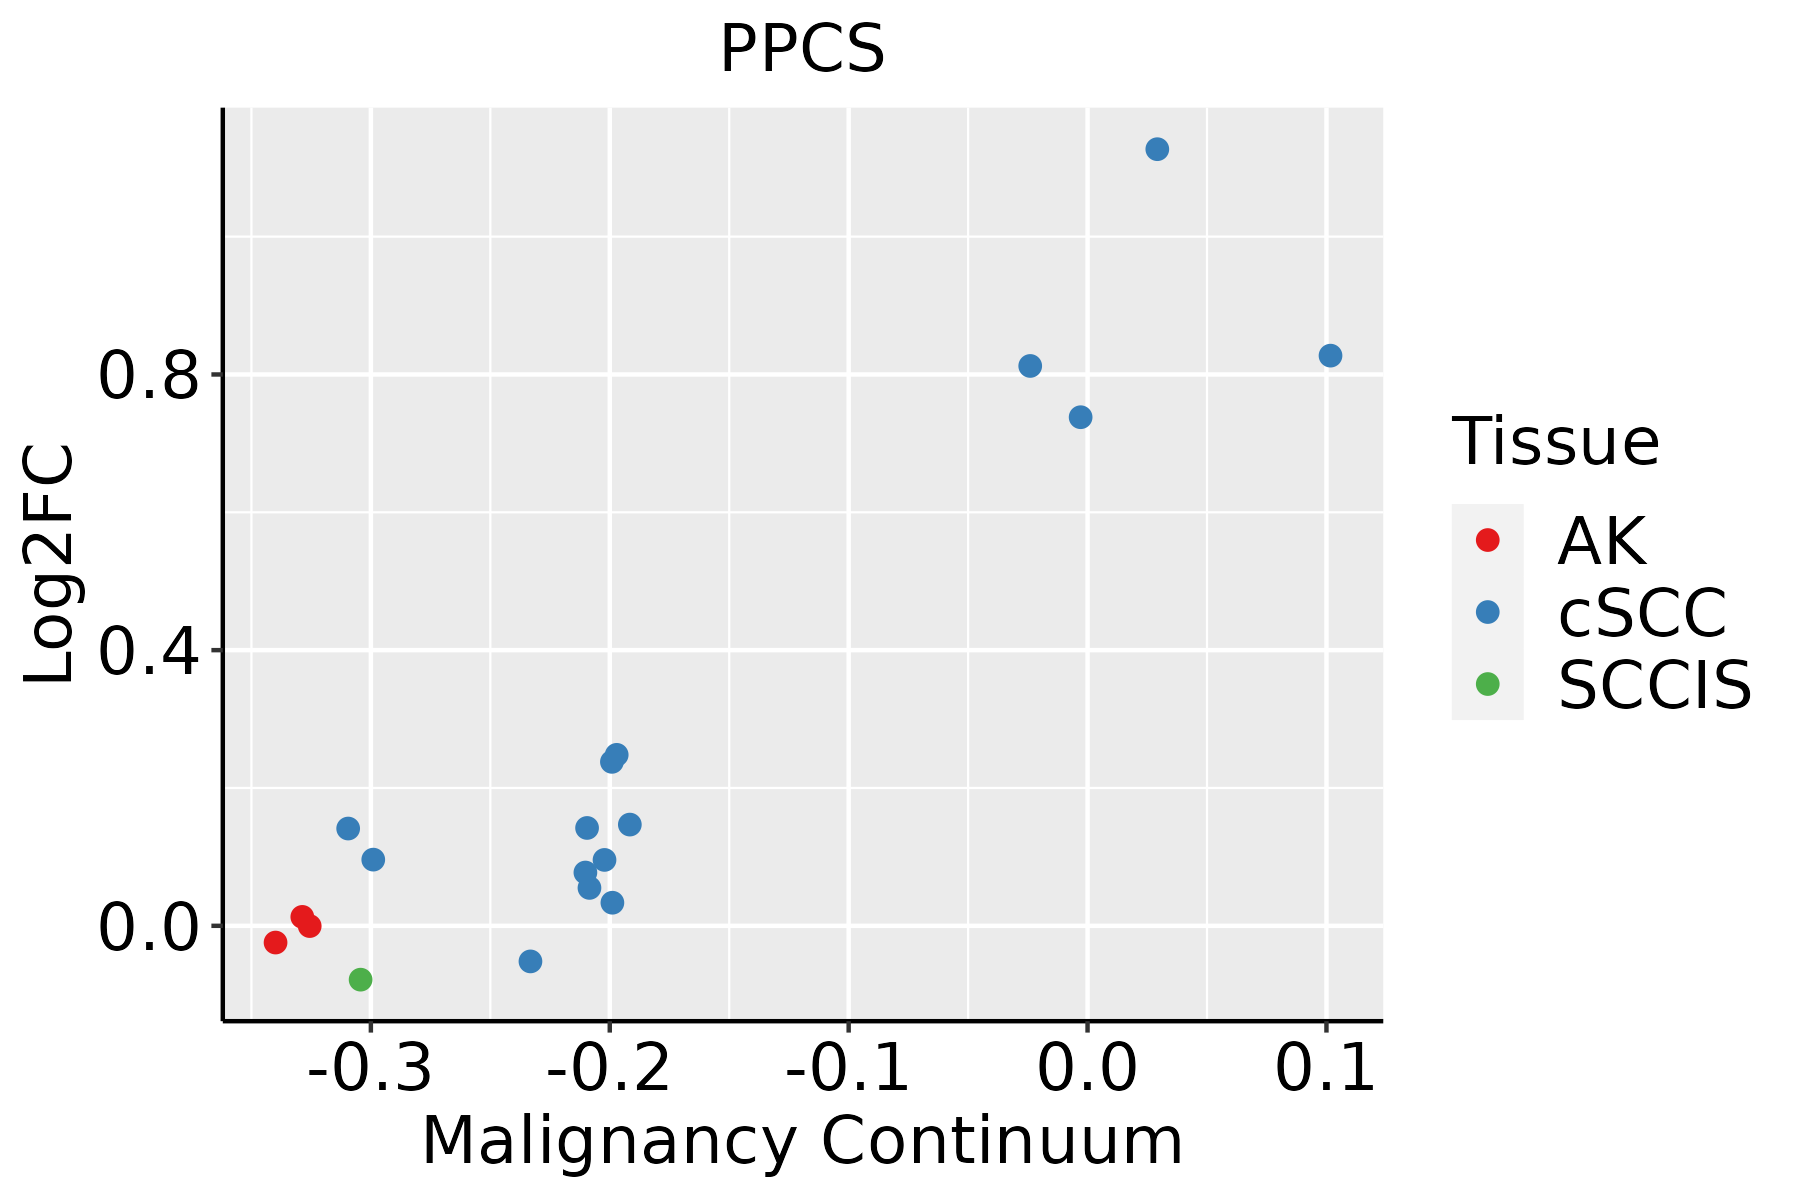 | AK: Actinic keratosis |
| cSCC: Cutaneous squamous cell carcinoma | ||
| SCCIS:squamous cell carcinoma in situ | ||
| Thyroid | 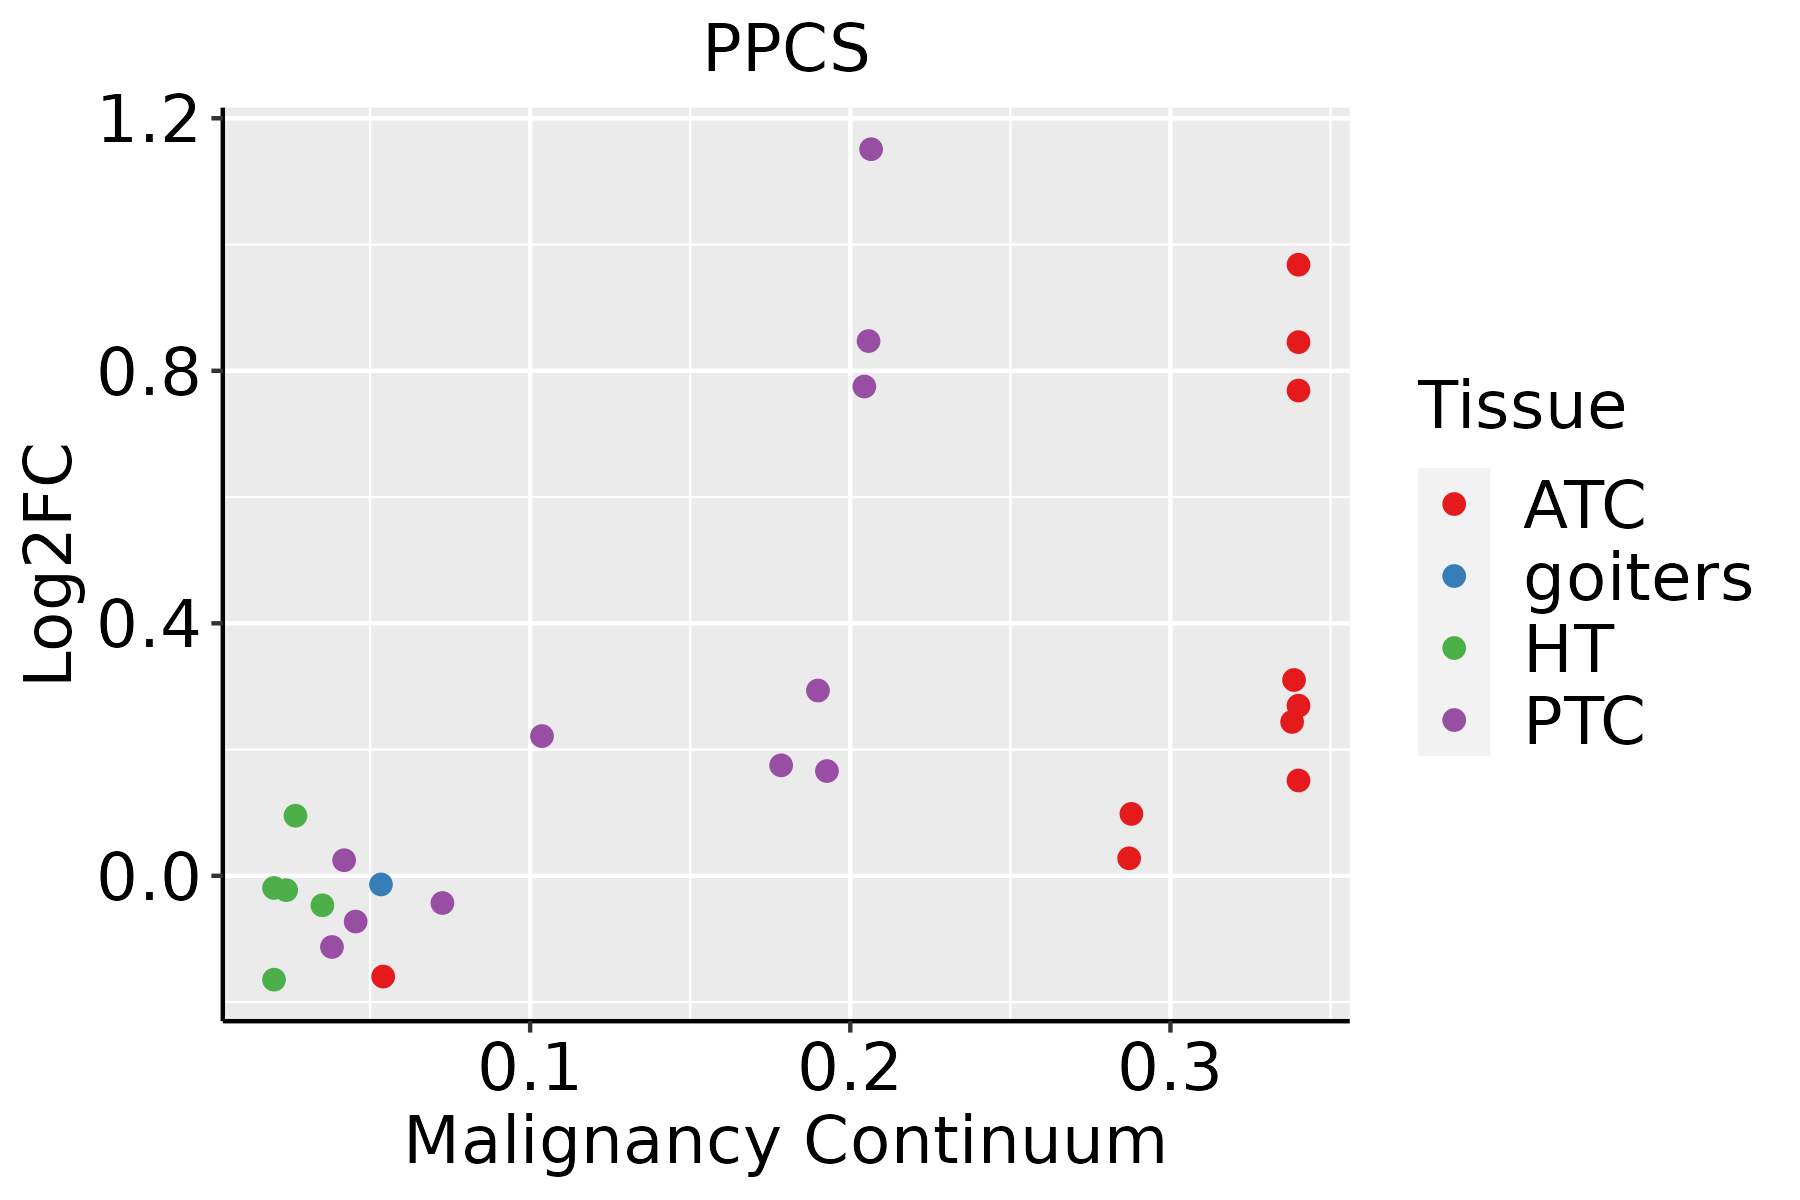 | ATC: Anaplastic thyroid cancer |
| HT: Hashimoto's thyroiditis | ||
| PTC: Papillary thyroid cancer |
| ∗log2FC in expression of this searched gene in stem-like cells from each diseased tissue sample relative to stem-like cells in normal samples in each tissue plotted against the malignancy continuum. Samples are colored based on if they are from different disease stage. |
Top |
Malignant transformation related pathway analysis |
| Find out the enriched GO biological processes and KEGG pathways involved in transition from healthy to precancer to cancer |
| Tissue | Disease Stage | Enriched GO biological Processes |
| Colorectum | AD |  |
| Colorectum | SER |  |
| Colorectum | MSS |  |
| Colorectum | MSI-H |  |
| Colorectum | FAP |  |
| ∗Top 15 enriched GO BP terms are showed in the bar plot of each disease state in each tissue. Each row represents a significant GO biological process which is colored according to the -log10(p.adjust). |
| Page: 1 2 3 4 5 6 7 8 9 |
| GO ID | Tissue | Disease Stage | Description | Gene Ratio | Bg Ratio | pvalue | p.adjust | Count |
| GO:00196938 | Breast | Precancer | ribose phosphate metabolic process | 49/1080 | 396/18723 | 3.81e-07 | 1.78e-05 | 49 |
| GO:00091528 | Breast | Precancer | purine ribonucleotide biosynthetic process | 28/1080 | 169/18723 | 4.17e-07 | 1.89e-05 | 28 |
| GO:00463907 | Breast | Precancer | ribose phosphate biosynthetic process | 30/1080 | 190/18723 | 4.75e-07 | 2.11e-05 | 30 |
| GO:00092607 | Breast | Precancer | ribonucleotide biosynthetic process | 29/1080 | 182/18723 | 6.05e-07 | 2.55e-05 | 29 |
| GO:00091509 | Breast | Precancer | purine ribonucleotide metabolic process | 46/1080 | 368/18723 | 6.47e-07 | 2.71e-05 | 46 |
| GO:00091179 | Breast | Precancer | nucleotide metabolic process | 56/1080 | 489/18723 | 7.40e-07 | 3.00e-05 | 56 |
| GO:00092598 | Breast | Precancer | ribonucleotide metabolic process | 47/1080 | 385/18723 | 9.69e-07 | 3.84e-05 | 47 |
| GO:00067539 | Breast | Precancer | nucleoside phosphate metabolic process | 56/1080 | 497/18723 | 1.24e-06 | 4.70e-05 | 56 |
| GO:00061639 | Breast | Precancer | purine nucleotide metabolic process | 47/1080 | 396/18723 | 2.14e-06 | 7.50e-05 | 47 |
| GO:00061647 | Breast | Precancer | purine nucleotide biosynthetic process | 28/1080 | 191/18723 | 5.04e-06 | 1.52e-04 | 28 |
| GO:00725219 | Breast | Precancer | purine-containing compound metabolic process | 47/1080 | 416/18723 | 8.19e-06 | 2.20e-04 | 47 |
| GO:00725227 | Breast | Precancer | purine-containing compound biosynthetic process | 28/1080 | 200/18723 | 1.23e-05 | 3.17e-04 | 28 |
| GO:00091655 | Breast | Precancer | nucleotide biosynthetic process | 32/1080 | 254/18723 | 2.72e-05 | 6.21e-04 | 32 |
| GO:19012935 | Breast | Precancer | nucleoside phosphate biosynthetic process | 32/1080 | 256/18723 | 3.18e-05 | 6.97e-04 | 32 |
| GO:000915214 | Breast | IDC | purine ribonucleotide biosynthetic process | 34/1434 | 169/18723 | 1.63e-07 | 8.92e-06 | 34 |
| GO:004639013 | Breast | IDC | ribose phosphate biosynthetic process | 36/1434 | 190/18723 | 3.40e-07 | 1.73e-05 | 36 |
| GO:000926013 | Breast | IDC | ribonucleotide biosynthetic process | 35/1434 | 182/18723 | 3.40e-07 | 1.73e-05 | 35 |
| GO:000915014 | Breast | IDC | purine ribonucleotide metabolic process | 55/1434 | 368/18723 | 1.30e-06 | 5.72e-05 | 55 |
| GO:001969314 | Breast | IDC | ribose phosphate metabolic process | 58/1434 | 396/18723 | 1.31e-06 | 5.73e-05 | 58 |
| GO:000675313 | Breast | IDC | nucleoside phosphate metabolic process | 68/1434 | 497/18723 | 2.01e-06 | 8.23e-05 | 68 |
| Page: 1 2 3 4 5 6 7 8 9 10 11 12 13 14 15 |
| Pathway ID | Tissue | Disease Stage | Description | Gene Ratio | Bg Ratio | pvalue | p.adjust | qvalue | Count |
| hsa012405 | Esophagus | ESCC | Biosynthesis of cofactors | 97/4205 | 153/8465 | 3.88e-04 | 1.35e-03 | 6.94e-04 | 97 |
| hsa0124012 | Esophagus | ESCC | Biosynthesis of cofactors | 97/4205 | 153/8465 | 3.88e-04 | 1.35e-03 | 6.94e-04 | 97 |
| hsa01240 | Liver | Cirrhotic | Biosynthesis of cofactors | 66/2530 | 153/8465 | 3.11e-04 | 1.99e-03 | 1.23e-03 | 66 |
| hsa00770 | Liver | Cirrhotic | Pantothenate and CoA biosynthesis | 13/2530 | 21/8465 | 2.32e-03 | 9.90e-03 | 6.10e-03 | 13 |
| hsa012401 | Liver | Cirrhotic | Biosynthesis of cofactors | 66/2530 | 153/8465 | 3.11e-04 | 1.99e-03 | 1.23e-03 | 66 |
| hsa007701 | Liver | Cirrhotic | Pantothenate and CoA biosynthesis | 13/2530 | 21/8465 | 2.32e-03 | 9.90e-03 | 6.10e-03 | 13 |
| hsa012402 | Liver | HCC | Biosynthesis of cofactors | 103/4020 | 153/8465 | 4.67e-07 | 5.05e-06 | 2.81e-06 | 103 |
| hsa007702 | Liver | HCC | Pantothenate and CoA biosynthesis | 16/4020 | 21/8465 | 7.16e-03 | 1.97e-02 | 1.09e-02 | 16 |
| hsa012403 | Liver | HCC | Biosynthesis of cofactors | 103/4020 | 153/8465 | 4.67e-07 | 5.05e-06 | 2.81e-06 | 103 |
| hsa007703 | Liver | HCC | Pantothenate and CoA biosynthesis | 16/4020 | 21/8465 | 7.16e-03 | 1.97e-02 | 1.09e-02 | 16 |
| hsa012404 | Oral cavity | OSCC | Biosynthesis of cofactors | 88/3704 | 153/8465 | 3.84e-04 | 1.20e-03 | 6.12e-04 | 88 |
| hsa0124011 | Oral cavity | OSCC | Biosynthesis of cofactors | 88/3704 | 153/8465 | 3.84e-04 | 1.20e-03 | 6.12e-04 | 88 |
| hsa0124021 | Oral cavity | LP | Biosynthesis of cofactors | 57/2418 | 153/8465 | 1.17e-02 | 3.91e-02 | 2.52e-02 | 57 |
| hsa0124031 | Oral cavity | LP | Biosynthesis of cofactors | 57/2418 | 153/8465 | 1.17e-02 | 3.91e-02 | 2.52e-02 | 57 |
| Page: 1 |
Top |
Cell-cell communication analysis |
| Identification of potential cell-cell interactions between two cell types and their ligand-receptor pairs for different disease states |
| Ligand | Receptor | LRpair | Pathway | Tissue | Disease Stage |
| Page: 1 |
Top |
Single-cell gene regulatory network inference analysis |
| Find out the significant the regulons (TFs) and the target genes of each regulon across cell types for different disease states |
| TF | Cell Type | Tissue | Disease Stage | Target Gene | RSS | Regulon Activity |
| ∗The dot plots of a searched regulon are shown for all cell subpopulations in each disease state of each tissue based on the regulon specific score inferred using pySCENIC and by calculating the average expression. |
| Page: 1 |
Top |
Somatic mutation of malignant transformation related genes |
| Annotation of somatic variants for genes involved in malignant transformation |
| Hugo Symbol | Variant Class | Variant Classification | dbSNP RS | HGVSc | HGVSp | HGVSp Short | SWISSPROT | BIOTYPE | SIFT | PolyPhen | Tumor Sample Barcode | Tissue | Histology | Sex | Age | Stage | Therapy Types | Drugs | Outcome |
| PPCS | SNV | Missense_Mutation | c.211N>C | p.Glu71Gln | p.E71Q | Q9HAB8 | protein_coding | deleterious(0) | possibly_damaging(0.905) | TCGA-A8-A09E-01 | Breast | breast invasive carcinoma | Female | >=65 | III/IV | Hormone Therapy | anastrozole | SD | |
| PPCS | insertion | Frame_Shift_Ins | novel | c.491_492insCAGTACGGCGCGGCGCGTACACCAGGTAGGCGAGAAGG | p.Gln164HisfsTer19 | p.Q164Hfs*19 | Q9HAB8 | protein_coding | TCGA-AN-A03X-01 | Breast | breast invasive carcinoma | Female | >=65 | I/II | Unknown | Unknown | SD | ||
| PPCS | SNV | Missense_Mutation | c.709N>A | p.Ala237Thr | p.A237T | Q9HAB8 | protein_coding | tolerated(0.2) | benign(0) | TCGA-AA-3821-01 | Colorectum | colon adenocarcinoma | Female | >=65 | I/II | Unknown | Unknown | SD | |
| PPCS | SNV | Missense_Mutation | c.709N>A | p.Ala237Thr | p.A237T | Q9HAB8 | protein_coding | tolerated(0.2) | benign(0) | TCGA-AA-3947-01 | Colorectum | colon adenocarcinoma | Female | <65 | I/II | Unknown | Unknown | SD | |
| PPCS | SNV | Missense_Mutation | novel | c.536C>T | p.Ala179Val | p.A179V | Q9HAB8 | protein_coding | deleterious(0) | probably_damaging(1) | TCGA-AA-3949-01 | Colorectum | colon adenocarcinoma | Female | >=65 | III/IV | Unknown | Unknown | SD |
| PPCS | SNV | Missense_Mutation | novel | c.929N>T | p.Arg310Ile | p.R310I | Q9HAB8 | protein_coding | deleterious(0.01) | benign(0.043) | TCGA-CA-6717-01 | Colorectum | colon adenocarcinoma | Male | <65 | I/II | Chemotherapy | oxaliplatin | CR |
| PPCS | SNV | Missense_Mutation | c.430N>A | p.Phe144Ile | p.F144I | Q9HAB8 | protein_coding | tolerated(0.14) | benign(0.007) | TCGA-F4-6570-01 | Colorectum | colon adenocarcinoma | Female | >=65 | I/II | Unknown | Unknown | SD | |
| PPCS | SNV | Missense_Mutation | rs748847721 | c.730C>T | p.Arg244Trp | p.R244W | Q9HAB8 | protein_coding | deleterious(0) | probably_damaging(0.999) | TCGA-AG-A002-01 | Colorectum | rectum adenocarcinoma | Male | <65 | I/II | Unknown | Unknown | SD |
| PPCS | insertion | Frame_Shift_Ins | novel | c.336_337dupTT | p.Ser113PhefsTer5 | p.S113Ffs*5 | Q9HAB8 | protein_coding | TCGA-DC-6681-01 | Colorectum | rectum adenocarcinoma | Female | >=65 | I/II | Chemotherapy | 5-fluorouracil | SD | ||
| PPCS | SNV | Missense_Mutation | c.772N>G | p.Asn258Asp | p.N258D | Q9HAB8 | protein_coding | deleterious(0) | probably_damaging(0.999) | TCGA-A5-A0VP-01 | Endometrium | uterine corpus endometrioid carcinoma | Female | >=65 | I/II | Unknown | Unknown | SD |
| Page: 1 2 3 4 |
Top |
Related drugs of malignant transformation related genes |
| Identification of chemicals and drugs interact with genes involved in malignant transfromation |
| (DGIdb 4.0) |
| Entrez ID | Symbol | Category | Interaction Types | Drug Claim Name | Drug Name | PMIDs |
| Page: 1 |

Copyright 2023-Present -The University of Texas Health Science Center at Houston |