
|
|||||
|
 | |
| |
| |
| |
| |
| |
|
Gene: PPCDC |
Gene summary for PPCDC |
| Gene information | Species | Human | Gene symbol | PPCDC | Gene ID | 60490 |
| Gene name | phosphopantothenoylcysteine decarboxylase | |
| Gene Alias | MDS018 | |
| Cytomap | 15q24.2 | |
| Gene Type | protein-coding | GO ID | GO:0006139 | UniProtAcc | H3BQB0 |
Top |
Malignant transformation analysis |
| Identification of the aberrant gene expression in precancerous and cancerous lesions by comparing the gene expression of stem-like cells in diseased tissues with normal stem cells |
| Entrez ID | Symbol | Replicates | Species | Organ | Tissue | Adj P-value | Log2FC | Malignancy |
| 60490 | PPCDC | LZE7T | Human | Esophagus | ESCC | 3.71e-05 | 1.95e-01 | 0.0667 |
| 60490 | PPCDC | LZE24T | Human | Esophagus | ESCC | 1.20e-06 | 1.10e-01 | 0.0596 |
| 60490 | PPCDC | P2T-E | Human | Esophagus | ESCC | 8.64e-08 | 1.56e-01 | 0.1177 |
| 60490 | PPCDC | P4T-E | Human | Esophagus | ESCC | 2.43e-15 | 2.85e-01 | 0.1323 |
| 60490 | PPCDC | P5T-E | Human | Esophagus | ESCC | 4.57e-06 | 1.50e-01 | 0.1327 |
| 60490 | PPCDC | P8T-E | Human | Esophagus | ESCC | 7.53e-10 | 1.26e-01 | 0.0889 |
| 60490 | PPCDC | P9T-E | Human | Esophagus | ESCC | 3.06e-07 | 1.10e-01 | 0.1131 |
| 60490 | PPCDC | P10T-E | Human | Esophagus | ESCC | 1.28e-18 | 2.75e-01 | 0.116 |
| 60490 | PPCDC | P12T-E | Human | Esophagus | ESCC | 2.39e-06 | 1.33e-01 | 0.1122 |
| 60490 | PPCDC | P15T-E | Human | Esophagus | ESCC | 1.05e-18 | 2.97e-01 | 0.1149 |
| 60490 | PPCDC | P16T-E | Human | Esophagus | ESCC | 3.35e-17 | 2.63e-01 | 0.1153 |
| 60490 | PPCDC | P17T-E | Human | Esophagus | ESCC | 7.90e-06 | 2.20e-01 | 0.1278 |
| 60490 | PPCDC | P19T-E | Human | Esophagus | ESCC | 3.90e-02 | 1.98e-01 | 0.1662 |
| 60490 | PPCDC | P20T-E | Human | Esophagus | ESCC | 8.61e-12 | 2.26e-01 | 0.1124 |
| 60490 | PPCDC | P21T-E | Human | Esophagus | ESCC | 1.80e-12 | 2.19e-01 | 0.1617 |
| 60490 | PPCDC | P22T-E | Human | Esophagus | ESCC | 2.84e-06 | 9.68e-02 | 0.1236 |
| 60490 | PPCDC | P23T-E | Human | Esophagus | ESCC | 1.59e-12 | 3.82e-01 | 0.108 |
| 60490 | PPCDC | P24T-E | Human | Esophagus | ESCC | 2.49e-08 | 1.96e-01 | 0.1287 |
| 60490 | PPCDC | P26T-E | Human | Esophagus | ESCC | 1.52e-12 | 1.44e-01 | 0.1276 |
| 60490 | PPCDC | P27T-E | Human | Esophagus | ESCC | 2.58e-09 | 1.84e-01 | 0.1055 |
| Page: 1 2 3 |
| Tissue | Expression Dynamics | Abbreviation |
| Esophagus | 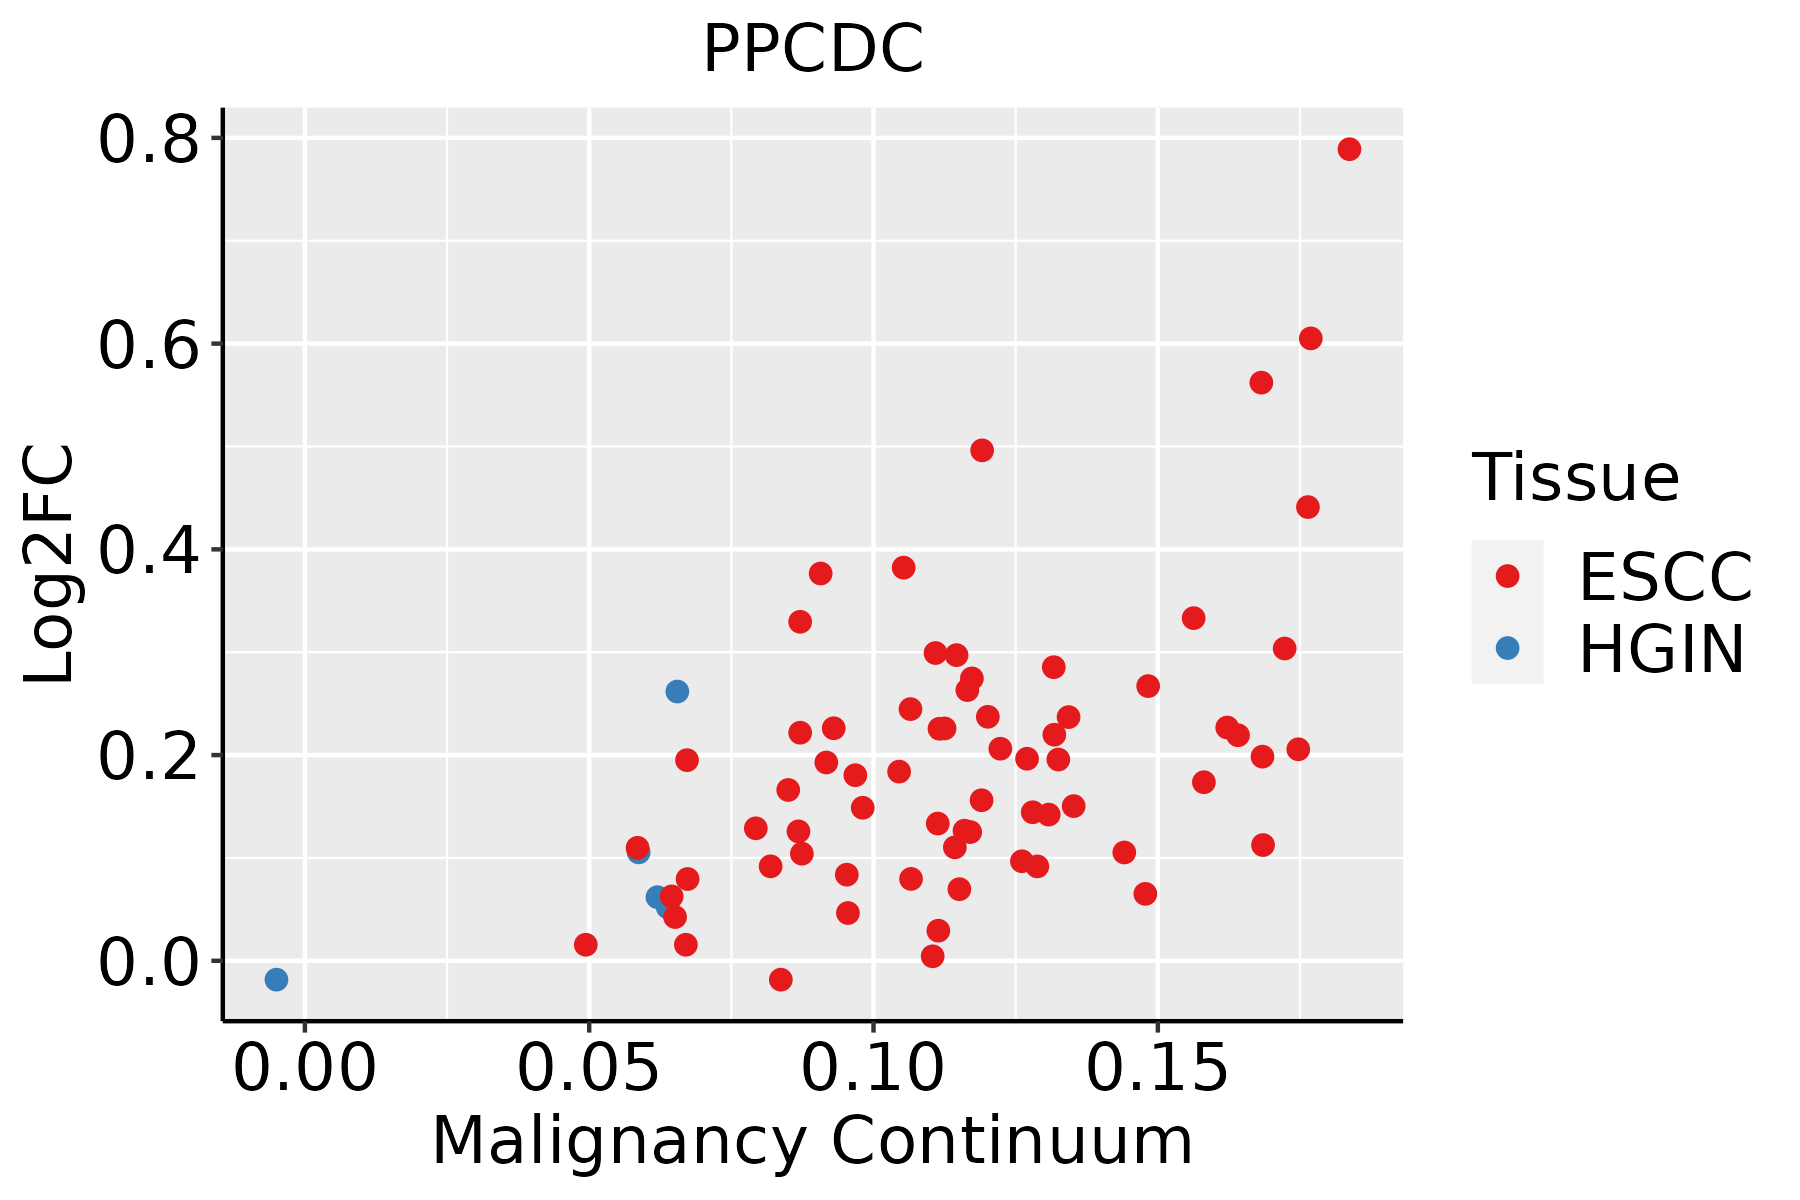 | ESCC: Esophageal squamous cell carcinoma |
| HGIN: High-grade intraepithelial neoplasias | ||
| LGIN: Low-grade intraepithelial neoplasias |
| ∗log2FC in expression of this searched gene in stem-like cells from each diseased tissue sample relative to stem-like cells in normal samples in each tissue plotted against the malignancy continuum. Samples are colored based on if they are from different disease stage. |
Top |
Malignant transformation related pathway analysis |
| Find out the enriched GO biological processes and KEGG pathways involved in transition from healthy to precancer to cancer |
| Tissue | Disease Stage | Enriched GO biological Processes |
| Colorectum | AD |  |
| Colorectum | SER |  |
| Colorectum | MSS |  |
| Colorectum | MSI-H |  |
| Colorectum | FAP |  |
| ∗Top 15 enriched GO BP terms are showed in the bar plot of each disease state in each tissue. Each row represents a significant GO biological process which is colored according to the -log10(p.adjust). |
| Page: 1 2 3 4 5 6 7 8 9 |
| GO ID | Tissue | Disease Stage | Description | Gene Ratio | Bg Ratio | pvalue | p.adjust | Count |
| GO:0006753110 | Esophagus | ESCC | nucleoside phosphate metabolic process | 288/8552 | 497/18723 | 1.80e-08 | 3.50e-07 | 288 |
| GO:0019693111 | Esophagus | ESCC | ribose phosphate metabolic process | 234/8552 | 396/18723 | 4.24e-08 | 7.76e-07 | 234 |
| GO:0009117111 | Esophagus | ESCC | nucleotide metabolic process | 282/8552 | 489/18723 | 4.70e-08 | 8.50e-07 | 282 |
| GO:0009259111 | Esophagus | ESCC | ribonucleotide metabolic process | 224/8552 | 385/18723 | 4.41e-07 | 6.00e-06 | 224 |
| GO:0072521111 | Esophagus | ESCC | purine-containing compound metabolic process | 238/8552 | 416/18723 | 1.20e-06 | 1.49e-05 | 238 |
| GO:0009150111 | Esophagus | ESCC | purine ribonucleotide metabolic process | 213/8552 | 368/18723 | 1.40e-06 | 1.69e-05 | 213 |
| GO:0046390110 | Esophagus | ESCC | ribose phosphate biosynthetic process | 119/8552 | 190/18723 | 1.73e-06 | 2.06e-05 | 119 |
| GO:0006163111 | Esophagus | ESCC | purine nucleotide metabolic process | 226/8552 | 396/18723 | 2.81e-06 | 3.21e-05 | 226 |
| GO:000916516 | Esophagus | ESCC | nucleotide biosynthetic process | 150/8552 | 254/18723 | 1.12e-05 | 1.06e-04 | 150 |
| GO:0009260110 | Esophagus | ESCC | ribonucleotide biosynthetic process | 112/8552 | 182/18723 | 1.12e-05 | 1.06e-04 | 112 |
| GO:190129316 | Esophagus | ESCC | nucleoside phosphate biosynthetic process | 151/8552 | 256/18723 | 1.15e-05 | 1.08e-04 | 151 |
| GO:00338664 | Esophagus | ESCC | nucleoside bisphosphate biosynthetic process | 44/8552 | 60/18723 | 1.25e-05 | 1.15e-04 | 44 |
| GO:00340304 | Esophagus | ESCC | ribonucleoside bisphosphate biosynthetic process | 44/8552 | 60/18723 | 1.25e-05 | 1.15e-04 | 44 |
| GO:00340334 | Esophagus | ESCC | purine nucleoside bisphosphate biosynthetic process | 44/8552 | 60/18723 | 1.25e-05 | 1.15e-04 | 44 |
| GO:007252217 | Esophagus | ESCC | purine-containing compound biosynthetic process | 120/8552 | 200/18723 | 3.02e-05 | 2.51e-04 | 120 |
| GO:0009152110 | Esophagus | ESCC | purine ribonucleotide biosynthetic process | 103/8552 | 169/18723 | 4.40e-05 | 3.51e-04 | 103 |
| GO:000616417 | Esophagus | ESCC | purine nucleotide biosynthetic process | 113/8552 | 191/18723 | 1.16e-04 | 8.04e-04 | 113 |
| GO:00338655 | Esophagus | ESCC | nucleoside bisphosphate metabolic process | 77/8552 | 128/18723 | 6.71e-04 | 3.55e-03 | 77 |
| GO:00338755 | Esophagus | ESCC | ribonucleoside bisphosphate metabolic process | 77/8552 | 128/18723 | 6.71e-04 | 3.55e-03 | 77 |
| GO:00340325 | Esophagus | ESCC | purine nucleoside bisphosphate metabolic process | 77/8552 | 128/18723 | 6.71e-04 | 3.55e-03 | 77 |
| Page: 1 2 |
| Pathway ID | Tissue | Disease Stage | Description | Gene Ratio | Bg Ratio | pvalue | p.adjust | qvalue | Count |
| hsa012405 | Esophagus | ESCC | Biosynthesis of cofactors | 97/4205 | 153/8465 | 3.88e-04 | 1.35e-03 | 6.94e-04 | 97 |
| hsa0124012 | Esophagus | ESCC | Biosynthesis of cofactors | 97/4205 | 153/8465 | 3.88e-04 | 1.35e-03 | 6.94e-04 | 97 |
| Page: 1 |
Top |
Cell-cell communication analysis |
| Identification of potential cell-cell interactions between two cell types and their ligand-receptor pairs for different disease states |
| Ligand | Receptor | LRpair | Pathway | Tissue | Disease Stage |
| Page: 1 |
Top |
Single-cell gene regulatory network inference analysis |
| Find out the significant the regulons (TFs) and the target genes of each regulon across cell types for different disease states |
| TF | Cell Type | Tissue | Disease Stage | Target Gene | RSS | Regulon Activity |
| ∗The dot plots of a searched regulon are shown for all cell subpopulations in each disease state of each tissue based on the regulon specific score inferred using pySCENIC and by calculating the average expression. |
| Page: 1 |
Top |
Somatic mutation of malignant transformation related genes |
| Annotation of somatic variants for genes involved in malignant transformation |
| Hugo Symbol | Variant Class | Variant Classification | dbSNP RS | HGVSc | HGVSp | HGVSp Short | SWISSPROT | BIOTYPE | SIFT | PolyPhen | Tumor Sample Barcode | Tissue | Histology | Sex | Age | Stage | Therapy Types | Drugs | Outcome |
| PPCDC | SNV | Missense_Mutation | rs373109290 | c.88N>C | p.Ala30Pro | p.A30P | Q96CD2 | protein_coding | deleterious(0) | probably_damaging(0.988) | TCGA-AC-A3BB-01 | Breast | breast invasive carcinoma | Female | <65 | III/IV | Chemotherapy | cytoxan | CR |
| PPCDC | insertion | In_Frame_Ins | novel | c.311_312insCAGGAG | p.Asp104_Ala105insArgSer | p.D104_A105insRS | Q96CD2 | protein_coding | TCGA-A2-A0CP-01 | Breast | breast invasive carcinoma | Female | <65 | I/II | Chemotherapy | cytoxan | SD | ||
| PPCDC | insertion | Frame_Shift_Ins | novel | c.312_313insTTGAGACCAGCTTG | p.Ala105LeufsTer40 | p.A105Lfs*40 | Q96CD2 | protein_coding | TCGA-A2-A0CP-01 | Breast | breast invasive carcinoma | Female | <65 | I/II | Chemotherapy | cytoxan | SD | ||
| PPCDC | SNV | Missense_Mutation | c.220G>A | p.Asp74Asn | p.D74N | Q96CD2 | protein_coding | deleterious(0.04) | possibly_damaging(0.483) | TCGA-DS-A0VM-01 | Cervix | cervical & endocervical cancer | Female | <65 | I/II | Chemotherapy | cisplatin | PD | |
| PPCDC | SNV | Missense_Mutation | rs746984037 | c.374G>A | p.Arg125Gln | p.R125Q | Q96CD2 | protein_coding | deleterious(0) | probably_damaging(1) | TCGA-AP-A0LM-01 | Endometrium | uterine corpus endometrioid carcinoma | Female | <65 | III/IV | Chemotherapy | cisplatin | SD |
| PPCDC | SNV | Missense_Mutation | rs777408463 | c.373N>T | p.Arg125Trp | p.R125W | Q96CD2 | protein_coding | deleterious(0) | probably_damaging(1) | TCGA-AX-A1C4-01 | Endometrium | uterine corpus endometrioid carcinoma | Female | <65 | I/II | Unknown | Unknown | SD |
| PPCDC | SNV | Missense_Mutation | novel | c.536N>A | p.Gly179Glu | p.G179E | Q96CD2 | protein_coding | deleterious(0) | probably_damaging(0.999) | TCGA-D1-A16X-01 | Endometrium | uterine corpus endometrioid carcinoma | Female | <65 | I/II | Unknown | Unknown | SD |
| PPCDC | SNV | Missense_Mutation | rs758416402 | c.85G>A | p.Ala29Thr | p.A29T | Q96CD2 | protein_coding | deleterious(0) | probably_damaging(1) | TCGA-DF-A2KU-01 | Endometrium | uterine corpus endometrioid carcinoma | Female | Unknown | I/II | Unknown | Unknown | SD |
| PPCDC | SNV | Missense_Mutation | novel | c.67N>A | p.Gly23Ser | p.G23S | Q96CD2 | protein_coding | deleterious(0.01) | probably_damaging(0.994) | TCGA-EO-A22U-01 | Endometrium | uterine corpus endometrioid carcinoma | Female | >=65 | I/II | Unknown | Unknown | SD |
| PPCDC | SNV | Missense_Mutation | novel | c.592N>T | p.His198Tyr | p.H198Y | Q96CD2 | protein_coding | tolerated(0.33) | benign(0.11) | TCGA-EO-A22U-01 | Endometrium | uterine corpus endometrioid carcinoma | Female | >=65 | I/II | Unknown | Unknown | SD |
| Page: 1 2 |
Top |
Related drugs of malignant transformation related genes |
| Identification of chemicals and drugs interact with genes involved in malignant transfromation |
| (DGIdb 4.0) |
| Entrez ID | Symbol | Category | Interaction Types | Drug Claim Name | Drug Name | PMIDs |
| 60490 | PPCDC | ENZYME | trastuzumab | TRASTUZUMAB | ||
| 60490 | PPCDC | ENZYME | FEC100 | |||
| 60490 | PPCDC | ENZYME | gemcitabine | GEMCITABINE | ||
| 60490 | PPCDC | ENZYME | docetaxel | DOCETAXEL | ||
| 60490 | PPCDC | ENZYME | zoledronate | ZOLEDRONIC ACID |
| Page: 1 |

Copyright 2023-Present -The University of Texas Health Science Center at Houston |