
|
|||||
|
 | |
| |
| |
| |
| |
| |
|
Gene: PPARG |
Gene summary for PPARG |
| Gene information | Species | Human | Gene symbol | PPARG | Gene ID | 5468 |
| Gene name | peroxisome proliferator activated receptor gamma | |
| Gene Alias | CIMT1 | |
| Cytomap | 3p25.2 | |
| Gene Type | protein-coding | GO ID | GO:0000003 | UniProtAcc | E9PFX5 |
Top |
Malignant transformation analysis |
| Identification of the aberrant gene expression in precancerous and cancerous lesions by comparing the gene expression of stem-like cells in diseased tissues with normal stem cells |
| Entrez ID | Symbol | Replicates | Species | Organ | Tissue | Adj P-value | Log2FC | Malignancy |
| 5468 | PPARG | HTA11_1938_2000001011 | Human | Colorectum | AD | 7.20e-21 | 1.01e+00 | -0.0811 |
| 5468 | PPARG | HTA11_78_2000001011 | Human | Colorectum | AD | 1.38e-06 | 8.63e-01 | -0.1088 |
| 5468 | PPARG | HTA11_347_2000001011 | Human | Colorectum | AD | 1.56e-26 | 1.16e+00 | -0.1954 |
| 5468 | PPARG | HTA11_411_2000001011 | Human | Colorectum | SER | 3.25e-02 | 2.52e-01 | -0.2602 |
| 5468 | PPARG | HTA11_83_2000001011 | Human | Colorectum | SER | 6.44e-19 | 1.20e+00 | -0.1526 |
| 5468 | PPARG | HTA11_696_2000001011 | Human | Colorectum | AD | 4.52e-03 | 4.90e-01 | -0.1464 |
| 5468 | PPARG | HTA11_546_2000001011 | Human | Colorectum | AD | 4.77e-02 | 5.85e-01 | -0.0842 |
| 5468 | PPARG | HTA11_866_3004761011 | Human | Colorectum | AD | 5.81e-12 | -5.92e-01 | 0.096 |
| 5468 | PPARG | HTA11_8622_2000001021 | Human | Colorectum | SER | 1.79e-02 | -5.20e-01 | 0.0528 |
| 5468 | PPARG | HTA11_11156_2000001011 | Human | Colorectum | AD | 4.68e-02 | -7.13e-01 | 0.0397 |
| 5468 | PPARG | HTA11_99999970781_79442 | Human | Colorectum | MSS | 1.95e-06 | -4.00e-01 | 0.294 |
| 5468 | PPARG | HTA11_99999971662_82457 | Human | Colorectum | MSS | 1.78e-33 | -7.84e-01 | 0.3859 |
| 5468 | PPARG | HTA11_99999974143_84620 | Human | Colorectum | MSS | 7.36e-58 | -1.06e+00 | 0.3005 |
| 5468 | PPARG | A015-C-203 | Human | Colorectum | FAP | 5.57e-38 | -6.17e-01 | -0.1294 |
| 5468 | PPARG | A015-C-204 | Human | Colorectum | FAP | 5.08e-03 | -2.30e-01 | -0.0228 |
| 5468 | PPARG | A014-C-040 | Human | Colorectum | FAP | 1.65e-15 | -8.37e-01 | -0.1184 |
| 5468 | PPARG | A002-C-201 | Human | Colorectum | FAP | 3.29e-17 | -4.65e-01 | 0.0324 |
| 5468 | PPARG | A001-C-119 | Human | Colorectum | FAP | 3.16e-12 | -5.89e-01 | -0.1557 |
| 5468 | PPARG | A001-C-108 | Human | Colorectum | FAP | 4.19e-14 | -2.12e-01 | -0.0272 |
| 5468 | PPARG | A002-C-021 | Human | Colorectum | FAP | 2.73e-05 | -1.85e-01 | 0.1171 |
| Page: 1 2 3 4 |
| Tissue | Expression Dynamics | Abbreviation |
| Colorectum (GSE201348) |  | FAP: Familial adenomatous polyposis |
| CRC: Colorectal cancer | ||
| Colorectum (HTA11) |  | AD: Adenomas |
| SER: Sessile serrated lesions | ||
| MSI-H: Microsatellite-high colorectal cancer | ||
| MSS: Microsatellite stable colorectal cancer | ||
| Esophagus | 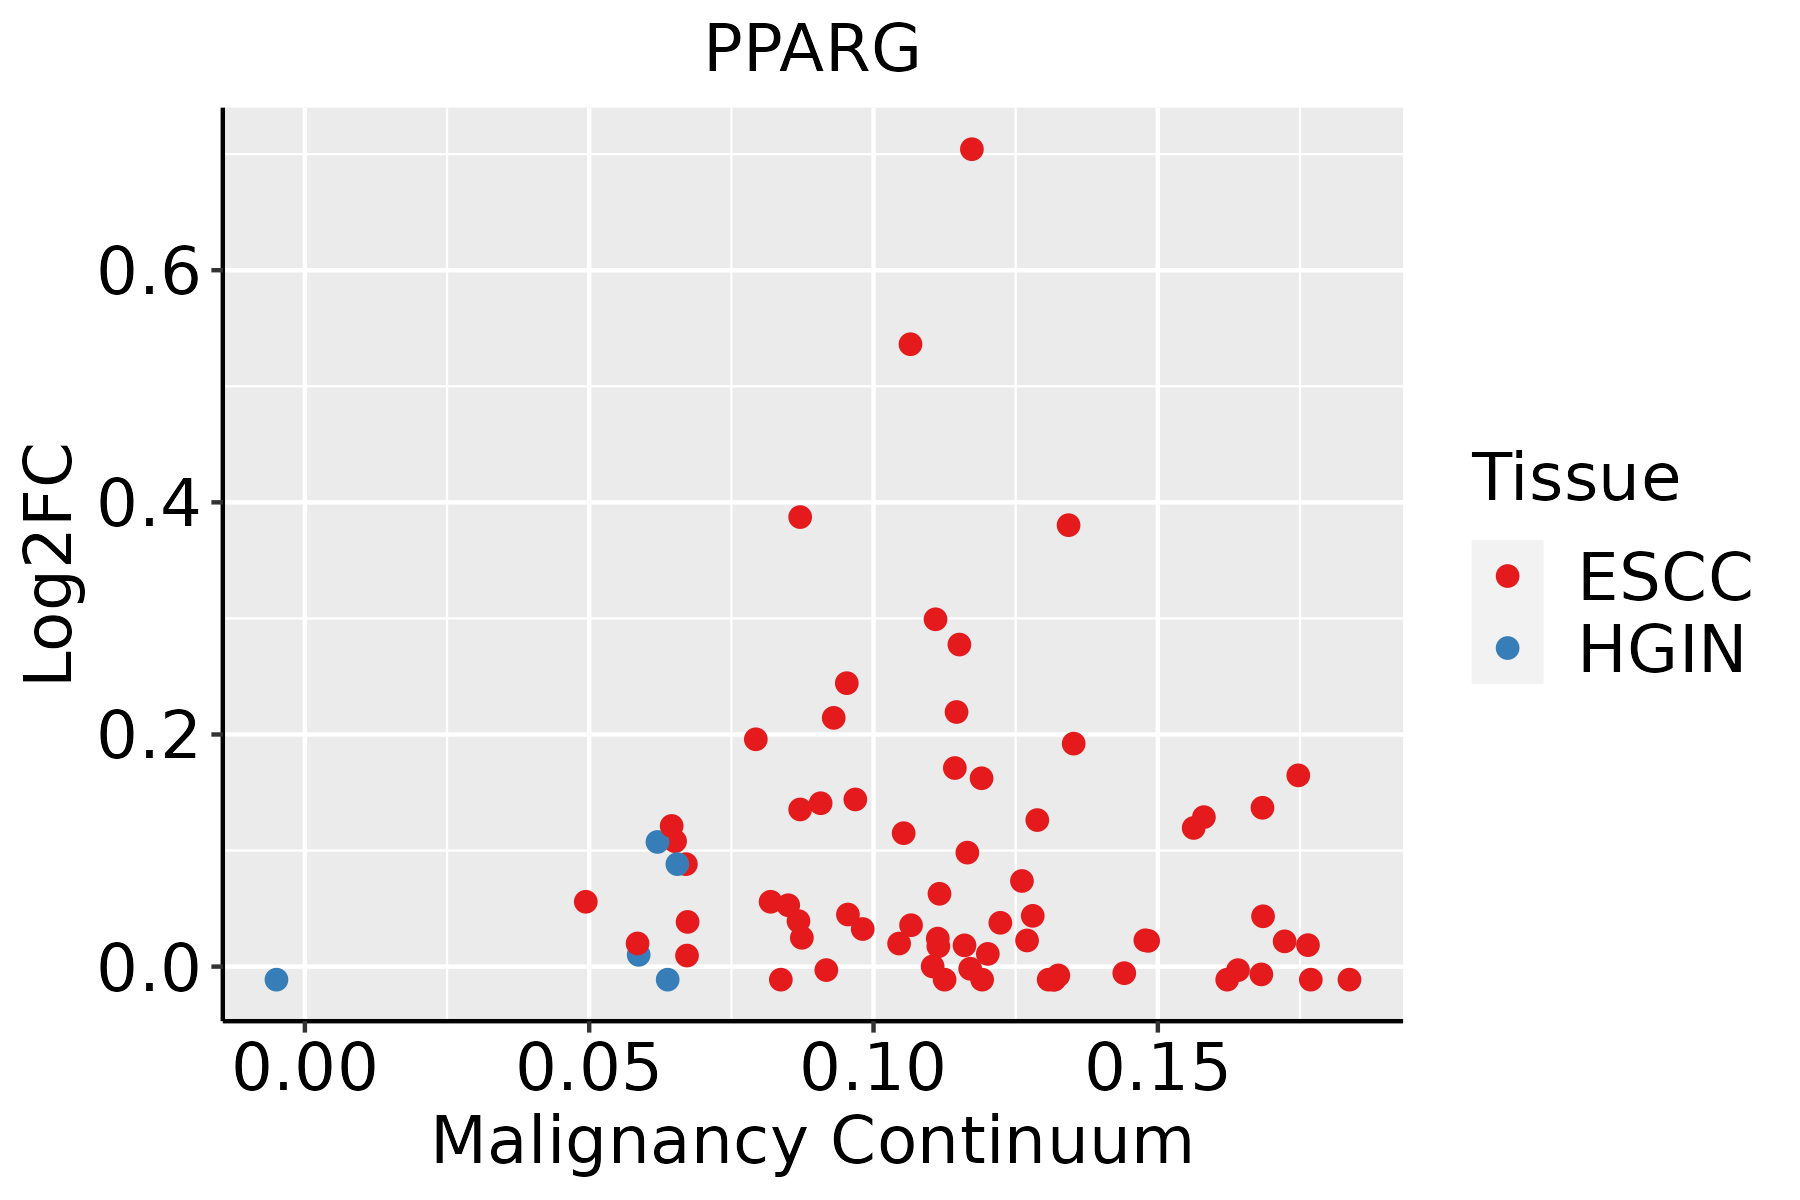 | ESCC: Esophageal squamous cell carcinoma |
| HGIN: High-grade intraepithelial neoplasias | ||
| LGIN: Low-grade intraepithelial neoplasias | ||
| Liver | 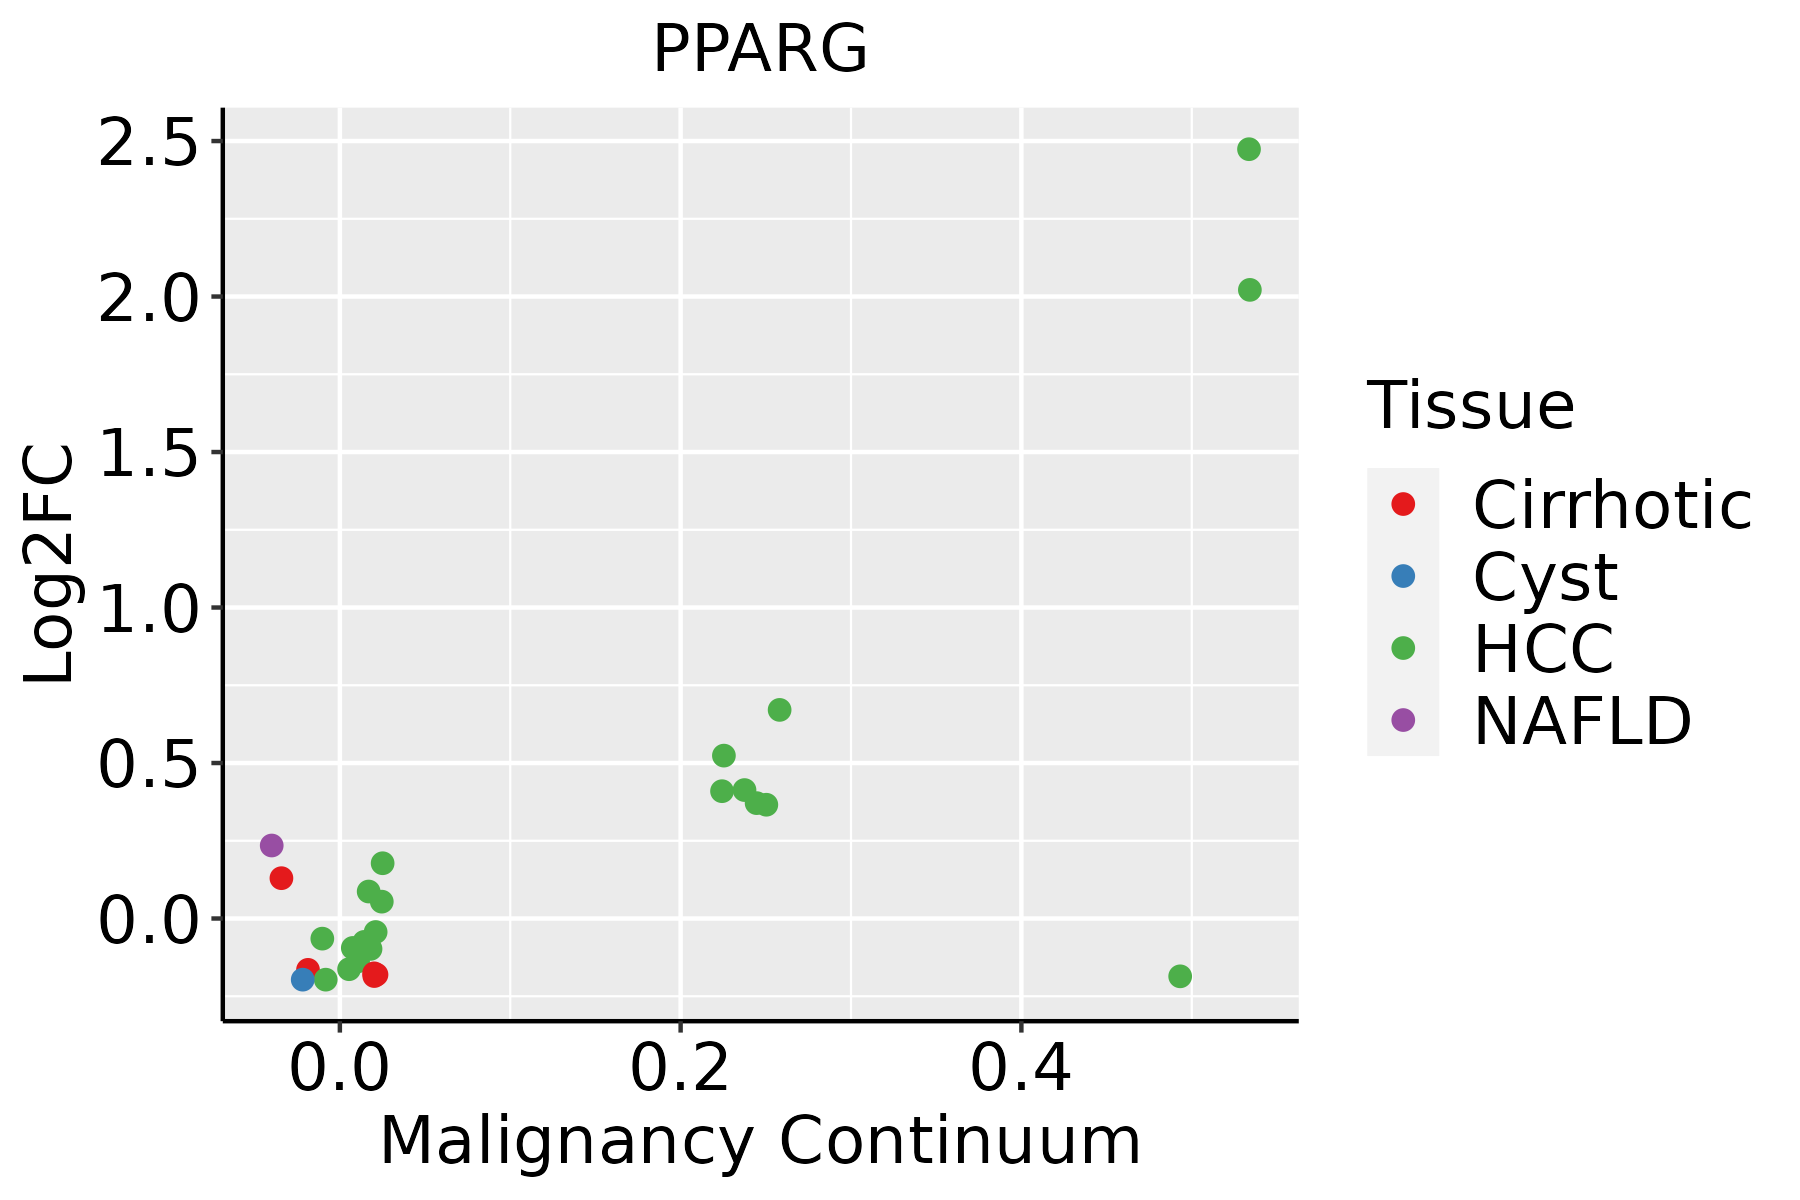 | HCC: Hepatocellular carcinoma |
| NAFLD: Non-alcoholic fatty liver disease | ||
| Lung |  | AAH: Atypical adenomatous hyperplasia |
| AIS: Adenocarcinoma in situ | ||
| IAC: Invasive lung adenocarcinoma | ||
| MIA: Minimally invasive adenocarcinoma |
| ∗log2FC in expression of this searched gene in stem-like cells from each diseased tissue sample relative to stem-like cells in normal samples in each tissue plotted against the malignancy continuum. Samples are colored based on if they are from different disease stage. |
Top |
Malignant transformation related pathway analysis |
| Find out the enriched GO biological processes and KEGG pathways involved in transition from healthy to precancer to cancer |
| Tissue | Disease Stage | Enriched GO biological Processes |
| Colorectum | AD |  |
| Colorectum | SER |  |
| Colorectum | MSS |  |
| Colorectum | MSI-H |  |
| Colorectum | FAP |  |
| ∗Top 15 enriched GO BP terms are showed in the bar plot of each disease state in each tissue. Each row represents a significant GO biological process which is colored according to the -log10(p.adjust). |
| Page: 1 2 3 4 5 6 7 8 9 |
| GO ID | Tissue | Disease Stage | Description | Gene Ratio | Bg Ratio | pvalue | p.adjust | Count |
| GO:000701510 | Cervix | CC | actin filament organization | 109/2311 | 442/18723 | 4.92e-13 | 2.45e-10 | 109 |
| GO:000697910 | Cervix | CC | response to oxidative stress | 102/2311 | 446/18723 | 2.99e-10 | 4.36e-08 | 102 |
| GO:000030210 | Cervix | CC | response to reactive oxygen species | 56/2311 | 222/18723 | 1.00e-07 | 5.25e-06 | 56 |
| GO:006219710 | Cervix | CC | cellular response to chemical stress | 76/2311 | 337/18723 | 1.01e-07 | 5.25e-06 | 76 |
| GO:003009910 | Cervix | CC | myeloid cell differentiation | 83/2311 | 381/18723 | 1.31e-07 | 6.42e-06 | 83 |
| GO:190370610 | Cervix | CC | regulation of hemopoiesis | 80/2311 | 367/18723 | 2.14e-07 | 9.55e-06 | 80 |
| GO:004854510 | Cervix | CC | response to steroid hormone | 74/2311 | 339/18723 | 5.71e-07 | 2.09e-05 | 74 |
| GO:00305229 | Cervix | CC | intracellular receptor signaling pathway | 60/2311 | 265/18723 | 1.89e-06 | 5.97e-05 | 60 |
| GO:003459910 | Cervix | CC | cellular response to oxidative stress | 63/2311 | 288/18723 | 3.58e-06 | 9.50e-05 | 63 |
| GO:00510904 | Cervix | CC | regulation of DNA-binding transcription factor activity | 87/2311 | 440/18723 | 4.85e-06 | 1.22e-04 | 87 |
| GO:19021056 | Cervix | CC | regulation of leukocyte differentiation | 61/2311 | 279/18723 | 5.16e-06 | 1.29e-04 | 61 |
| GO:004563710 | Cervix | CC | regulation of myeloid cell differentiation | 48/2311 | 210/18723 | 1.49e-05 | 2.93e-04 | 48 |
| GO:00018949 | Cervix | CC | tissue homeostasis | 57/2311 | 268/18723 | 2.43e-05 | 4.21e-04 | 57 |
| GO:00025738 | Cervix | CC | myeloid leukocyte differentiation | 47/2311 | 208/18723 | 2.48e-05 | 4.27e-04 | 47 |
| GO:00456397 | Cervix | CC | positive regulation of myeloid cell differentiation | 28/2311 | 103/18723 | 3.56e-05 | 5.70e-04 | 28 |
| GO:00319609 | Cervix | CC | response to corticosteroid | 39/2311 | 167/18723 | 5.48e-05 | 8.06e-04 | 39 |
| GO:00602498 | Cervix | CC | anatomical structure homeostasis | 63/2311 | 314/18723 | 6.03e-05 | 8.68e-04 | 63 |
| GO:00513849 | Cervix | CC | response to glucocorticoid | 35/2311 | 148/18723 | 9.87e-05 | 1.27e-03 | 35 |
| GO:003530310 | Cervix | CC | regulation of dephosphorylation | 31/2311 | 128/18723 | 1.52e-04 | 1.83e-03 | 31 |
| GO:003461410 | Cervix | CC | cellular response to reactive oxygen species | 35/2311 | 155/18723 | 2.59e-04 | 2.85e-03 | 35 |
| Page: 1 2 3 4 5 6 7 8 9 10 11 12 13 14 15 16 17 18 19 20 21 22 23 24 25 26 27 28 29 30 31 32 33 34 35 36 37 38 39 40 41 42 43 44 45 46 47 48 49 50 51 52 53 54 55 56 57 58 59 60 61 62 63 64 65 66 67 68 69 70 71 72 73 74 75 76 77 78 79 80 81 82 83 84 85 86 87 88 89 90 91 92 93 94 95 96 97 98 99 100 101 102 103 104 105 106 107 108 109 110 111 |
| Pathway ID | Tissue | Disease Stage | Description | Gene Ratio | Bg Ratio | pvalue | p.adjust | qvalue | Count |
| hsa05016 | Colorectum | AD | Huntington disease | 147/2092 | 306/8465 | 1.93e-19 | 9.26e-18 | 5.91e-18 | 147 |
| hsa04714 | Colorectum | AD | Thermogenesis | 120/2092 | 232/8465 | 2.76e-19 | 1.16e-17 | 7.37e-18 | 120 |
| hsa04932 | Colorectum | AD | Non-alcoholic fatty liver disease | 90/2092 | 155/8465 | 4.83e-19 | 1.80e-17 | 1.15e-17 | 90 |
| hsa05216 | Colorectum | AD | Thyroid cancer | 21/2092 | 37/8465 | 3.05e-05 | 2.76e-04 | 1.76e-04 | 21 |
| hsa04152 | Colorectum | AD | AMPK signaling pathway | 47/2092 | 121/8465 | 3.74e-04 | 2.82e-03 | 1.80e-03 | 47 |
| hsa05417 | Colorectum | AD | Lipid and atherosclerosis | 73/2092 | 215/8465 | 1.31e-03 | 8.27e-03 | 5.27e-03 | 73 |
| hsa04211 | Colorectum | AD | Longevity regulating pathway | 33/2092 | 89/8465 | 6.15e-03 | 2.68e-02 | 1.71e-02 | 33 |
| hsa050161 | Colorectum | AD | Huntington disease | 147/2092 | 306/8465 | 1.93e-19 | 9.26e-18 | 5.91e-18 | 147 |
| hsa047141 | Colorectum | AD | Thermogenesis | 120/2092 | 232/8465 | 2.76e-19 | 1.16e-17 | 7.37e-18 | 120 |
| hsa049321 | Colorectum | AD | Non-alcoholic fatty liver disease | 90/2092 | 155/8465 | 4.83e-19 | 1.80e-17 | 1.15e-17 | 90 |
| hsa052161 | Colorectum | AD | Thyroid cancer | 21/2092 | 37/8465 | 3.05e-05 | 2.76e-04 | 1.76e-04 | 21 |
| hsa041521 | Colorectum | AD | AMPK signaling pathway | 47/2092 | 121/8465 | 3.74e-04 | 2.82e-03 | 1.80e-03 | 47 |
| hsa054171 | Colorectum | AD | Lipid and atherosclerosis | 73/2092 | 215/8465 | 1.31e-03 | 8.27e-03 | 5.27e-03 | 73 |
| hsa042111 | Colorectum | AD | Longevity regulating pathway | 33/2092 | 89/8465 | 6.15e-03 | 2.68e-02 | 1.71e-02 | 33 |
| hsa047142 | Colorectum | SER | Thermogenesis | 106/1580 | 232/8465 | 1.15e-21 | 6.34e-20 | 4.61e-20 | 106 |
| hsa050162 | Colorectum | SER | Huntington disease | 127/1580 | 306/8465 | 3.29e-21 | 1.37e-19 | 9.92e-20 | 127 |
| hsa049322 | Colorectum | SER | Non-alcoholic fatty liver disease | 75/1580 | 155/8465 | 2.16e-17 | 5.99e-16 | 4.35e-16 | 75 |
| hsa054172 | Colorectum | SER | Lipid and atherosclerosis | 55/1580 | 215/8465 | 6.83e-03 | 3.77e-02 | 2.74e-02 | 55 |
| hsa047143 | Colorectum | SER | Thermogenesis | 106/1580 | 232/8465 | 1.15e-21 | 6.34e-20 | 4.61e-20 | 106 |
| hsa050163 | Colorectum | SER | Huntington disease | 127/1580 | 306/8465 | 3.29e-21 | 1.37e-19 | 9.92e-20 | 127 |
| Page: 1 2 3 4 5 6 |
Top |
Cell-cell communication analysis |
| Identification of potential cell-cell interactions between two cell types and their ligand-receptor pairs for different disease states |
| Ligand | Receptor | LRpair | Pathway | Tissue | Disease Stage |
| Page: 1 |
Top |
Single-cell gene regulatory network inference analysis |
| Find out the significant the regulons (TFs) and the target genes of each regulon across cell types for different disease states |
| TF | Cell Type | Tissue | Disease Stage | Target Gene | RSS | Regulon Activity |
| PPARG | M1MAC | Breast | DCIS | FABP4,CD36,RBP7, etc. | 1.07e-01 |  |
| PPARG | MYOFIB | Cervix | N_HPV | RBP7,SATB1,BCDIN3D, etc. | 3.17e-02 |  |
| PPARG | ADIPO | Colorectum | ADJ | CERS6,CD36,GHR, etc. | 8.37e-02 |  |
| PPARG | ADIPO | Colorectum | CRC | CERS6,CD36,GHR, etc. | 2.51e-01 |  |
| PPARG | PVA | Endometrium | ADJ | POP1,CHRM3,BTNL9, etc. | 4.18e-01 |  |
| PPARG | LYMEND | Endometrium | ADJ | POP1,CHRM3,BTNL9, etc. | 3.72e-02 | |
| PPARG | PVA | Endometrium | AEH | POP1,CHRM3,BTNL9, etc. | 4.00e-01 |  |
| PPARG | PLA | Liver | Cirrhotic | EXT1,AC016831.7,TPRG1, etc. | 9.06e-02 |  |
| PPARG | KUP | Liver | Cirrhotic | EXT1,AC016831.7,TPRG1, etc. | 1.20e-01 | |
| PPARG | pDC | Liver | HCC | EXT1,AC016831.7,TPRG1, etc. | 4.24e-02 |  |
| ∗The dot plots of a searched regulon are shown for all cell subpopulations in each disease state of each tissue based on the regulon specific score inferred using pySCENIC and by calculating the average expression. |
| Page: 1 2 3 4 |
Top |
Somatic mutation of malignant transformation related genes |
| Annotation of somatic variants for genes involved in malignant transformation |
| Hugo Symbol | Variant Class | Variant Classification | dbSNP RS | HGVSc | HGVSp | HGVSp Short | SWISSPROT | BIOTYPE | SIFT | PolyPhen | Tumor Sample Barcode | Tissue | Histology | Sex | Age | Stage | Therapy Types | Drugs | Outcome |
| PPARG | SNV | Missense_Mutation | c.724C>G | p.Leu242Val | p.L242V | P37231 | protein_coding | deleterious(0.02) | probably_damaging(0.987) | TCGA-A2-A0YC-01 | Breast | breast invasive carcinoma | Female | <65 | I/II | Hormone Therapy | arimidex | PD | |
| PPARG | SNV | Missense_Mutation | rs140204299 | c.1154N>A | p.Arg385Gln | p.R385Q | P37231 | protein_coding | deleterious(0.02) | probably_damaging(0.999) | TCGA-AN-A046-01 | Breast | breast invasive carcinoma | Female | >=65 | I/II | Unknown | Unknown | SD |
| PPARG | SNV | Missense_Mutation | rs777334819 | c.235N>A | p.Glu79Lys | p.E79K | P37231 | protein_coding | tolerated_low_confidence(0.26) | benign(0.039) | TCGA-EW-A1IZ-01 | Breast | breast invasive carcinoma | Female | <65 | III/IV | Chemotherapy | taxotere | SD |
| PPARG | SNV | Missense_Mutation | c.724C>G | p.Leu242Val | p.L242V | P37231 | protein_coding | deleterious(0.02) | probably_damaging(0.987) | TCGA-OL-A66H-01 | Breast | breast invasive carcinoma | Female | >=65 | I/II | Unknown | Unknown | SD | |
| PPARG | SNV | Missense_Mutation | novel | c.489N>G | p.Phe163Leu | p.F163L | P37231 | protein_coding | deleterious(0) | possibly_damaging(0.535) | TCGA-PE-A5DE-01 | Breast | breast invasive carcinoma | Female | <65 | I/II | Chemotherapy | taxotere | CR |
| PPARG | insertion | Frame_Shift_Ins | novel | c.549_550insA | p.Ser186LysfsTer2 | p.S186Kfs*2 | P37231 | protein_coding | TCGA-AN-A0FW-01 | Breast | breast invasive carcinoma | Female | >=65 | III/IV | Unknown | Unknown | SD | ||
| PPARG | insertion | Nonsense_Mutation | novel | c.64_65insTGTTAGTAATGTAGGGATG | p.Ser22LeufsTer5 | p.S22Lfs*5 | P37231 | protein_coding | TCGA-BH-A0BR-01 | Breast | breast invasive carcinoma | Female | <65 | I/II | Unknown | Unknown | SD | ||
| PPARG | SNV | Missense_Mutation | c.181N>C | p.Asp61His | p.D61H | P37231 | protein_coding | deleterious_low_confidence(0.04) | probably_damaging(0.969) | TCGA-C5-A3HE-01 | Cervix | cervical & endocervical cancer | Female | <65 | I/II | Unknown | Unknown | PD | |
| PPARG | SNV | Missense_Mutation | c.1477N>T | p.Leu493Phe | p.L493F | P37231 | protein_coding | deleterious(0) | probably_damaging(0.998) | TCGA-G4-6307-01 | Colorectum | colon adenocarcinoma | Female | <65 | III/IV | Chemotherapy | fluorouracil | SD | |
| PPARG | deletion | Frame_Shift_Del | c.550delN | p.Ser186ValfsTer47 | p.S186Vfs*47 | P37231 | protein_coding | TCGA-AA-3947-01 | Colorectum | colon adenocarcinoma | Female | <65 | I/II | Unknown | Unknown | SD |
| Page: 1 2 3 4 5 |
Top |
Related drugs of malignant transformation related genes |
| Identification of chemicals and drugs interact with genes involved in malignant transfromation |
| (DGIdb 4.0) |
| Entrez ID | Symbol | Category | Interaction Types | Drug Claim Name | Drug Name | PMIDs |
| 5468 | PPARG | CLINICALLY ACTIONABLE, NUCLEAR HORMONE RECEPTOR, DRUGGABLE GENOME | GTF505 | |||
| 5468 | PPARG | CLINICALLY ACTIONABLE, NUCLEAR HORMONE RECEPTOR, DRUGGABLE GENOME | BENSULIDE | BENSULIDE | ||
| 5468 | PPARG | CLINICALLY ACTIONABLE, NUCLEAR HORMONE RECEPTOR, DRUGGABLE GENOME | agonist | 135650496 | ||
| 5468 | PPARG | CLINICALLY ACTIONABLE, NUCLEAR HORMONE RECEPTOR, DRUGGABLE GENOME | SHINPTEROCARPIN | SHINPTEROCARPIN | 20022509 | |
| 5468 | PPARG | CLINICALLY ACTIONABLE, NUCLEAR HORMONE RECEPTOR, DRUGGABLE GENOME | TREPROSTINIL | TREPROSTINIL | ||
| 5468 | PPARG | CLINICALLY ACTIONABLE, NUCLEAR HORMONE RECEPTOR, DRUGGABLE GENOME | modulator | CHEMBL490029 | MK-0533 | |
| 5468 | PPARG | CLINICALLY ACTIONABLE, NUCLEAR HORMONE RECEPTOR, DRUGGABLE GENOME | DICHLOROPHEN | DICHLOROPHEN | ||
| 5468 | PPARG | CLINICALLY ACTIONABLE, NUCLEAR HORMONE RECEPTOR, DRUGGABLE GENOME | FLUDIOXONIL | FLUDIOXONIL | ||
| 5468 | PPARG | CLINICALLY ACTIONABLE, NUCLEAR HORMONE RECEPTOR, DRUGGABLE GENOME | ETHYL EICOSAPENTAENOIC ACID | |||
| 5468 | PPARG | CLINICALLY ACTIONABLE, NUCLEAR HORMONE RECEPTOR, DRUGGABLE GENOME | AMORFRUTIN A | AMORFRUTIN A | 25938459 |
| Page: 1 2 3 4 5 6 7 8 9 10 11 12 13 14 15 16 17 18 19 20 21 22 23 24 25 |

Copyright 2023-Present -The University of Texas Health Science Center at Houston |