
|
|||||
|
 | |
| |
| |
| |
| |
| |
|
Gene: PPAN |
Gene summary for PPAN |
| Gene information | Species | Human | Gene symbol | PPAN | Gene ID | 56342 |
| Gene name | peter pan homolog | |
| Gene Alias | BXDC3 | |
| Cytomap | 19p13.2 | |
| Gene Type | protein-coding | GO ID | GO:0000027 | UniProtAcc | A8MV53 |
Top |
Malignant transformation analysis |
| Identification of the aberrant gene expression in precancerous and cancerous lesions by comparing the gene expression of stem-like cells in diseased tissues with normal stem cells |
| Entrez ID | Symbol | Replicates | Species | Organ | Tissue | Adj P-value | Log2FC | Malignancy |
| 56342 | PPAN | C04 | Human | Oral cavity | OSCC | 5.03e-20 | 8.69e-01 | 0.2633 |
| 56342 | PPAN | C21 | Human | Oral cavity | OSCC | 3.52e-34 | 1.04e+00 | 0.2678 |
| 56342 | PPAN | C30 | Human | Oral cavity | OSCC | 3.13e-15 | 7.66e-01 | 0.3055 |
| 56342 | PPAN | C38 | Human | Oral cavity | OSCC | 1.86e-07 | 9.50e-01 | 0.172 |
| 56342 | PPAN | C43 | Human | Oral cavity | OSCC | 1.86e-38 | 6.27e-01 | 0.1704 |
| 56342 | PPAN | C46 | Human | Oral cavity | OSCC | 8.60e-10 | 3.37e-01 | 0.1673 |
| 56342 | PPAN | C51 | Human | Oral cavity | OSCC | 2.54e-07 | 5.37e-01 | 0.2674 |
| 56342 | PPAN | C57 | Human | Oral cavity | OSCC | 3.91e-05 | 3.22e-01 | 0.1679 |
| 56342 | PPAN | C08 | Human | Oral cavity | OSCC | 1.62e-17 | 4.39e-01 | 0.1919 |
| 56342 | PPAN | LN46 | Human | Oral cavity | OSCC | 6.06e-12 | 4.97e-01 | 0.1666 |
| 56342 | PPAN | LP15 | Human | Oral cavity | LP | 6.61e-04 | 7.42e-01 | 0.2174 |
| 56342 | PPAN | LP17 | Human | Oral cavity | LP | 2.11e-03 | 6.62e-01 | 0.2349 |
| 56342 | PPAN | SYSMH1 | Human | Oral cavity | OSCC | 8.99e-05 | 1.87e-01 | 0.1127 |
| 56342 | PPAN | SYSMH2 | Human | Oral cavity | OSCC | 4.11e-19 | 5.32e-01 | 0.2326 |
| 56342 | PPAN | SYSMH3 | Human | Oral cavity | OSCC | 9.25e-38 | 8.26e-01 | 0.2442 |
| 56342 | PPAN | SYSMH4 | Human | Oral cavity | OSCC | 2.03e-03 | 7.30e-02 | 0.1226 |
| 56342 | PPAN | SYSMH5 | Human | Oral cavity | OSCC | 7.91e-12 | 2.57e-01 | 0.0647 |
| 56342 | PPAN | SYSMH6 | Human | Oral cavity | OSCC | 3.04e-03 | 1.50e-01 | 0.1275 |
| 56342 | PPAN | P4_S8_cSCC | Human | Skin | cSCC | 3.23e-04 | 1.25e-01 | -0.3095 |
| 56342 | PPAN | P5_S10_cSCC | Human | Skin | cSCC | 2.46e-02 | 1.29e-02 | -0.299 |
| Page: 1 2 |
| Tissue | Expression Dynamics | Abbreviation |
| Oral Cavity | 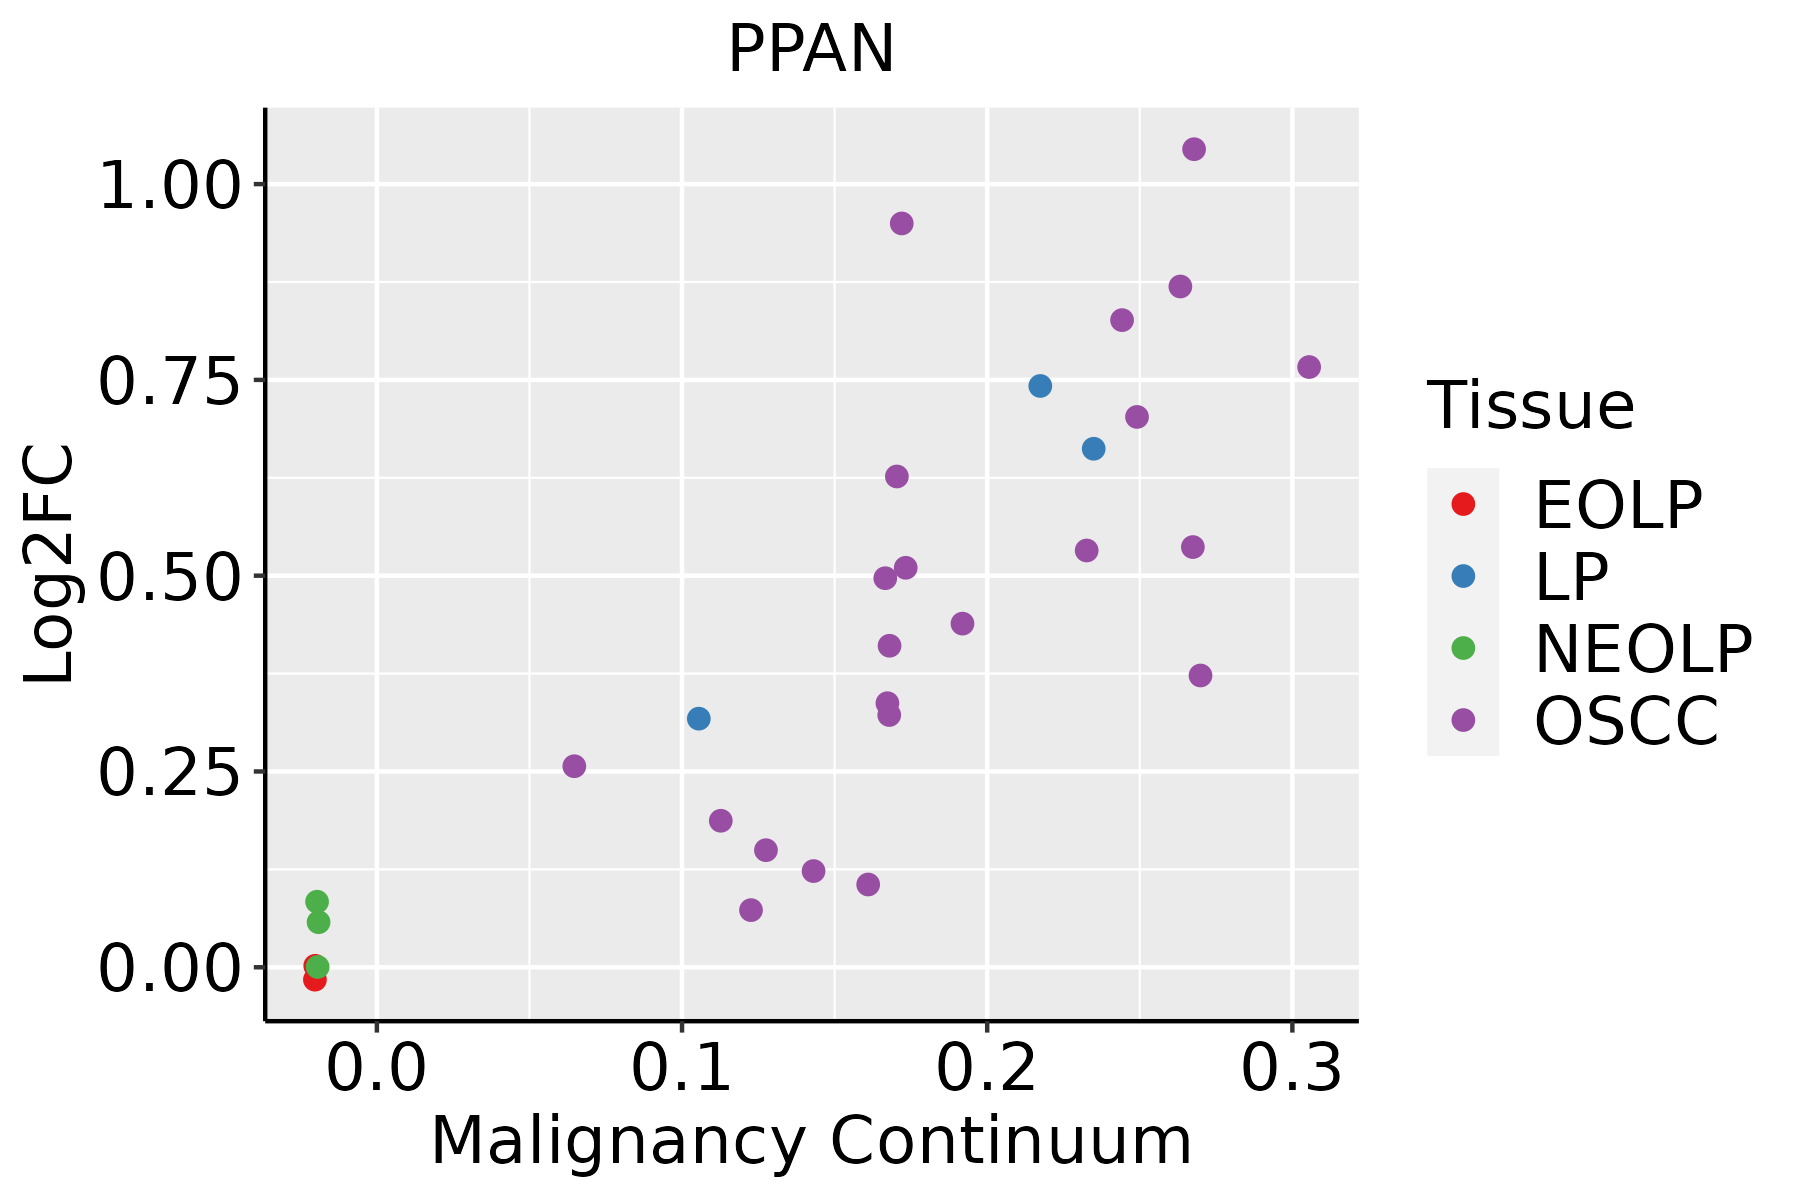 | EOLP: Erosive Oral lichen planus |
| LP: leukoplakia | ||
| NEOLP: Non-erosive oral lichen planus | ||
| OSCC: Oral squamous cell carcinoma | ||
| Skin | 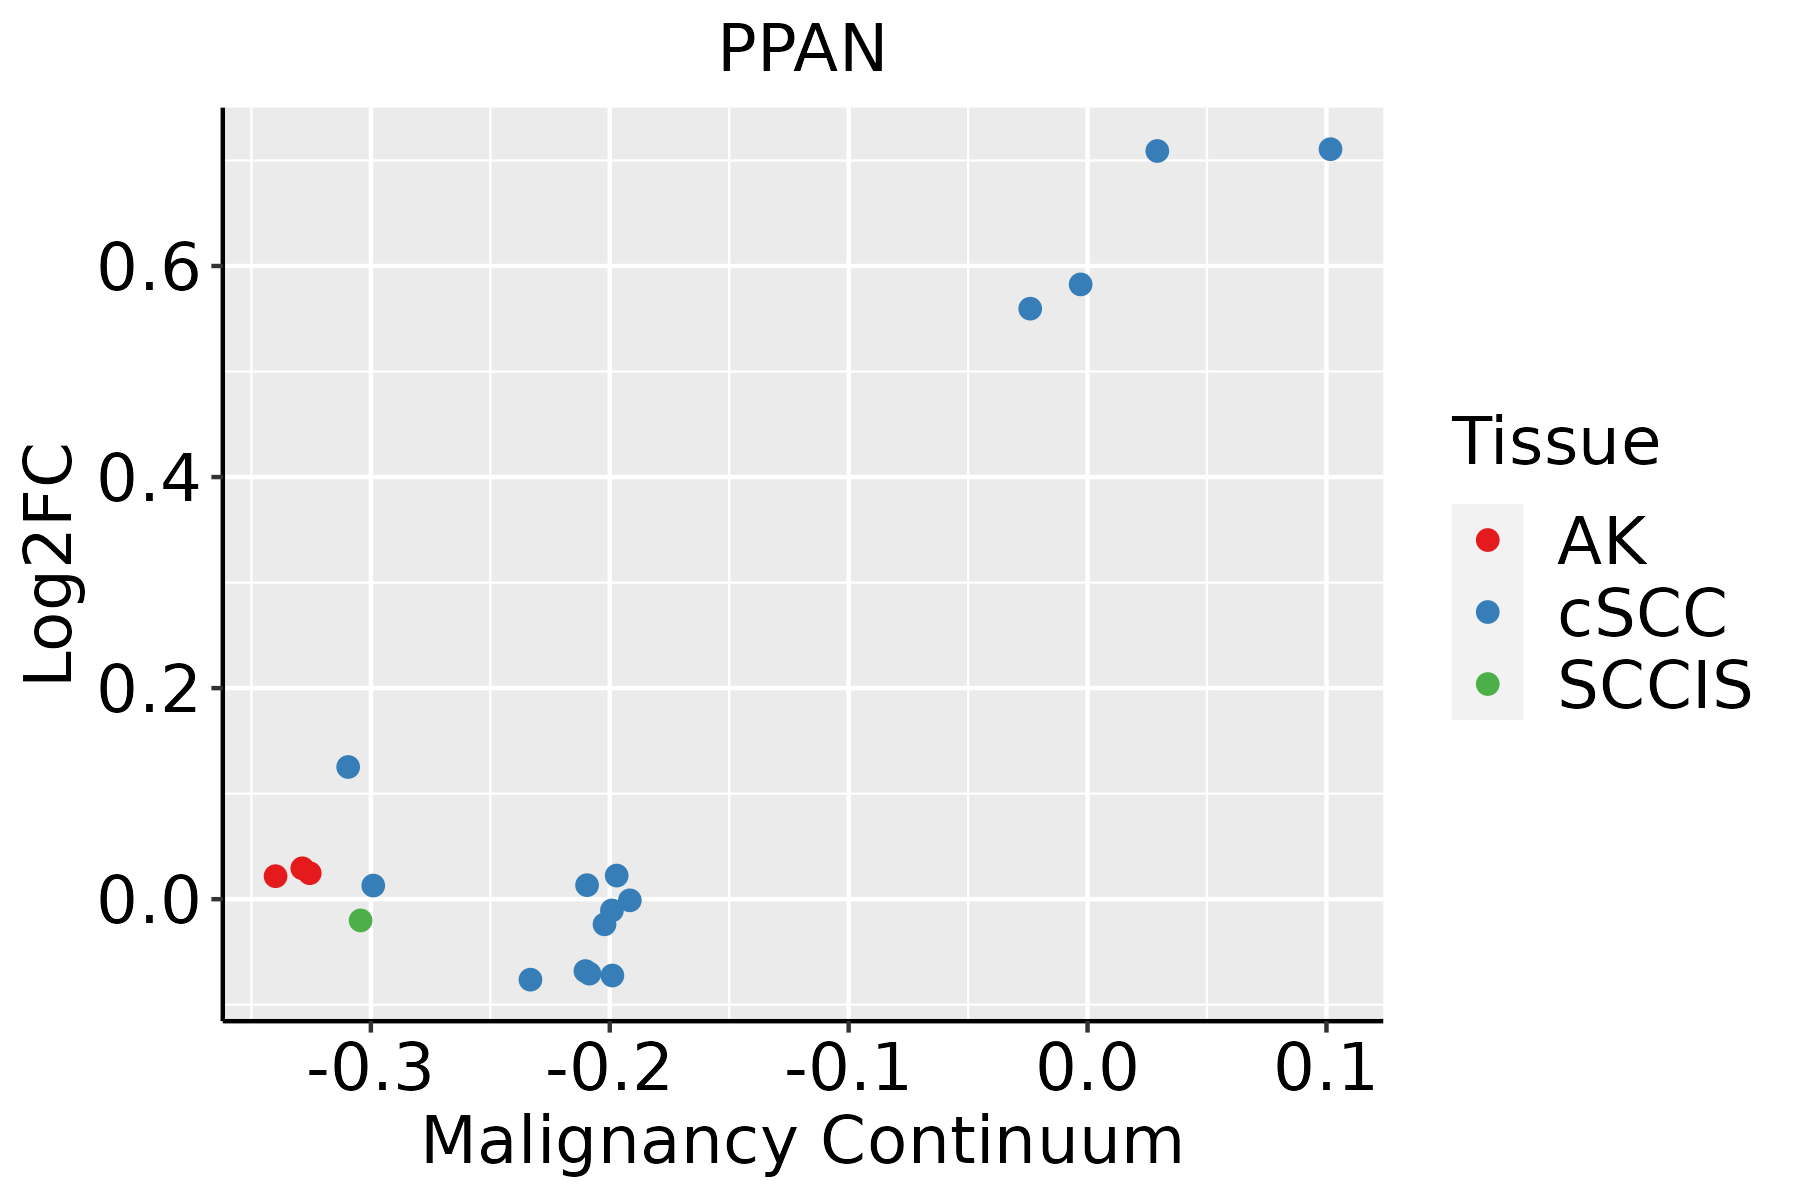 | AK: Actinic keratosis |
| cSCC: Cutaneous squamous cell carcinoma | ||
| SCCIS:squamous cell carcinoma in situ | ||
| Thyroid |  | ATC: Anaplastic thyroid cancer |
| HT: Hashimoto's thyroiditis | ||
| PTC: Papillary thyroid cancer |
| ∗log2FC in expression of this searched gene in stem-like cells from each diseased tissue sample relative to stem-like cells in normal samples in each tissue plotted against the malignancy continuum. Samples are colored based on if they are from different disease stage. |
Top |
Malignant transformation related pathway analysis |
| Find out the enriched GO biological processes and KEGG pathways involved in transition from healthy to precancer to cancer |
| Tissue | Disease Stage | Enriched GO biological Processes |
| Colorectum | AD |  |
| Colorectum | SER |  |
| Colorectum | MSS |  |
| Colorectum | MSI-H |  |
| Colorectum | FAP |  |
| ∗Top 15 enriched GO BP terms are showed in the bar plot of each disease state in each tissue. Each row represents a significant GO biological process which is colored according to the -log10(p.adjust). |
| Page: 1 2 3 4 5 6 7 8 9 |
| GO ID | Tissue | Disease Stage | Description | Gene Ratio | Bg Ratio | pvalue | p.adjust | Count |
| GO:002261320 | Oral cavity | OSCC | ribonucleoprotein complex biogenesis | 333/7305 | 463/18723 | 8.28e-48 | 5.24e-44 | 333 |
| GO:004225420 | Oral cavity | OSCC | ribosome biogenesis | 230/7305 | 299/18723 | 3.22e-41 | 6.80e-38 | 230 |
| GO:000636410 | Oral cavity | OSCC | rRNA processing | 172/7305 | 225/18723 | 1.57e-30 | 1.24e-27 | 172 |
| GO:00344709 | Oral cavity | OSCC | ncRNA processing | 263/7305 | 395/18723 | 4.38e-29 | 2.78e-26 | 263 |
| GO:001607210 | Oral cavity | OSCC | rRNA metabolic process | 176/7305 | 236/18723 | 6.51e-29 | 3.24e-26 | 176 |
| GO:00346605 | Oral cavity | OSCC | ncRNA metabolic process | 296/7305 | 485/18723 | 2.94e-23 | 6.65e-21 | 296 |
| GO:007182620 | Oral cavity | OSCC | ribonucleoprotein complex subunit organization | 152/7305 | 227/18723 | 1.05e-17 | 1.01e-15 | 152 |
| GO:002261820 | Oral cavity | OSCC | ribonucleoprotein complex assembly | 146/7305 | 220/18723 | 1.53e-16 | 1.23e-14 | 146 |
| GO:004227320 | Oral cavity | OSCC | ribosomal large subunit biogenesis | 61/7305 | 72/18723 | 1.52e-15 | 1.06e-13 | 61 |
| GO:004225520 | Oral cavity | OSCC | ribosome assembly | 49/7305 | 61/18723 | 4.73e-11 | 1.50e-09 | 49 |
| GO:000002720 | Oral cavity | OSCC | ribosomal large subunit assembly | 21/7305 | 27/18723 | 4.71e-05 | 3.96e-04 | 21 |
| GO:0022613110 | Oral cavity | LP | ribonucleoprotein complex biogenesis | 259/4623 | 463/18723 | 7.20e-48 | 2.25e-44 | 259 |
| GO:0042254110 | Oral cavity | LP | ribosome biogenesis | 173/4623 | 299/18723 | 8.97e-35 | 1.41e-31 | 173 |
| GO:000636418 | Oral cavity | LP | rRNA processing | 134/4623 | 225/18723 | 6.08e-29 | 4.23e-26 | 134 |
| GO:001607218 | Oral cavity | LP | rRNA metabolic process | 136/4623 | 236/18723 | 2.37e-27 | 1.48e-24 | 136 |
| GO:0071826110 | Oral cavity | LP | ribonucleoprotein complex subunit organization | 130/4623 | 227/18723 | 7.54e-26 | 3.63e-23 | 130 |
| GO:0022618110 | Oral cavity | LP | ribonucleoprotein complex assembly | 125/4623 | 220/18723 | 1.76e-24 | 6.91e-22 | 125 |
| GO:003447014 | Oral cavity | LP | ncRNA processing | 184/4623 | 395/18723 | 1.20e-21 | 3.12e-19 | 184 |
| GO:0042273110 | Oral cavity | LP | ribosomal large subunit biogenesis | 53/4623 | 72/18723 | 3.25e-18 | 5.82e-16 | 53 |
| GO:003466011 | Oral cavity | LP | ncRNA metabolic process | 205/4623 | 485/18723 | 6.46e-18 | 1.09e-15 | 205 |
| Page: 1 2 3 |
| Pathway ID | Tissue | Disease Stage | Description | Gene Ratio | Bg Ratio | pvalue | p.adjust | qvalue | Count |
| Page: 1 |
Top |
Cell-cell communication analysis |
| Identification of potential cell-cell interactions between two cell types and their ligand-receptor pairs for different disease states |
| Ligand | Receptor | LRpair | Pathway | Tissue | Disease Stage |
| Page: 1 |
Top |
Single-cell gene regulatory network inference analysis |
| Find out the significant the regulons (TFs) and the target genes of each regulon across cell types for different disease states |
| TF | Cell Type | Tissue | Disease Stage | Target Gene | RSS | Regulon Activity |
| ∗The dot plots of a searched regulon are shown for all cell subpopulations in each disease state of each tissue based on the regulon specific score inferred using pySCENIC and by calculating the average expression. |
| Page: 1 |
Top |
Somatic mutation of malignant transformation related genes |
| Annotation of somatic variants for genes involved in malignant transformation |
| Hugo Symbol | Variant Class | Variant Classification | dbSNP RS | HGVSc | HGVSp | HGVSp Short | SWISSPROT | BIOTYPE | SIFT | PolyPhen | Tumor Sample Barcode | Tissue | Histology | Sex | Age | Stage | Therapy Types | Drugs | Outcome |
| PPAN | SNV | Missense_Mutation | c.67N>C | p.Glu23Gln | p.E23Q | Q9NQ55 | protein_coding | deleterious(0.05) | possibly_damaging(0.535) | TCGA-A1-A0SI-01 | Breast | breast invasive carcinoma | Female | <65 | I/II | Unknown | Unknown | SD | |
| PPAN | SNV | Missense_Mutation | rs779050709 | c.1204N>G | p.Leu402Val | p.L402V | Q9NQ55 | protein_coding | deleterious(0.01) | benign(0.137) | TCGA-AR-A1AN-01 | Breast | breast invasive carcinoma | Female | <65 | I/II | Chemotherapy | cytoxan | SD |
| PPAN | insertion | In_Frame_Ins | novel | c.695_696insATTCTCCTGCCTCAGCCTCCCGAGTAGCTGGGACTA | p.Ala232_Thr233insPheSerCysLeuSerLeuProSerSerTrpAspTyr | p.A232_T233insFSCLSLPSSWDY | Q9NQ55 | protein_coding | TCGA-AR-A0TY-01 | Breast | breast invasive carcinoma | Female | <65 | I/II | Unspecific | Paclitaxel | PD | ||
| PPAN | SNV | Missense_Mutation | rs201530848 | c.1349N>A | p.Arg450Gln | p.R450Q | Q9NQ55 | protein_coding | tolerated(0.44) | benign(0) | TCGA-2W-A8YY-01 | Cervix | cervical & endocervical cancer | Female | <65 | I/II | Chemotherapy | cisplatin | CR |
| PPAN | SNV | Missense_Mutation | c.811C>T | p.Arg271Trp | p.R271W | Q9NQ55 | protein_coding | deleterious(0) | probably_damaging(0.995) | TCGA-EK-A3GJ-01 | Cervix | cervical & endocervical cancer | Female | <65 | I/II | Unknown | Unknown | SD | |
| PPAN | SNV | Missense_Mutation | rs759297854 | c.380G>A | p.Arg127Gln | p.R127Q | Q9NQ55 | protein_coding | deleterious(0.01) | possibly_damaging(0.794) | TCGA-A6-6140-01 | Colorectum | colon adenocarcinoma | Male | <65 | I/II | Chemotherapy | oxaliplatin | SD |
| PPAN | SNV | Missense_Mutation | rs769176738 | c.1135N>A | p.Asp379Asn | p.D379N | Q9NQ55 | protein_coding | tolerated(0.44) | benign(0.027) | TCGA-AD-6889-01 | Colorectum | colon adenocarcinoma | Male | >=65 | I/II | Chemotherapy | xeloda | PD |
| PPAN | SNV | Missense_Mutation | c.1003N>T | p.Arg335Cys | p.R335C | Q9NQ55 | protein_coding | deleterious(0.01) | possibly_damaging(0.676) | TCGA-AZ-6601-01 | Colorectum | colon adenocarcinoma | Male | >=65 | I/II | Unknown | Unknown | PD | |
| PPAN | SNV | Missense_Mutation | novel | c.280A>G | p.Asn94Asp | p.N94D | Q9NQ55 | protein_coding | tolerated(0.23) | benign(0.129) | TCGA-A5-A0G2-01 | Endometrium | uterine corpus endometrioid carcinoma | Female | <65 | III/IV | Unknown | Unknown | SD |
| PPAN | SNV | Missense_Mutation | rs200813035 | c.1262G>A | p.Arg421Gln | p.R421Q | Q9NQ55 | protein_coding | tolerated(0.32) | benign(0.012) | TCGA-A5-A0G2-01 | Endometrium | uterine corpus endometrioid carcinoma | Female | <65 | III/IV | Unknown | Unknown | SD |
| Page: 1 2 3 4 5 |
Top |
Related drugs of malignant transformation related genes |
| Identification of chemicals and drugs interact with genes involved in malignant transfromation |
| (DGIdb 4.0) |
| Entrez ID | Symbol | Category | Interaction Types | Drug Claim Name | Drug Name | PMIDs |
| Page: 1 |

Copyright 2023-Present -The University of Texas Health Science Center at Houston |